
G6
♾ A Graph Visualization Framework in JavaScript.
12,096 stars
TypeScript
1 file · ~1,003 tokens
#data-visualization#graph#graph-analytics#graph-drawing#graph-visualization#hacktoberfest#network#tree
298 Discovered Rules
•
~600,323 Estimated Tokens
Cursor Rule: translation
.cursor/rules/translation.mdc cursor-rule ~872 tokensDescription: 翻译
---
description: 翻译
globs:
alwaysApply: false
---
# Translation Guidelines for site/docs
When translating files under the `site/docs` directory, please adhere to the following guidelines:
1. **Consistency in Terminology**: Ensure that terminology is consistent throughout the document. Use a glossary if available to maintain uniformity in terms.
**Glossary**:
- 画布 (Canvas)
- 元素 (Element)
- 节点 (Node)
- 边 (Edge)
- 组合 (Combo)
- 交互 (Behavior)
- 布局 (Layout)
- 插件 (Plugin)
- 动画 (Animation)
- 数据处理 (Transform)
- 色板 (Palette)
- 配置项 (Option)
- 图数据 (Graph Data)
- 树图 (Tree Graph)
- 属性 (Property)
- 描述 (Description)
- 类型 (Type)
- 默认值 (Default Value)
- 必选 (Required)
2. **Adjust Hyperlinks**: Review and adjust hyperlinks to ensure they point to the correct translated sections or documents. Verify that all links are functional and correctly formatted.
- **Internal Links**: In the English version, all internal links should have a `/en` prefix, while the Chinese version should not have any prefix. Ensure this prefix is added to all internal links in English documents to avoid any oversight.
- **Anchor Points**: For anchor points following a `#`, if they contain Chinese characters, they should be adjusted to match the corresponding title in the English version rather than being directly translated.
- **External Links**: Convert external links appropriately to ensure they align with the language and context of the document.
3. **Direct Writing to Translated Documents**: Translations should be stored in corresponding `.en.md` or `.zh.md` files within the same directory. Ensure that the translated content is placed in the correct location within the document.
- When translating from Chinese to English, create or update the `.en.md` file in the same directory.
- When translating from English to Chinese, create or update the `.zh.md` file in the same directory.
4. **Support for Partial Content Translation**: Allow for the selection and translation of specific sections of content. Translated sections should be inserted into the appropriate location within the document, maintaining the logical flow and structure.
- **Full Document Translation**: If the entire document is selected for translation, replace the entire content with the translated version.
- **Partial Content Translation**: If only specific sections are selected, find the appropriate place to replace or insert the translated content, ensuring the document's logical flow and structure are maintained.
5. **Contextual Translation**: Avoid literal translations. Ensure that the translation fits the English context and conveys the intended meaning accurately.
6. **Direct Modification**: Translations should be directly modified in the corresponding `.en.md` or `.zh.md` files without returning the translated content separately. Ensure that the changes are saved in the correct file and location.
7. **Preserve Metadata Order**: Do not modify the `order` attribute in the page metadata during translation. This ensures that the document order remains consistent across different language versions.
8. **Add '/en' Prefix to Internal Links**: Ensure that all internal links in English documentation have the '/en' prefix to maintain consistency and correct navigation.
By following these guidelines, translations will be more accurate and consistent, facilitating easier review and integration into the documentation.
Api Skill
packages/site/docs/api/behavior.en.md anthropic-skill ~1,478 tokens---
title: Behavior
order: 8
---
## Overview of Behavior
Behavior is a core building block of G6, precisely defining the interaction between users and the graph. Each Behavior plugin is a highly encapsulated functional unit, integrating event listening, state management, and response handling logic for specific scenarios.
G6's built-in Behaviors cover most common interaction needs and provide a flexible extension mechanism, allowing developers to create customized interaction experiences based on business scenarios. For a complete list of behavior types, configuration options, and development examples, please refer to the [Behavior Overview](/en/manual/behavior/overview) section.
## API Reference
### Graph.getBehaviors()
Get all configured behaviors in the current graph.
```typescript
getBehaviors(): BehaviorOptions;
```
**Return Value**
- **Type**: [BehaviorOptions](#behavioroptions)
- **Description**: All configured behaviors in the current graph
**Example**
```typescript
// Get all current behaviors
const behaviors = graph.getBehaviors();
console.log('Current graph behaviors:', behaviors);
```
### Graph.setBehaviors(behaviors)
Set the behaviors of the graph, replacing all existing behaviors.
```typescript
setBehaviors(behaviors: BehaviorOptions | ((prev: BehaviorOptions) => BehaviorOptions)): void;
```
**Parameters**
| Parameter | Description | Type | Default | Required |
| --------- | ---------------------------------------------------------------------------------------------- | --------------------------------------------------------------------------------- | ------- | -------- |
| behaviors | New behavior configuration, or a function returning new configuration based on the current one | [BehaviorOptions](#behavioroptions) \| (prev: BehaviorOptions) => BehaviorOptions | - | ✓ |
**Note**
The set behaviors will completely replace the original ones. To add new behaviors, you can use functional updates:
```typescript
graph.setBehaviors((behaviors) => [...behaviors, { type: 'zoom-canvas' }]);
```
**Example 1**: Set basic behaviors
```typescript
// Set basic behaviors
graph.setBehaviors([
'drag-canvas', // Drag canvas
'zoom-canvas', // Zoom canvas
'drag-element', // Drag element
]);
```
**Example 2**: Set behaviors with configuration
```typescript
graph.setBehaviors([
// String form (using default configuration)
'drag-canvas',
// Object form (custom configuration)
{
type: 'zoom-canvas',
key: 'my-zoom', // Specify a unique identifier for subsequent updates
sensitivity: 1.5, // Zoom sensitivity
},
// Enable drag only on nodes
{
type: 'drag-element',
key: 'drag-node-only',
enable: (event) => event.targetType === 'node', // Enable drag only on nodes
},
]);
```
**Example 3**: Use functional updates
```typescript
// Add new behavior
graph.setBehaviors((currentBehaviors) => [
...currentBehaviors,
{
type: 'brush-select',
key: 'selection-brush',
},
]);
// Replace specific behavior
graph.setBehaviors((currentBehaviors) => {
// Filter out existing zoom behaviors
const filteredBehaviors = currentBehaviors.filter((behavior) => {
if (typeof behavior === 'string') return behavior !== 'zoom-canvas';
return behavior.type !== 'zoom-canvas';
});
// Add new zoom behavior configuration
return [
...filteredBehaviors,
{
type: 'zoom-canvas',
key: 'new-zoom',
enableOptimize: true,
},
];
});
```
### Graph.updateBehavior(behavior)
Update the configuration of a specific behavior, identified by the `key`.
```typescript
updateBehavior(behavior: UpdateBehaviorOption): void;
```
**Parameters**
| Parameter | Description | Type | Default | Required |
| --------- | --------------------------------------- | --------------------------------------------- | ------- | -------- |
| behavior | Configuration of the behavior to update | [UpdateBehaviorOption](#updatebehavioroption) | - | ✓ |
**Note**
To update a behavior, the original behavior configuration must specify the `key` field to accurately locate and update the behavior.
**Example 1**: Update behavior configuration
```typescript
// Specify key when initially setting behaviors
graph.setBehaviors([
{
type: 'zoom-canvas',
key: 'my-zoom-canvas',
sensitivity: 1.0,
},
]);
// Update behavior configuration
graph.updateBehavior({
key: 'my-zoom-canvas', // Specify the behavior to update
sensitivity: 2.0, // New zoom sensitivity
enableOptimize: true, // Add new configuration
});
```
**Example 2**: Disable/Enable behavior
```typescript
// Set behaviors with keys
graph.setBehaviors([
{
type: 'drag-canvas',
key: 'main-drag',
},
{
type: 'zoom-canvas',
key: 'main-zoom',
},
]);
// Disable drag functionality
graph.updateBehavior({
key: 'main-drag',
enable: false,
});
// Re-enable later
setTimeout(() => {
graph.updateBehavior({
key: 'main-drag',
enable: true,
});
}, 5000);
```
## Type Definitions
### BehaviorOptions
```typescript
type BehaviorOptions = (string | CustomBehaviorOption | ((this: Graph) => CustomBehaviorOption))[];
type CustomBehaviorOption = {
// Interaction type
type: string;
// Interaction key, a unique identifier for identifying and further operating this interaction
key?: string;
// There may be other configuration items for different types of interactions
[configKey: string]: any;
};
```
### UpdateBehaviorOption
```typescript
type UpdateBehaviorOption = {
// Unique identifier of the behavior to update
key: string;
// Other configuration items to update
[configKey: string]: unknown;
};
```
Api Skill
packages/site/docs/api/behavior.zh.md anthropic-skill ~1,029 tokens---
title: 交互
order: 8
---
## 交互概述
交互(Behavior)是 G6 的核心构建模块,它精确定义了用户与图之间的互动行为。每个 Behavior 插件都是一个高度封装的功能单元,内部集成了特定场景下的事件监听、状态管理和响应处理逻辑。
G6 的内置 Behavior 涵盖了大多数常见交互需求,同时提供了灵活的扩展机制,支持开发者根据业务场景构建定制化交互体验。
有关完整的交互行为类型、配置选项及开发示例,请参阅 [交互总览](/manual/behavior/overview) 章节。
## API 参考
### Graph.getBehaviors()
获取当前图表中所有已配置的交互行为。
```typescript
getBehaviors(): BehaviorOptions;
```
**返回值**
- **类型**: [BehaviorOptions](#behavioroptions)
- **描述**: 当前图表中已配置的所有交互行为
**示例**
```typescript
// 获取当前所有交互行为
const behaviors = graph.getBehaviors();
console.log('当前图表的交互行为:', behaviors);
```
### Graph.setBehaviors(behaviors)
设置图表的交互行为,将替换所有现有的交互行为。
```typescript
setBehaviors(behaviors: BehaviorOptions | ((prev: BehaviorOptions) => BehaviorOptions)): void;
```
**参数**
| 参数 | 描述 | 类型 | 默认值 | 必选 |
| --------- | ---------------------------------------------------- | --------------------------------------------------------------------------------- | ------ | ---- |
| behaviors | 新的交互行为配置,或一个基于当前配置返回新配置的函数 | [BehaviorOptions](#behavioroptions) \| (prev: BehaviorOptions) => BehaviorOptions | - | ✓ |
**说明**
设置的交互会全量替换原有的交互,如果需要新增交互可以使用函数式更新:
```typescript
graph.setBehaviors((behaviors) => [...behaviors, { type: 'zoom-canvas' }]);
```
**示例 1**: 设置基本交互
```typescript
// 设置基本交互
graph.setBehaviors([
'drag-canvas', // 拖拽画布
'zoom-canvas', // 缩放画布
'drag-element', // 拖拽元素
]);
```
**示例 2**: 设置带配置的交互
```typescript
graph.setBehaviors([
// 字符串形式(使用默认配置)
'drag-canvas',
// 对象形式(自定义配置)
{
type: 'zoom-canvas',
key: 'my-zoom', // 指定唯一标识,用于后续更新
sensitivity: 1.5, // 缩放灵敏度
},
// 只有节点上启用拖拽
{
type: 'drag-element',
key: 'drag-node-only',
enable: (event) => event.targetType === 'node', // 仅在节点上启用拖拽
},
]);
```
**示例 3**: 使用函数式更新
```typescript
// 添加新的交互行为
graph.setBehaviors((currentBehaviors) => [
...currentBehaviors,
{
type: 'brush-select',
key: 'selection-brush',
},
]);
// 替换特定交互行为
graph.setBehaviors((currentBehaviors) => {
// 过滤掉现有的缩放交互
const filteredBehaviors = currentBehaviors.filter((behavior) => {
if (typeof behavior === 'string') return behavior !== 'zoom-canvas';
return behavior.type !== 'zoom-canvas';
});
// 添加新的缩放交互配置
return [
...filteredBehaviors,
{
type: 'zoom-canvas',
key: 'new-zoom',
enableOptimize: true,
},
];
});
```
### Graph.updateBehavior(behavior)
更新指定的交互行为配置,需要通过 `key` 标识要更新的交互。
```typescript
updateBehavior(behavior: UpdateBehaviorOption): void;
```
**参数**
| 参数 | 描述 | 类型 | 默认值 | 必选 |
| -------- | ------------------ | --------------------------------------------- | ------ | ---- |
| behavior | 更新的交互行为配置 | [UpdateBehaviorOption](#updatebehavioroption) | - | ✓ |
**说明**
如果要更新一个交互,必须在原始交互配置中指定 `key` 字段,以便能够准确找到并更新该交互。
**示例 1**: 更新交互配置
```typescript
// 初始设置交互时指定 key
graph.setBehaviors([
{
type: 'zoom-canvas',
key: 'my-zoom-canvas',
sensitivity: 1.0,
},
]);
// 更新交互配置
graph.updateBehavior({
key: 'my-zoom-canvas', // 指定要更新的交互
sensitivity: 2.0, // 新的缩放灵敏度
enableOptimize: true, // 添加新配置
});
```
**示例 2**: 禁用/启用交互
```typescript
// 设置带 key 的行为
graph.setBehaviors([
{
type: 'drag-canvas',
key: 'main-drag',
},
{
type: 'zoom-canvas',
key: 'main-zoom',
},
]);
// 禁用拖拽功能
graph.updateBehavior({
key: 'main-drag',
enable: false,
});
// 稍后重新启用
setTimeout(() => {
graph.updateBehavior({
key: 'main-drag',
enable: true,
});
}, 5000);
```
## 类型定义
### BehaviorOptions
```typescript
type BehaviorOptions = (string | CustomBehaviorOption | ((this: Graph) => CustomBehaviorOption))[];
type CustomBehaviorOption = {
// 交互类型
type: string;
// 交互 key,即唯一标识,用于标识交互,从而进一步操作此交互
key?: string;
// 针对不同类型的交互,还可能有其他配置项
[configKey: string]: any;
};
```
### UpdateBehaviorOption
```typescript
type UpdateBehaviorOption = {
// 要更新的交互的唯一标识
key: string;
// 其他要更新的配置项
[configKey: string]: unknown;
};
```
Api Skill
packages/site/docs/api/canvas.en.md anthropic-skill ~516 tokens---
title: Canvas Operations
order: 1
---
## Overview of Canvas Operations
G6 provides a series of canvas operation APIs to control and obtain basic information about the canvas. With these APIs, you can:
- Get the canvas instance
- Get and set the canvas size
- Operate the canvas renderer and layers
## API Reference
### Graph.getCanvas()
Get the canvas instance, which can be used for low-level canvas operations.
```typescript
getCanvas(): Canvas;
```
**Return Value Description**
The Canvas instance includes the following main functions:
- `getLayer(name?: string)`: Get the specified layer
- `getLayers()`: Get all layers
- `getCamera()`: Get the camera instance
- `getRoot()`: Get the root node
- `setCursor(cursor: string)`: Set the mouse cursor style
**Example**
```typescript
// Get the canvas instance
const canvas = graph.getCanvas();
// Get the main layer
const mainLayer = canvas.getLayer('main');
// Set the mouse cursor style
canvas.setCursor('pointer');
// Get the root node of the canvas
const root = canvas.getRoot();
```
### Graph.getSize()
Get the size of the current canvas container. Returns an array containing the width and height.
```typescript
getSize(): [number, number];
```
**Example**
```typescript
// Get the canvas size
const [width, height] = graph.getSize();
console.log('Canvas width:', width);
console.log('Canvas height:', height);
// Use the size information for calculations
const centerX = width / 2;
const centerY = height / 2;
```
### Graph.setSize(width, height)
Set the size of the canvas container. This method will update both the canvas and container size.
```typescript
setSize(width: number, height: number): void;
```
**Parameters**
| Parameter | Description | Type | Default | Required |
| --------- | ---------------------- | ------ | ------- | -------- |
| width | Canvas width (pixels) | number | - | ✓ |
| height | Canvas height (pixels) | number | - | ✓ |
**Example**
```typescript
// Set a fixed size
graph.setSize(800, 600);
```
Api Skill
packages/site/docs/api/canvas.zh.md anthropic-skill ~327 tokens---
title: 画布操作
order: 1
---
## 画布操作概述
G6 提供了一系列画布操作 API,用于控制和获取画布的基本信息。通过这些 API,你可以:
- 获取画布实例
- 获取和设置画布尺寸
- 操作画布渲染器和图层
## API 参考
### Graph.getCanvas()
获取画布实例,返回的实例可用于进行底层的画布操作。
```typescript
getCanvas(): Canvas;
```
**返回值类型说明**
Canvas 实例包含以下主要功能:
- `getLayer(name?: string)`: 获取指定图层
- `getLayers()`: 获取所有图层
- `getCamera()`: 获取相机实例
- `getRoot()`: 获取根节点
- `setCursor(cursor: string)`: 设置鼠标样式
**示例**
```typescript
// 获取画布实例
const canvas = graph.getCanvas();
// 获取主图层
const mainLayer = canvas.getLayer('main');
// 设置鼠标样式
canvas.setCursor('pointer');
// 获取画布根节点
const root = canvas.getRoot();
```
### Graph.getSize()
获取当前画布容器的尺寸。返回一个包含宽度和高度的数组。
```typescript
getSize(): [number, number];
```
**示例**
```typescript
// 获取画布尺寸
const [width, height] = graph.getSize();
console.log('画布宽度:', width);
console.log('画布高度:', height);
// 使用尺寸信息进行计算
const centerX = width / 2;
const centerY = height / 2;
```
### Graph.setSize(width, height)
设置画布容器的尺寸。这个方法会同时更新画布和容器的大小。
```typescript
setSize(width: number, height: number): void;
```
**参数**
| 参数 | 描述 | 类型 | 默认值 | 必选 |
| ------ | ---------------- | ------ | ------ | ---- |
| width | 画布宽度(像素) | number | - | ✓ |
| height | 画布高度(像素) | number | - | ✓ |
**示例**
```typescript
// 设置固定尺寸
graph.setSize(800, 600);
```
Api Skill
packages/site/docs/api/coordinate.en.md anthropic-skill ~1,040 tokens---
title: Coordinate Transformation
order: 12
---
## Overview of Coordinate Systems
Understanding different coordinate systems and their transformations is crucial in graph visualization. G6 involves multiple coordinate systems, each used for different scenarios:
- **Client Coordinate System**: Origin is at the top-left corner of the browser viewport, measured in pixels. Typically used for handling browser events.
- **Screen Coordinate System**: Origin is at the top-left corner of the screen, affected by page scrolling.
- **Page Coordinate System**: Origin is at the top-left corner of the document, considering document scrolling.
- **Canvas Coordinate System**: Also known as the world coordinate system, used for drawing and layout, with the origin at the top-left corner of the canvas element.
- **Viewport Coordinate System**: The visible area of the canvas, with the origin at the top-left corner of the viewport. The viewport can be panned and zoomed to view different areas of the Canvas.
In this [example](https://g.antv.antgroup.com/en/examples/canvas/canvas-basic#coordinates), moving the mouse shows the position in various coordinate systems:

When the canvas is not panned or zoomed, the Viewport and Canvas coordinate systems coincide. With user interactions like dragging or zooming, the two systems may shift.
G6 provides a series of APIs for converting between different coordinate systems, detailed below.
## API Reference
### Graph.getCanvasByClient(point)
Convert browser coordinates (client coordinates) to canvas coordinates.
```typescript
getCanvasByClient(point: Point): Point;
```
**Parameters**
| Parameter | Description | Type | Default | Required |
| --------- | ------------------------ | -------------------------------------------- | ------- | -------- |
| point | Browser coordinate point | [number, number] \| [number, number, number] | - | ✓ |
**Return Value**
- **Type**: [number, number] \| [number, number, number]
- **Description**: Coordinate point in the canvas coordinate system
### Graph.getCanvasByViewport(point)
Convert viewport coordinates to canvas coordinates.
```typescript
getCanvasByViewport(point: Point): Point;
```
**Parameters**
| Parameter | Description | Type | Default | Required |
| --------- | ------------------------- | -------------------------------------------- | ------- | -------- |
| point | Viewport coordinate point | [number, number] \| [number, number, number] | - | ✓ |
**Return Value**
- **Type**: [number, number] \| [number, number, number]
- **Description**: Coordinate point in the canvas coordinate system
### Graph.getClientByCanvas(point)
Convert canvas coordinates to browser client coordinates.
```typescript
getClientByCanvas(point: Point): Point;
```
**Parameters**
| Parameter | Description | Type | Default | Required |
| --------- | ----------------------- | -------------------------------------------- | ------- | -------- |
| point | Canvas coordinate point | [number, number] \| [number, number, number] | - | ✓ |
**Return Value**
- **Type**: [number, number] \| [number, number, number]
- **Description**: Coordinate point in the browser client coordinate system
### Graph.getViewportByCanvas(point)
Convert canvas coordinates to viewport coordinates.
```typescript
getViewportByCanvas(point: Point): Point;
```
**Parameters**
| Parameter | Description | Type | Default | Required |
| --------- | ----------------------- | -------------------------------------------- | ------- | -------- |
| point | Canvas coordinate point | [number, number] \| [number, number, number] | - | ✓ |
**Return Value**
- **Type**: [number, number] \| [number, number, number]
- **Description**: Coordinate point in the viewport coordinate system
Api Skill
packages/site/docs/api/coordinate.zh.md anthropic-skill ~623 tokens---
title: 坐标转换
order: 12
---
## 坐标系概述
在图可视化中,理解不同的坐标系及其转换关系至关重要。G6 中涉及多种坐标系,它们各自用于不同的场景:
- **Client 坐标系**:浏览器视口左上角为原点,单位为像素。通常用于处理浏览器事件。
- **Screen 坐标系**:屏幕左上角为原点,会受页面滚动影响。
- **Page 坐标系**:文档左上角为原点,考虑文档滚动。
- **Canvas 坐标系**:也称为世界坐标系,图形绘制和布局时使用的坐标系,画布元素左上角为原点。
- **Viewport 坐标系**:视口坐标系,当前可见的画布区域,视口左上角为原点。视口通过平移、缩放等操作,可以观察不同的 Canvas 区域。
在这个[示例](https://g.antv.antgroup.com/zh/examples/canvas/canvas-basic#coordinates)中,移动鼠标可以看到鼠标所在位置在各个坐标系下的值:

当画布没有发生平移和缩放时,Viewport 坐标系与 Canvas 坐标系重合。随着用户的交互(如拖拽画布、缩放),两个坐标系会出现偏移。
G6 提供了一系列 API 用于在不同坐标系之间进行转换,下面将详细介绍这些 API。
## API 参考
### Graph.getCanvasByClient(point)
将浏览器坐标(客户端坐标)转换为画布坐标。
```typescript
getCanvasByClient(point: Point): Point;
```
**参数**
| 参数 | 描述 | 类型 | 默认值 | 必选 |
| ----- | ------------ | -------------------------------------------- | ------ | ---- |
| point | 浏览器坐标点 | [number, number] \| [number, number, number] | - | ✓ |
**返回值**
- **类型**: [number, number] \| [number, number, number]
- **描述**: 画布坐标系下的坐标点
### Graph.getCanvasByViewport(point)
将视口坐标转换为画布坐标。
```typescript
getCanvasByViewport(point: Point): Point;
```
**参数**
| 参数 | 描述 | 类型 | 默认值 | 必选 |
| ----- | ---------- | -------------------------------------------- | ------ | ---- |
| point | 视口坐标点 | [number, number] \| [number, number, number] | - | ✓ |
**返回值**
- **类型**: [number, number] \| [number, number, number]
- **描述**: 画布坐标系下的坐标点
### Graph.getClientByCanvas(point)
将画布坐标转换为浏览器客户端坐标。
```typescript
getClientByCanvas(point: Point): Point;
```
**参数**
| 参数 | 描述 | 类型 | 默认值 | 必选 |
| ----- | ---------- | -------------------------------------------- | ------ | ---- |
| point | 画布坐标点 | [number, number] \| [number, number, number] | - | ✓ |
**返回值**
- **类型**: [number, number] \| [number, number, number]
- **描述**: 浏览器客户端坐标系下的坐标点
### Graph.getViewportByCanvas(point)
将画布坐标转换为视口坐标。
```typescript
getViewportByCanvas(point: Point): Point;
```
**参数**
| 参数 | 描述 | 类型 | 默认值 | 必选 |
| ----- | ---------- | -------------------------------------------- | ------ | ---- |
| point | 画布坐标点 | [number, number] \| [number, number, number] | - | ✓ |
**返回值**
- **类型**: [number, number] \| [number, number, number]
- **描述**: 视口坐标系下的坐标点
Api Skill
packages/site/docs/api/data.en.md anthropic-skill ~6,570 tokens---
title: Data
order: 0
---
## Overview of Data Operations
G6 provides a comprehensive [data](/en/manual/data) operation API, covering the complete lifecycle of graph data from query, modification to update.
## API Reference
### Graph.getData()
Get the complete data of the graph.
```typescript
getData(): Required<GraphData>;
```
**Return Value**:
- **Type**: [GraphData](#graphdata)
- **Description**: Returns the complete graph data containing all nodes, edges, and combo data
**Example**:
```typescript
const graphData = graph.getData();
console.log('Node data:', graphData.nodes);
console.log('Edge data:', graphData.edges);
console.log('Combo data:', graphData.combos);
```
### Graph.getNodeData()
Get node data, supporting three calling methods.
```typescript
// Get all node data
getNodeData(): NodeData[];
// Get single node data
getNodeData(id: ID): NodeData;
// Get multiple node data
getNodeData(ids: ID[]): NodeData[];
```
**Parameters**:
| Parameter | Description | Type | Default | Required |
| --------- | ------------- | -------- | ------- | -------- |
| id | Node ID | string | - | |
| ids | Node ID array | string[] | - | |
**Return Value**:
- **Type**: [NodeData](#nodedata) | [NodeData](#nodedata)[]
- **Description**: Returns the specified node data or node data array
**Example**:
```typescript
// Get all nodes
const nodes = graph.getNodeData();
// Get single node
const node = graph.getNodeData('node1');
console.log('Node position:', node.style.x, node.style.y);
// Get multiple nodes
const [node1, node2] = graph.getNodeData(['node1', 'node2']);
```
### Graph.getEdgeData()
Get edge data, supporting three calling methods.
```typescript
// Get all edge data
getEdgeData(): EdgeData[];
// Get single edge data
getEdgeData(id: ID): EdgeData;
// Get multiple edge data
getEdgeData(ids: ID[]): EdgeData[];
```
**Parameters**:
| Parameter | Description | Type | Default | Required |
| --------- | ------------- | -------- | ------- | -------- |
| id | Edge ID | string | - | |
| ids | Edge ID array | string[] | - | |
**Return Value**:
- **Type**: [EdgeData](#edgedata) | [EdgeData](#edgedata)[]
- **Description**: Returns the specified edge data or edge data array
**Example**:
```typescript
// Get all edges
const edges = graph.getEdgeData();
// Get single edge
const edge = graph.getEdgeData('edge1');
console.log('Edge source and target:', edge.source, edge.target);
// Get multiple edges
const [edge1, edge2] = graph.getEdgeData(['edge1', 'edge2']);
```
### Graph.getComboData()
Get combo data, supporting three calling methods.
```typescript
// Get all combo data
getComboData(): ComboData[];
// Get single combo data
getComboData(id: ID): ComboData;
// Get multiple combo data
getComboData(ids: ID[]): ComboData[];
```
**Parameters**:
| Parameter | Description | Type | Default | Required |
| --------- | -------------- | -------- | ------- | -------- |
| id | Combo ID | string | - | |
| ids | Combo ID array | string[] | - | |
**Return Value**:
- **Type**: [ComboData](#combodata) | [ComboData](#combodata)[]
- **Description**: Returns the specified combo data or combo data array
**Example**:
```typescript
// Get all combos
const combos = graph.getComboData();
// Get single combo
const combo = graph.getComboData('combo1');
console.log('Nodes in combo:', combo.children);
// Get multiple combos
const [combo1, combo2] = graph.getComboData(['combo1', 'combo2']);
```
### Graph.getElementData()
Get single element data, supporting two calling methods.
⚠️ **Note**: This API directly gets the data of the element without considering the element type.
```typescript
// Get single element data
getElementData(id: ID): ElementDatum;
// Get multiple element data
getElementData(ids: ID[]): ElementDatum[];
```
**Parameters**:
| Parameter | Description | Type | Default | Required |
| --------- | ---------------- | -------- | ------- | -------- |
| id | Element ID | string | - | |
| ids | Element ID array | string[] | - | |
**Return Value**:
- **Type**: ElementDatum \| ElementDatum[]
- **Description**: Directly gets the data of the element without considering the element type
**Example**:
```typescript
const element = graph.getElementData('node-1');
console.log('Element data:', element);
const elements = graph.getElementData(['node-1', 'edge-1']);
console.log('Multiple element data:', elements);
```
### Graph.getElementDataByState()
Get element data in a specified state, supporting three calling methods.
```typescript
// Get node data in a specified state
getElementDataByState(elementType: 'node', state: string): NodeData[];
// Get edge data in a specified state
getElementDataByState(elementType: 'edge', state: string): EdgeData[];
// Get combo data in a specified state
getElementDataByState(elementType: 'combo', state: string): ComboData[];
```
**Parameters**:
| Parameter | Description | Type | Default | Required |
| ----------- | ------------ | --------------------------------- | ------- | -------- |
| elementType | Element type | `'node'` \| `'edge'` \| `'combo'` | - | ✓ |
| state | State | string | - | ✓ |
**Return Value**:
- **Type**: NodeData[] \| EdgeData[] \| ComboData[]
- **Description**: Returns node data, edge data, or combo data in the specified state
**Example**:
```typescript
const selectedNodes = graph.getElementDataByState('node', 'selected');
console.log('Selected nodes:', selectedNodes);
const selectedEdges = graph.getElementDataByState('edge', 'selected');
console.log('Selected edges:', selectedEdges);
const selectedCombos = graph.getElementDataByState('combo', 'selected');
console.log('Selected combos:', selectedCombos);
```
**Built-in States**:
- `'selected'`
- `'highlight'`
- `'active'`
- `'inactive'`
- `'disabled'`
### Graph.getNeighborNodesData()
Get the data of neighbor nodes of a node or combo.
```typescript
getNeighborNodesData(id: ID): NodeData[];
```
**Parameters**:
| Parameter | Description | Type | Default | Required |
| --------- | ---------------- | ------ | ------- | -------- |
| id | Node or combo ID | string | - | ✓ |
**Return Value**:
- **Type**: NodeData[]
- **Description**: Returns neighbor node data
**Example**:
```typescript
const neighbors = graph.getNeighborNodesData('node-1');
console.log('Neighbor nodes:', neighbors);
```
### Graph.getRelatedEdgesData()
Get the data of edges related to a node or combo.
```typescript
getRelatedEdgesData(id: ID, direction?: EdgeDirection): EdgeData[];
```
**Parameters**:
| Parameter | Description | Type | Default | Required |
| --------- | ---------------- | ----------------------------- | ------- | -------- |
| id | Node or combo ID | string | - | ✓ |
| direction | Edge direction | `'in'` \| `'out'` \| `'both'` | - | |
**Return Value**:
- **Type**: EdgeData[]
- **Description**: Returns the data of edges related to the specified node or combo
**Example**:
```typescript
const relatedEdges = graph.getRelatedEdgesData('node-1');
console.log('Related edges:', relatedEdges);
```
### Graph.getParentData()
Get the data of the parent element of a node or combo.
```typescript
getParentData(id: ID, hierarchy: HierarchyKey): NodeLikeData | undefined;
```
**Parameters**:
| Parameter | Description | Type | Default | Required |
| --------- | ---------------------- | --------------------- | ------- | -------- |
| id | Node or combo ID | string | - | ✓ |
| hierarchy | Specify hierarchy type | `'tree'` \| `'combo'` | - | |
**Return Value**:
- **Type**: NodeData \| ComboData \| undefined
- **Description**: Returns the parent element data, or undefined if it does not exist
**Example**:
```typescript
// Get the parent node in a tree graph
const treeParent = graph.getParentData('node1', 'tree');
// Get the parent combo in a combo
const comboParent = graph.getParentData('node1', 'combo');
```
### Graph.getChildrenData()
Get the data of child elements of a node or combo.
```typescript
getChildrenData(id: ID): (NodeData \| ComboData)[];
```
**Parameters**:
| Parameter | Description | Type | Default | Required |
| --------- | ---------------- | ------ | ------- | -------- |
| id | Node or combo ID | string | - | ✓ |
**Return Value**:
- **Type**: (NodeData \| ComboData)[]
- **Description**: Returns an array of child element data
**Note**:
- **Querying combo's child elements**: If the id corresponds to a combo element, you can directly use this API to get all its child elements.
- **Querying node's child elements**: If the id corresponds to a node, only when the graph data is a tree structure (i.e., the node data maintains a `children` field, and `children` is an array of child node IDs for that node), can you use this API to get the child elements of that node. Otherwise, an empty array is returned.
**Example**:
```typescript
// Get the child elements of a combo
const children = graph.getChildrenData('combo1');
console.log('Number of child nodes:', children.length);
// Process each child element
children.forEach((child) => {
console.log('Child element ID:', child.id);
});
```
### Graph.getAncestorsData()
Get the data of all ancestor elements of a node or combo.
```typescript
getAncestorsData(id: ID, hierarchy: HierarchyKey): NodeLikeData[];
```
**Parameters**:
| Parameter | Description | Type | Default | Required |
| --------- | ---------------------- | --------------------- | ------- | -------- |
| id | Node or combo ID | string | - | ✓ |
| hierarchy | Specify hierarchy type | `'tree'` \| `'combo'` | - | ✓ |
**Return Value**:
- **Type**: [NodeData](#nodedata)[] \| [ComboData](#combodata)[]
- **Description**: Returns an array of ancestor element data, ordered from parent to root
**Example**:
```typescript
// Get all ancestor nodes in a tree graph
const treeAncestors = graph.getAncestorsData('node1', 'tree');
console.log(
'Ancestor node path:',
treeAncestors.map((node) => node.id),
);
// Get all parent combos in a combo
const comboAncestors = graph.getAncestorsData('node1', 'combo');
```
### Graph.getDescendantsData()
Get the data of all descendant elements of a node or combo.
```typescript
getDescendantsData(id: ID): NodeLikeData[];
```
**Parameters**:
| Parameter | Description | Type | Default | Required |
| --------- | ---------------- | ------ | ------- | -------- |
| id | Node or combo ID | string | - | ✓ |
**Return Value**:
- **Type**: [NodeData](#nodedata)[] \| [ComboData](#combodata)[]
- **Description**: Returns an array of descendant element data
**Example**:
```typescript
// Get all descendants of a node
const descendants = graph.getDescendantsData('node1');
console.log('Number of descendants:', descendants.length);
// Process all descendant elements
descendants.forEach((descendant) => {
console.log('Descendant element ID:', descendant.id);
});
```
### Graph.setData()
Set the complete data of the graph.
```typescript
setData(data: GraphData | ((prev: GraphData) => GraphData)): void;
```
**Parameters**:
| Parameter | Description | Type | Default | Required |
| --------- | ----------------------------------------------------- | ----------------------------------------------------------- | ------- | -------- |
| data | New graph data or a function returning new graph data | [GraphData](#graphdata) \| ((prev: GraphData) => GraphData) | - | ✓ |
**Example**:
```typescript
// Directly set data
graph.setData({
nodes: [
{ id: 'node1', style: { x: 100, y: 100 } },
{ id: 'node2', style: { x: 200, y: 200 } },
],
edges: [{ id: 'edge1', source: 'node1', target: 'node2' }],
});
// Use functional incremental update: get current graph data and return new graph data
graph.setData((prev) => ({
...prev,
nodes: [...prev.nodes, { id: 'node3', style: { x: 300, y: 300 } }],
}));
```
### Graph.addData()
Add new element data.
```typescript
addData(data: GraphData | ((prev: GraphData) => GraphData)): void;
```
**Parameters**:
| Parameter | Description | Type | Default | Required |
| --------- | -------------------------------------------------------- | ----------------------------------------------------------- | ------- | -------- |
| data | Graph data to add or a function returning new graph data | [GraphData](#graphdata) \| ((prev: GraphData) => GraphData) | - | ✓ |
**Example**:
```typescript
graph.addData({
nodes: [{ id: 'node-1' }, { id: 'node-2' }],
edges: [{ source: 'node-1', target: 'node-2' }],
});
```
### Graph.addNodeData()
Add new node data.
```typescript
addNodeData(data: NodeData[] | ((prev: NodeData[]) => NodeData[])): void;
```
**Parameters**:
| Parameter | Description | Type | Default | Required |
| --------- | -------------------------------------------------- | ----------------------------------------------------------- | ------- | -------- |
| data | Node data to add or a function returning node data | [NodeData](#nodedata)[] \| (prev: NodeData[]) => NodeData[] | - | ✓ |
**Example**:
```typescript
// Add single node
graph.addNodeData([
{
id: 'node1',
style: { x: 100, y: 100 },
data: { label: 'Node 1' },
},
]);
// Add multiple nodes
graph.addNodeData([
{ id: 'node2', style: { x: 200, y: 200 } },
{ id: 'node3', style: { x: 300, y: 300 } },
]);
// Functional addition
graph.addNodeData((prev) => [...prev, { id: 'node4', style: { x: 400, y: 400 } }]);
```
### Graph.addEdgeData()
Add new edge data.
```typescript
addEdgeData(data: EdgeData[] | ((prev: EdgeData[]) => EdgeData[])): void;
```
**Parameters**:
| Parameter | Description | Type | Default | Required |
| --------- | -------------------------------------------------- | ------------------------------------------------------------- | ------- | -------- |
| data | Edge data to add or a function returning edge data | [EdgeData](#edgedata)[] \| ((prev: EdgeData[]) => EdgeData[]) | - | ✓ |
**Example**:
```typescript
// Add single edge
graph.addEdgeData([
{
id: 'edge1',
source: 'node1',
target: 'node2',
data: {
weight: 1,
label: 'Relation',
},
},
]);
// Add multiple edges
graph.addEdgeData([
{ id: 'edge2', source: 'node2', target: 'node3' },
{ id: 'edge3', source: 'node3', target: 'node1' },
]);
// Functional addition
graph.addEdgeData((prev) => [...prev, { id: 'edge4', source: 'node1', target: 'node4' }]);
```
### Graph.addComboData()
Add new combo data.
```typescript
addComboData(data: ComboData[] | ((prev: ComboData[]) => ComboData[])): void;
```
**Parameters**:
| Parameter | Description | Type | Default | Required |
| --------- | ---------------------------------------------------- | --------------------------------------------------------------- | ------- | -------- |
| data | Combo data to add or a function returning combo data | [ComboData](#combodata)[] \| (prev: ComboData[]) => ComboData[] | - | ✓ |
**Example**:
```typescript
graph.addComboData([{ id: 'combo1', children: ['node1', 'node2'] }]);
```
### Graph.addChildrenData()
Add child node data to a tree graph node.
⚠️ **Note**: Use addNodeData / addComboData methods to add child nodes to a combo.
```typescript
addChildrenData(parentId: ID, childrenData: NodeData[]): void;
```
**Parameters**:
| Parameter | Description | Type | Default | Required |
| ------------ | --------------- | ----------------------- | ------- | -------- |
| parentId | Parent node ID | string | - | ✓ |
| childrenData | Child node data | [NodeData](#nodedata)[] | - | ✓ |
**Example**:
```typescript
graph.addChildrenData('node1', [{ id: 'node2' }]);
```
### Graph.removeData()
Remove element data.
```typescript
removeData(ids: DataID | ((data: GraphData) => DataID)): void;
```
**Parameters**:
| Parameter | Description | Type | Default | Required |
| --------- | --------------------------------------------------------- | -------------------------------------------------- | ------- | -------- |
| ids | Element IDs to remove or a function returning element IDs | [DataID](#dataid) \| ((data: GraphData) => DataID) | - | ✓ |
**Return Value**:
- **Type**: void
**Example**:
```typescript
graph.removeData({
nodes: ['node-1', 'node-2'],
edges: ['edge-1'],
});
```
### Graph.removeNodeData()
Remove node data.
```typescript
removeNodeData(ids: ID[] | ((data: NodeData[]) => ID[])): void;
```
**Parameters**:
| Parameter | Description | Type | Default | Required |
| --------- | --------------------------------------------------- | --------------------------------------------------------------- | ------- | -------- |
| ids | Node IDs to remove or a function returning node IDs | [ID](#id)[] \| ((data: [NodeData](#nodedata)[]) => [ID](#id)[]) | - | ✓ |
**Return Value**:
- **Type**: void
**Example**:
```typescript
graph.removeNodeData(['node-1', 'node-2']);
```
### Graph.removeEdgeData()
Remove edge data.
```typescript
removeEdgeData(ids: ID[] | ((data: EdgeData[]) => ID[])): void;
```
**Parameters**:
| Parameter | Description | Type | Default | Required |
| --------- | --------------------------------------------------- | --------------------------------------------------------------- | ------- | -------- |
| ids | Edge IDs to remove or a function returning edge IDs | [ID](#id)[] \| ((data: [EdgeData](#edgedata)[]) => [ID](#id)[]) | - | ✓ |
**Return Value**:
- **Type**: void
**Example**:
```typescript
graph.removeEdgeData(['edge-1']);
```
### Graph.removeComboData()
Remove combo data.
```typescript
removeComboData(ids: ID[] | ((data: ComboData[]) => ID[])): void;
```
**Parameters**:
| Parameter | Description | Type | Default | Required |
| --------- | ----------------------------------------------------- | --------------------------------------------------------------- | ------- | -------- |
| ids | Combo IDs to remove or a function returning combo IDs | [ID](#id)[] \| (data: [ComboData](#combodata)[]) => [ID](#id)[] | - | ✓ |
**Return Value**:
- **Type**: void
**Example**:
```typescript
graph.removeComboData(['combo-1']);
```
### Graph.updateData()
Update element data.
⚠️ **Note**: Only the data that needs to be updated needs to be passed in, not the complete data.
```typescript
updateData(data: PartialGraphData | ((prev: GraphData) => PartialGraphData)): void;
```
**Parameters**:
| Parameter | Description | Type | Default | Required |
| --------- | ----------------------------------------------------------- | -------------------------------------------------------------------------------- | ------- | -------- |
| data | Element data to update or a function returning element data | [PartialGraphData](#partialgraphdata) \| ((prev: GraphData) => PartialGraphData) | - | ✓ |
**Return Value**:
- **Type**: void
**Example**:
```typescript
graph.updateData({
nodes: [{ id: 'node-1', style: { x: 100, y: 100 } }],
edges: [{ id: 'edge-1', style: { lineWidth: 2 } }],
});
```
### Graph.updateNodeData()
Update node data.
⚠️ **Note**: Only the data that needs to be updated needs to be passed in, not the complete data.
```typescript
updateNodeData(data: NodeData[] | ((prev: NodeData[]) => NodeData[])): void;
```
**Parameters**:
| Parameter | Description | Type | Default | Required |
| --------- | ----------------------------------------------------- | ---------------------------------------------- | ------- | -------- |
| data | Node data to update or a function returning node data | NodeData[] \| (prev: NodeData[]) => NodeData[] | - | ✓ |
**Return Value**:
- **Type**: void
**Example**:
```typescript
graph.updateNodeData([{ id: 'node-1', style: { x: 100, y: 100 } }]);
```
### Graph.updateEdgeData()
Update edge data.
⚠️ **Note**: Only the data that needs to be updated needs to be passed in, not the complete data.
```typescript
updateEdgeData(data: (PartialEdgeData<EdgeData>[] | ((prev: EdgeData[]) => PartialEdgeData<EdgeData>[]))): void;
```
**Parameters**:
| Parameter | Description | Type | Default | Required |
| --------- | ----------------------------------------------------- | ---------------------------------------------------------------------------------------------------------------------------- | ------- | -------- |
| data | Edge data to update or a function returning edge data | [PartialEdgeData\<EdgeData\>](#partialedgedata)[] \| (prev: EdgeData[]) => [PartialEdgeData\<EdgeData\>](#partialedgedata)[] | - | ✓ |
**Return Value**:
- **Type**: void
**Example**:
```typescript
graph.updateEdgeData([{ id: 'edge-1', style: { lineWidth: 2 } }]);
```
### Graph.updateComboData()
Update combo data.
⚠️ **Note**: Only the data that needs to be updated needs to be passed in, not the complete data.
```typescript
updateComboData(data: (ComboData[] | ((prev: ComboData[]) => ComboData[]))): void;
```
**Parameters**:
| Parameter | Description | Type | Default | Required |
| --------- | ------------------------------------------------------- | --------------------------------------------------------------- | ------- | -------- |
| data | Combo data to update or a function returning combo data | [ComboData](#combodata)[] \| (prev: ComboData[]) => ComboData[] | - | ✓ |
**Return Value**:
- **Type**: void
**Example**:
```typescript
graph.updateComboData([{ id: 'combo-1', style: { x: 100, y: 100 } }]);
```
### Graph.hasNode()
Determine if an node exists
```typescript
hasNode(id:ID): boolean;
```
**参数**:
| Parameter | Description | Type | Default | Required |
| ---- | -------------------- | --------- | ------ | ---- |
| id | Node ID to be judged | [ID](#id) | - | ✓ |
**返回值**:
- **类型**: boolean
**示例**:
```typescript
graph.hasNode('node-1');
```
### Graph.hasEdge()
Determine if an edge exists
```typescript
hasEdge(id:ID): boolean;
```
**参数**:
| Parameter | Description | Type | Default | Required |
| --------- | -------------------- | --------- | ------- | -------- |
| id | Edge ID to be judged | [ID](#id) | - | ✓ |
**返回值**:
- **类型**: boolean
**示例**:
```typescript
graph.hasEdge('edge-1');
```
### Graph.hasCombo()
Determine if combo exists
```typescript
hasCombo(id:ID): boolean;
```
**参数**:
| Parameter | Description | Type | Default | Required |
| --------- | --------------------- | --------- | ------- | -------- |
| id | Combo ID to be judged | [ID](#id) | - | ✓ |
**返回值**:
- **类型**: boolean
**示例**:
```typescript
graph.hasCombo('combo-1');
```
## Type Definitions
### ID
Element ID type.
```typescript
type ID = string;
```
### DataID
Multiple element ID type.
```typescript
interface DataID {
nodes?: ID[];
edges?: ID[];
combos?: ID[];
}
```
### GraphData
G6 graph data type.
```typescript
interface GraphData {
nodes?: NodeData[];
edges?: EdgeData[];
combos?: ComboData[];
}
```
### NodeData
Node data type.
```typescript
interface NodeData {
id: string; // Node ID
type?: string; // Node type
data?: Record<string, any>; // Node data
style?: Record<string, any>; // Node style
states?: string[]; // Initial node states
combo?: string; // Belonging combo
children?: string[]; // Array of child node IDs
}
```
For detailed type definitions, please refer to [Node Data](/en/manual/data#nodedata).
### EdgeData
Edge data type.
```typescript
interface EdgeData {
source: string; // Source ID
target: string; // Target ID
id?: string; // Edge ID
type?: string; // Edge type
data?: Record<string, any>; // Edge data
style?: Record<string, any>; // Edge style
states?: string[]; // Initial edge states
}
```
For detailed type definitions, please refer to [Edge Data](/en/manual/data#edgedata).
### ComboData
Combo data type.
```typescript
interface ComboData {
id: string; // Combo ID
type?: string; // Combo type
data?: Record<string, any>; // Combo data
style?: Record<string, any>; // Combo style
states?: string[]; // Initial combo states
combo?: string; // Parent combo ID
}
```
For detailed type definitions, please refer to [Combo Data](/en/manual/data#combodata).
Api Skill
packages/site/docs/api/data.zh.md anthropic-skill ~5,071 tokens---
title: 数据
order: 0
---
## 数据操作概述
G6 提供了一套全面的 [数据](/manual/data) 操作 API,覆盖了图数据从查询、修改到更新的完整生命周期。
## API 参考
### Graph.getData()
获取图的完整数据。
```typescript
getData(): Required<GraphData>;
```
**返回值**:
- **类型**: [GraphData](#graphdata)
- **描述**: 返回包含所有节点、边和组合数据的完整图数据
**示例**:
```typescript
const graphData = graph.getData();
console.log('节点数据:', graphData.nodes);
console.log('边数据:', graphData.edges);
console.log('组合数据:', graphData.combos);
```
### Graph.getNodeData()
获取节点数据,支持三种调用方式。
```typescript
// 获取所有节点数据
getNodeData(): NodeData[];
// 获取单个节点数据
getNodeData(id: ID): NodeData;
// 批量获取多个节点数据
getNodeData(ids: ID[]): NodeData[];
```
**参数**:
| 参数 | 描述 | 类型 | 默认值 | 必选 |
| ---- | ------------ | -------- | ------ | ---- |
| id | 节点 ID | string | - | |
| ids | 节点 ID 数组 | string[] | - | |
**返回值**:
- **类型**: [NodeData](#nodedata) | [NodeData](#nodedata)[]
- **描述**: 返回指定的节点数据或节点数据数组
**示例**:
```typescript
// 获取所有节点
const nodes = graph.getNodeData();
// 获取单个节点
const node = graph.getNodeData('node1');
console.log('节点位置:', node.style.x, node.style.y);
// 获取多个节点
const [node1, node2] = graph.getNodeData(['node1', 'node2']);
```
### Graph.getEdgeData()
获取边数据,支持三种调用方式。
```typescript
// 获取所有边数据
getEdgeData(): EdgeData[];
// 获取单条边数据
getEdgeData(id: ID): EdgeData;
// 批量获取多条边数据
getEdgeData(ids: ID[]): EdgeData[];
```
**参数**:
| 参数 | 描述 | 类型 | 默认值 | 必选 |
| ---- | ---------- | -------- | ------ | ---- |
| id | 边 ID | string | - | |
| ids | 边 ID 数组 | string[] | - | |
**返回值**:
- **类型**: [EdgeData](#edgedata) | [EdgeData](#edgedata)[]
- **描述**: 返回指定的边数据或边数据数组
**示例**:
```typescript
// 获取所有边
const edges = graph.getEdgeData();
// 获取单条边
const edge = graph.getEdgeData('edge1');
console.log('边的起点和终点:', edge.source, edge.target);
// 获取多条边
const [edge1, edge2] = graph.getEdgeData(['edge1', 'edge2']);
```
### Graph.getComboData()
获取组合数据,支持三种调用方式。
```typescript
// 获取所有组合数据
getComboData(): ComboData[];
// 获取单个组合数据
getComboData(id: ID): ComboData;
// 批量获取多个组合数据
getComboData(ids: ID[]): ComboData[];
```
**参数**:
| 参数 | 描述 | 类型 | 默认值 | 必选 |
| ---- | ------------ | -------- | ------ | ---- |
| id | 组合 ID | string | - | |
| ids | 组合 ID 数组 | string[] | - | |
**返回值**:
- **类型**: [ComboData](#combodata) | [ComboData](#combodata)[]
- **描述**: 返回指定的组合数据或组合数据数组
**示例**:
```typescript
// 获取所有组合
const combos = graph.getComboData();
// 获取单个组合
const combo = graph.getComboData('combo1');
console.log('组合包含的节点:', combo.children);
// 获取多个组合
const [combo1, combo2] = graph.getComboData(['combo1', 'combo2']);
```
### Graph.getElementData()
获取单个元素数据,支持两种调用方式。
⚠️ **注意**: 此 API 直接获取元素的数据而不必考虑元素类型。
```typescript
// 获取单个元素数据
getElementData(id: ID): ElementDatum;
// 批量获取多个元素数据
getElementData(ids: ID[]): ElementDatum[];
```
**参数**:
| 参数 | 描述 | 类型 | 默认值 | 必选 |
| ---- | ------------ | -------- | ------ | ---- |
| id | 元素 ID | string | - | |
| ids | 元素 ID 数组 | string[] | - | |
**返回值**:
- **类型**: ElementDatum \| ElementDatum[]
- **描述**: 直接获取元素的数据而不必考虑元素类型
**示例**:
```typescript
const element = graph.getElementData('node-1');
console.log('元素数据:', element);
const elements = graph.getElementData(['node-1', 'edge-1']);
console.log('多个元素数据:', elements);
```
### Graph.getElementDataByState()
获取指定状态下的元素数据,支持三种调用方式。
```typescript
// 获取指定状态下的节点数据
getElementDataByState(elementType: 'node', state: string): NodeData[];
// 获取指定状态下的边数据
getElementDataByState(elementType: 'edge', state: string): EdgeData[];
// 获取指定状态下的组合数据
getElementDataByState(elementType: 'combo', state: string): ComboData[];
```
**参数**:
| 参数 | 描述 | 类型 | 默认值 | 必选 |
| ----------- | -------- | --------------------------------- | ------ | ---- |
| elementType | 元素类型 | `'node'` \| `'edge'` \| `'combo'` | - | ✓ |
| state | 状态 | string | - | ✓ |
**返回值**:
- **类型**: NodeData[] \| EdgeData[] \| ComboData[]
- **描述**: 返回指定状态下的节点数据、边数据或组合数据
**示例**:
```typescript
const selectedNodes = graph.getElementDataByState('node', 'selected');
console.log('选中的节点:', selectedNodes);
const selectedEdges = graph.getElementDataByState('edge', 'selected');
console.log('选中的边:', selectedEdges);
const selectedCombos = graph.getElementDataByState('combo', 'selected');
console.log('选中的组合:', selectedCombos);
```
**内置状态**:
- `'selected'`
- `'highlight'`
- `'active'`
- `'inactive'`
- `'disabled'`
### Graph.getNeighborNodesData()
获取节点或组合的一跳邻居节点数据。
```typescript
getNeighborNodesData(id: ID): NodeData[];
```
**参数**:
| 参数 | 描述 | 类型 | 默认值 | 必选 |
| ---- | --------------- | ------ | ------ | ---- |
| id | 节点或组合的 ID | string | - | ✓ |
**返回值**:
- **类型**: NodeData[]
- **描述**: 返回邻居节点数据
**示例**:
```typescript
const neighbors = graph.getNeighborNodesData('node-1');
console.log('邻居节点:', neighbors);
```
### Graph.getRelatedEdgesData()
获取节点或组合关联边的数据。
```typescript
getRelatedEdgesData(id: ID, direction?: EdgeDirection): EdgeData[];
```
**参数**:
| 参数 | 描述 | 类型 | 默认值 | 必选 |
| --------- | --------------- | ----------------------------- | ------ | ---- |
| id | 节点或组合的 ID | string | - | ✓ |
| direction | 边的方向 | `'in'` \| `'out'` \| `'both'` | - | |
**返回值**:
- **类型**: EdgeData[]
- **描述**: 返回与指定节点或组合关联的边数据
**示例**:
```typescript
const relatedEdges = graph.getRelatedEdgesData('node-1');
console.log('关联边:', relatedEdges);
```
### Graph.getParentData()
获取节点或组合的父元素数据。
```typescript
getParentData(id: ID, hierarchy: HierarchyKey): NodeLikeData | undefined;
```
**参数**:
| 参数 | 描述 | 类型 | 默认值 | 必选 |
| --------- | ---------------- | --------------------- | ------ | ---- |
| id | 节点或组合的 ID | string | - | ✓ |
| hierarchy | 指定层级关系类型 | `'tree'` \| `'combo'` | - | |
**返回值**:
- **类型**: NodeData \| ComboData \| undefined
- **描述**: 返回父元素数据,如果不存在则返回 undefined
**示例**:
```typescript
// 获取树图中节点的父节点
const treeParent = graph.getParentData('node1', 'tree');
// 获取组合中节点的父组合
const comboParent = graph.getParentData('node1', 'combo');
```
### Graph.getChildrenData()
获取节点或组合的子元素数据。
```typescript
getChildrenData(id: ID):(NodeData \| ComboData)[];
```
**参数**:
| 参数 | 描述 | 类型 | 默认值 | 必选 |
| ---- | --------------- | ------ | ------ | ---- |
| id | 节点或组合的 ID | string | - | ✓ |
**返回值**:
- **类型**: (NodeData \| ComboData)[]
- **描述**: 返回子元素数据数组
**注意**:
- **查询 combo 的子元素**:如果 id 对应的是 combo 元素,可以直接通过此 API 获取其所有子元素。
- **查询节点的子元素**:如果 id 对应的是节点,只有当图数据为树结构(即节点数据中维护有 `children` 字段,且 `children` 为该节点的子节点 ID 数组)时,才能通过此 API 获取到该节点的子元素。否则返回空数组。
**示例**:
```typescript
// 获取组合的子元素
const children = graph.getChildrenData('combo1');
console.log('子节点数量:', children.length);
// 处理每个子元素
children.forEach((child) => {
console.log('子元素ID:', child.id);
});
```
### Graph.getAncestorsData()
获取节点或组合的所有祖先元素数据。
```typescript
getAncestorsData(id: ID, hierarchy: HierarchyKey): NodeLikeData[];
```
**参数**:
| 参数 | 描述 | 类型 | 默认值 | 必选 |
| --------- | ---------------- | --------------------- | ------ | ---- |
| id | 节点或组合的 ID | string | - | ✓ |
| hierarchy | 指定层级关系类型 | `'tree'` \| `'combo'` | - | ✓ |
**返回值**:
- **类型**: [NodeData](#nodedata)[] \| [ComboData](#combodata)[]
- **描述**: 返回祖先元素数据数组,从父节点到根节点的顺序排列
**示例**:
```typescript
// 获取树图中节点的所有祖先节点
const treeAncestors = graph.getAncestorsData('node1', 'tree');
console.log(
'祖先节点路径:',
treeAncestors.map((node) => node.id),
);
// 获取组合中节点的所有父组合
const comboAncestors = graph.getAncestorsData('node1', 'combo');
```
### Graph.getDescendantsData()
获取节点或组合的所有后代元素数据。
```typescript
getDescendantsData(id: ID): NodeLikeData[];
```
**参数**:
| 参数 | 描述 | 类型 | 默认值 | 必选 |
| ---- | --------------- | ------ | ------ | ---- |
| id | 节点或组合的 ID | string | - | ✓ |
**返回值**:
- **类型**: [NodeData](#nodedata)[] \| [ComboData](#combodata)[]
- **描述**: 返回后代元素数据数组
**示例**:
```typescript
// 获取节点的所有后代
const descendants = graph.getDescendantsData('node1');
console.log('后代数量:', descendants.length);
// 处理所有后代元素
descendants.forEach((descendant) => {
console.log('后代元素ID:', descendant.id);
});
```
### Graph.setData()
设置图的完整数据。
```typescript
setData(data: GraphData | ((prev: GraphData) => GraphData)): void;
```
**参数**:
| 参数 | 描述 | 类型 | 默认值 | 必选 |
| ---- | ------------------------------ | ----------------------------------------------------------- | ------ | ---- |
| data | 新的图数据或返回新图数据的函数 | [GraphData](#graphdata) \| ((prev: GraphData) => GraphData) | - | ✓ |
**示例**:
```typescript
// 直接设置数据
graph.setData({
nodes: [
{ id: 'node1', style: { x: 100, y: 100 } },
{ id: 'node2', style: { x: 200, y: 200 } },
],
edges: [{ id: 'edge1', source: 'node1', target: 'node2' }],
});
// 使用函数式增量更新:获取当前图数据,并返回新的图数据
graph.setData((prev) => ({
...prev,
nodes: [...prev.nodes, { id: 'node3', style: { x: 300, y: 300 } }],
}));
```
### Graph.addData()
新增元素数据。
```typescript
addData(data: GraphData | ((prev: GraphData) => GraphData)): void;
```
**参数**:
| 参数 | 描述 | 类型 | 默认值 | 必选 |
| ---- | ------------------------------------ | ----------------------------------------------------------- | ------ | ---- |
| data | 需要添加的图数据或返回新图数据的函数 | [GraphData](#graphdata) \| ((prev: GraphData) => GraphData) | - | ✓ |
**示例**:
```typescript
graph.addData({
nodes: [{ id: 'node-1' }, { id: 'node-2' }],
edges: [{ source: 'node-1', target: 'node-2' }],
});
```
### Graph.addNodeData()
新增节点数据。
```typescript
addNodeData(data: NodeData[] | ((prev: NodeData[]) => NodeData[])): void;
```
**参数**:
| 参数 | 描述 | 类型 | 默认值 | 必选 |
| ---- | ------------------------------------ | ----------------------------------------------------------- | ------ | ---- |
| data | 要添加的节点数据或返回节点数据的函数 | [NodeData](#nodedata)[] \| (prev: NodeData[]) => NodeData[] | - | ✓ |
**示例**:
```typescript
// 添加单个节点
graph.addNodeData([
{
id: 'node1',
style: { x: 100, y: 100 },
data: { label: '节点 1' },
},
]);
// 批量添加节点
graph.addNodeData([
{ id: 'node2', style: { x: 200, y: 200 } },
{ id: 'node3', style: { x: 300, y: 300 } },
]);
// 函数式添加
graph.addNodeData((prev) => [...prev, { id: 'node4', style: { x: 400, y: 400 } }]);
```
### Graph.addEdgeData()
新增边数据。
```typescript
addEdgeData(data: EdgeData[] | ((prev: EdgeData[]) => EdgeData[])): void;
```
**参数**:
| 参数 | 描述 | 类型 | 默认值 | 必选 |
| ---- | -------------------------------- | ------------------------------------------------------------- | ------ | ---- |
| data | 要添加的边数据或返回边数据的函数 | [EdgeData](#edgedata)[] \| ((prev: EdgeData[]) => EdgeData[]) | - | ✓ |
**示例**:
```typescript
// 添加单条边
graph.addEdgeData([
{
id: 'edge1',
source: 'node1',
target: 'node2',
data: {
weight: 1,
label: '关系',
},
},
]);
// 批量添加边
graph.addEdgeData([
{ id: 'edge2', source: 'node2', target: 'node3' },
{ id: 'edge3', source: 'node3', target: 'node1' },
]);
// 函数式添加
graph.addEdgeData((prev) => [...prev, { id: 'edge4', source: 'node1', target: 'node4' }]);
```
### Graph.addComboData()
新增组合数据。
```typescript
addComboData(data: ComboData[] | ((prev: ComboData[]) => ComboData[])): void;
```
**参数**:
| 参数 | 描述 | 类型 | 默认值 | 必选 |
| ---- | ------------------------------------ | --------------------------------------------------------------- | ------ | ---- |
| data | 要添加的组合数据或返回组合数据的函数 | [ComboData](#combodata)[] \| (prev: ComboData[]) => ComboData[] | - | ✓ |
**示例**:
```typescript
graph.addComboData([{ id: 'combo1', children: ['node1', 'node2'] }]);
```
### Graph.addChildrenData()
为树图节点添加子节点数据。
⚠️ **注意**: 为组合添加子节点使用 addNodeData / addComboData 方法。
```typescript
addChildrenData(parentId: ID, childrenData: NodeData[]): void;
```
**参数**:
| 参数 | 描述 | 类型 | 默认值 | 必选 |
| ------------ | ---------- | ----------------------- | ------ | ---- |
| parentId | 父节点 ID | string | - | ✓ |
| childrenData | 子节点数据 | [NodeData](#nodedata)[] | - | ✓ |
**示例**:
```typescript
graph.addChildrenData('node1', [{ id: 'node2' }]);
```
### Graph.removeData()
删除元素数据。
```typescript
removeData(ids: DataID | ((data: GraphData) => DataID)): void;
```
**参数**:
| 参数 | 描述 | 类型 | 默认值 | 必选 |
| ---- | ------------------------------------ | -------------------------------------------------- | ------ | ---- |
| ids | 要删除的元素 ID 或返回元素 ID 的函数 | [DataID](#dataid) \| ((data: GraphData) => DataID) | - | ✓ |
**返回值**:
- **类型**: void
**示例**:
```typescript
graph.removeData({
nodes: ['node-1', 'node-2'],
edges: ['edge-1'],
});
```
### Graph.removeNodeData()
删除节点数据。
```typescript
removeNodeData(ids: ID[] | ((data: NodeData[]) => ID[])): void;
```
**参数**:
| 参数 | 描述 | 类型 | 默认值 | 必选 |
| ---- | ------------------------------------ | --------------------------------------------------------------- | ------ | ---- |
| ids | 要删除的节点 ID 或返回节点 ID 的函数 | [ID](#id)[] \| ((data: [NodeData](#nodedata)[]) => [ID](#id)[]) | - | ✓ |
**返回值**:
- **类型**: void
**示例**:
```typescript
graph.removeNodeData(['node-1', 'node-2']);
```
### Graph.removeEdgeData()
删除边数据。
```typescript
removeEdgeData(ids: ID[] | ((data: EdgeData[]) => ID[])): void;
```
**参数**:
| 参数 | 描述 | 类型 | 默认值 | 必选 |
| ---- | -------------------------------- | --------------------------------------------------------------- | ------ | ---- |
| ids | 要删除的边 ID 或返回边 ID 的函数 | [ID](#id)[] \| ((data: [EdgeData](#edgedata)[]) => [ID](#id)[]) | - | ✓ |
**返回值**:
- **类型**: void
**示例**:
```typescript
graph.removeEdgeData(['edge-1']);
```
### Graph.removeComboData()
删除组合数据。
```typescript
removeComboData(ids: ID[] | ((data: ComboData[]) => ID[])): void;
```
**参数**:
| 参数 | 描述 | 类型 | 默认值 | 必选 |
| ---- | ------------------------------------ | --------------------------------------------------------------- | ------ | ---- |
| ids | 要删除的组合 ID 或返回组合 ID 的函数 | [ID](#id)[] \| (data: [ComboData](#combodata)[]) => [ID](#id)[] | - | ✓ |
**返回值**:
- **类型**: void
**示例**:
```typescript
graph.removeComboData(['combo-1']);
```
### Graph.updateData()
更新元素数据。
⚠️ **注意**: 只需要传入需要更新的数据即可,不必传入完整的数据。
```typescript
updateData(data: PartialGraphData | ((prev: GraphData) => PartialGraphData)): void;
```
**参数**:
| 参数 | 描述 | 类型 | 默认值 | 必选 |
| ---- | ------------------------------------ | -------------------------------------------------------------------------------- | ------ | ---- |
| data | 要更新的元素数据或返回元素数据的函数 | [PartialGraphData](#partialgraphdata) \| ((prev: GraphData) => PartialGraphData) | - | ✓ |
**返回值**:
- **类型**: void
**示例**:
```typescript
graph.updateData({
nodes: [{ id: 'node-1', style: { x: 100, y: 100 } }],
edges: [{ id: 'edge-1', style: { lineWidth: 2 } }],
});
```
### Graph.updateNodeData()
更新节点数据。
⚠️ **注意**: 只需要传入需要更新的数据即可,不必传入完整的数据。
```typescript
updateNodeData(data: NodeData[] | ((prev: NodeData[]) => NodeData[])): void;
```
**参数**:
| 参数 | 描述 | 类型 | 默认值 | 必选 |
| ---- | ------------------------------------ | ---------------------------------------------- | ------ | ---- |
| data | 要更新的节点数据或返回节点数据的函数 | NodeData[] \| (prev: NodeData[]) => NodeData[] | - | ✓ |
**返回值**:
- **类型**: void
**示例**:
```typescript
graph.updateNodeData([{ id: 'node-1', style: { x: 100, y: 100 } }]);
```
### Graph.updateEdgeData()
更新边数据。
⚠️ **注意**: 只需要传入需要更新的数据即可,不必传入完整的数据。
```typescript
updateEdgeData(data: (PartialEdgeData<EdgeData>[] | ((prev: EdgeData[]) => PartialEdgeData<EdgeData>[]))): void;
```
**参数**:
| 参数 | 描述 | 类型 | 默认值 | 必选 |
| ---- | -------------------------------- | ---------------------------------------------------------------------------------------------------------------------------- | ------ | ---- |
| data | 要更新的边数据或返回边数据的函数 | [PartialEdgeData\<EdgeData\>](#partialedgedata)[] \| (prev: EdgeData[]) => [PartialEdgeData\<EdgeData\>](#partialedgedata)[] | - | ✓ |
**返回值**:
- **类型**: void
**示例**:
```typescript
graph.updateEdgeData([{ id: 'edge-1', style: { lineWidth: 2 } }]);
```
### Graph.updateComboData()
更新组合数据。
⚠️ **注意**: 只需要传入需要更新的数据即可,不必传入完整的数据。
```typescript
updateComboData(data: (ComboData[] | ((prev: ComboData[]) => ComboData[]))): void;
```
**参数**:
| 参数 | 描述 | 类型 | 默认值 | 必选 |
| ---- | ------------------------------------ | --------------------------------------------------------------- | ------ | ---- |
| data | 要更新的组合数据或返回组合数据的函数 | [ComboData](#combodata)[] \| (prev: ComboData[]) => ComboData[] | - | ✓ |
**返回值**:
- **类型**: void
**示例**:
```typescript
graph.updateComboData([{ id: 'combo-1', style: { x: 100, y: 100 } }]);
```
### Graph.hasNode()
判断节点是否存在
```typescript
hasNode(id:ID): boolean;
```
**参数**:
| 参数 | 描述 | 类型 | 默认值 | 必选 |
| ---- | -------------------- | --------- | ------ | ---- |
| id | 需要进行判断的节点id | [ID](#id) | - | ✓ |
**返回值**:
- **类型**: boolean
**示例**:
```typescript
graph.hasNode('node-1');
```
### Graph.hasEdge()
判断边是否存在
```typescript
hasEdge(id:ID): boolean;
```
**参数**:
| 参数 | 描述 | 类型 | 默认值 | 必选 |
| ---- | ------------------ | --------- | ------ | ---- |
| id | 需要进行判断的边id | [ID](#id) | - | ✓ |
**返回值**:
- **类型**: boolean
**示例**:
```typescript
graph.hasEdge('edge-1');
```
### Graph.hasCombo()
判断combo是否存在
```typescript
hasCombo(id:ID): boolean;
```
**参数**:
| 参数 | 描述 | 类型 | 默认值 | 必选 |
| ---- | ------------------------- | --------- | ------ | ---- |
| id | 需要进行判断的combo组合id | [ID](#id) | - | ✓ |
**返回值**:
- **类型**: boolean
**示例**:
```typescript
graph.hasCombo('combo-1');
```
## 类型定义
### ID
元素 ID 类型。
```typescript
type ID = string;
```
### DataID
多个元素 ID 类型。
```typescript
interface DataID {
nodes?: ID[];
edges?: ID[];
combos?: ID[];
}
```
### GraphData
G6 图数据类型。
```typescript
interface GraphData {
nodes?: NodeData[];
edges?: EdgeData[];
combos?: ComboData[];
}
```
### NodeData
节点数据类型。
```typescript
interface NodeData {
id: string; // 节点 ID
type?: string; // 节点类型
data?: Record<string, any>; // 节点数据
style?: Record<string, any>; // 节点样式
states?: string[]; // 节点初始状态
combo?: string; // 所属组合
children?: string[]; // 子节点 ID 数组
}
```
详细类型定义请参考 [节点数据](/manual/data#节点数据nodedata)。
### EdgeData
边数据类型。
```typescript
interface EdgeData {
source: string; // 起点 ID
target: string; // 终点 ID
id?: string; // 边 ID
type?: string; // 边类型
data?: Record<string, any>; // 边数据
style?: Record<string, any>; // 边样式
states?: string[]; // 边初始状态
}
```
详细类型定义请参考 [边数据](/manual/data#边数据edgedata)。
### ComboData
组合数据类型。
```typescript
interface ComboData {
id: string; // 组合 ID
type?: string; // 组合类型
data?: Record<string, any>; // 组合数据
style?: Record<string, any>; // 组合样式
states?: string[]; // 组合初始状态
combo?: string; // 父组合 ID
}
```
详细类型定义请参考 [组合数据](/manual/data#组合数据combodata)。
Api Skill
packages/site/docs/api/element.en.md anthropic-skill ~5,341 tokens---
title: Element Operations
order: 1
---
## Overview of Element Operations
The [Element](/en/manual/element/overview) operation API in G6 allows you to control the behavior and attributes of elements such as nodes, edges, and Combos in the graph. These APIs can be used for:
1. **Element State Management**: Set, update, or remove the state of elements
2. **Element Display Control**: Control the z-index and visibility of elements
3. **Element Collapse/Expand**: Operate the collapse/expand state of collapsible elements
4. **Element Position Operations**: Move and align element positions
5. **Element Focus**: Focus the viewport on specific elements
Through these operations, you can achieve rich interactive effects and visual presentations.
## API Reference
### Graph.getElementPosition(id)
Get the position of an element.
```typescript
getElementPosition(id: ID): Point;
```
**Parameters**:
| Parameter | Description | Type | Default | Required |
| --------- | ----------- | ------ | ------- | -------- |
| id | Element ID | string | - | ✓ |
**Return Value**:
- **Type**: [number, number] \| [number, number, number]
- **Description**: Returns the coordinates of the element
**Example**:
```typescript
graph.getElementPosition('node1');
```
### Graph.getElementRenderBounds(id)
Get the rendering bounding box of the element itself and its child nodes in the world coordinate system.
```typescript
getElementRenderBounds(id: ID): AABB;
```
**Parameters**:
| Parameter | Description | Type | Default | Required |
| --------- | ----------- | ------ | ------- | -------- |
| id | Element ID | string | - | ✓ |
**Return Value**:
- **Type**: [AABB](#aabb)
- **Description**: Returns the rendering bounding box of the element
### Graph.getElementRenderStyle(id)
Get the rendering style of an element.
```typescript
getElementRenderStyle(id: ID): Record<string, any>;
```
**Parameters**:
| Parameter | Description | Type | Default | Required |
| --------- | ----------- | ------ | ------- | -------- |
| id | Element ID | string | - | ✓ |
**Return Value**:
- **Type**: Record<string, any>
- **Description**: Returns the rendering style of the element
### Graph.getElementState(id)
Get the state of an element.
```typescript
getElementState(id: ID): State[];
```
**Parameters**:
| Parameter | Description | Type | Default | Required |
| --------- | ----------- | ------ | ------- | -------- |
| id | Element ID | string | - | ✓ |
**Return Value**:
- **Type**: [State](#state)[]
- **Description**: Returns the state of the element
### Graph.getElementType(id)
Get the type of an element.
```typescript
getElementType(id: ID): string;
```
**Parameters**:
| Parameter | Description | Type | Default | Required |
| --------- | ----------- | ------ | ------- | -------- |
| id | Element ID | string | - | ✓ |
**Return Value**:
- **Type**: string
- **Description**: Returns the type of the element
### Graph.getElementVisibility(id)
Get the visibility of an element.
```typescript
getElementVisibility(id: ID): 'visible' | 'hidden';
```
**Parameters**:
| Parameter | Description | Type | Default | Required |
| --------- | ----------- | ------ | ------- | -------- |
| id | Element ID | string | - | ✓ |
**Return Value**:
- **Type**: 'visible' | 'hidden'
- **Description**: Returns the visibility of the element
### Graph.getElementZIndex(id)
Get the z-index of an element.
```typescript
getElementZIndex(id: ID): number;
```
**Parameters**:
| Parameter | Description | Type | Default | Required |
| --------- | ----------- | ------ | ------- | -------- |
| id | Element ID | string | - | ✓ |
**Return Value**:
- **Type**: number
- **Description**: Returns the z-index of the element
### Graph.setElementState(id, state, options)
Set the state of an element, supporting two calling methods:
```typescript
// Set the state of a single element
setElementState(id: ID, state: State | State[], animation?: boolean): Promise<void>;
// Set the state of multiple elements
setElementState(state: Record<ID, State | State[]>, animation?: boolean): Promise<void>;
```
**Parameters**:
**Single Element State Setting**
| Parameter | Description | Type | Default | Required |
| --------- | ----------------- | --------------- | ------- | -------- | --- |
| id | Element ID to set | string | - | ✓ |
| state | State to set | [State](#state) | State[] | - | ✓ |
| animation | Enable animation | boolean | - | |
**Batch Element State Setting**
| Parameter | Description | Type | Default | Required |
| --------- | ------------------------------ | -------------------------- | -------- | -------- | --- |
| state | Mapping of element ID to state | Record<ID, [State](#state) | State[]> | - | ✓ |
| animation | Enable animation | boolean | - | |
**Return Value**:
- **Type**: Promise<void>
- **Description**: Returns a Promise that resolves when the state setting operation is complete
**Example**:
```typescript
// Set the state of a single element
await graph.setElementState('node1', 'selected');
// Set the state of multiple elements
await graph.setElementState({
node1: 'selected',
node2: 'hover',
node3: ['selected', 'hover'],
});
```
### Graph.setElementVisibility(id, visibility, animation)
Set the visibility of an element, supporting two calling methods:
```typescript
// Set the visibility of a single element
setElementVisibility(id: ID, visibility: 'visible' | 'hidden', animation?: boolean): Promise<void>;
// Set the visibility of multiple elements
setElementVisibility(visibility: Record<ID, 'visible' | 'hidden'>, animation?: boolean): Promise<void>;
```
**Parameters**:
**Single Element Visibility Setting**
| Parameter | Description | Type | Default | Required |
| ---------- | ----------------- | --------- | -------- | -------- | --- |
| id | Element ID to set | string | - | ✓ |
| visibility | Visibility to set | 'visible' | 'hidden' | - | ✓ |
| animation | Enable animation | boolean | - | |
**Batch Element Visibility Setting**
| Parameter | Description | Type | Default | Required |
| ---------- | ----------------------------------- | -------------------- | --------- | -------- | --- |
| visibility | Mapping of element ID to visibility | Record<ID, 'visible' | 'hidden'> | - | ✓ |
| animation | Enable animation | boolean | - | |
**Return Value**:
- **Type**: Promise<void>
- **Description**: Returns a Promise that resolves when the visibility setting operation is complete
**Example**:
```typescript
// Set the visibility of a single element
await graph.setElementVisibility('node1', 'hidden');
// Set the visibility of multiple elements
await graph.setElementVisibility({
node1: 'hidden',
node2: 'visibility',
});
```
### Graph.setElementZIndex(id, zIndex)
Set the z-index of an element, supporting two calling methods:
```typescript
// Set the z-index of a single element
setElementZIndex(id: ID, zIndex: number): Promise<void>;
// Set the z-index of multiple elements
setElementZIndex(zIndex: Record<ID, number>): Promise<void>;
```
**Parameters**:
**Single Element Z-Index Setting**
| Parameter | Description | Type | Default | Required |
| --------- | ----------- | ------ | ------- | -------- |
| id | Element ID | string | - | ✓ |
| zIndex | Z-Index | number | - | ✓ |
**Batch Element Z-Index Setting**
| Parameter | Description | Type | Default | Required |
| --------- | -------------------------------- | ------------------ | ------- | -------- |
| zIndex | Mapping of element ID to z-index | Record<ID, number> | - | ✓ |
**Return Value**:
- **Type**: Promise<void>
- **Description**: Returns a Promise that resolves when the z-index setting operation is complete
**Example**:
```typescript
// Set the z-index of a single element
await graph.setElementZIndex('node1', 10);
// Set the z-index of multiple elements
await graph.setElementZIndex({
node1: 10,
node2: 20,
node3: 30,
});
```
### Graph.setNode(node)
Set the node style mapping, i.e., the value of `options.node`.
```typescript
setNode(node: NodeOptions): void;
```
**Parameters**:
| Parameter | Description | Type | Default | Required |
| --------- | ------------------ | ----------------------------------------------- | ------- | -------- |
| node | Node configuration | [NodeOptions](/en/manual/element/node/overview) | - | ✓ |
**Example**:
```typescript
// Set the fill color of all nodes to red
graph.setNode({
style: {
fill: 'red',
},
});
```
### Graph.setEdge(edge)
Set the edge style mapping, i.e., the value of `options.edge`.
```typescript
setEdge(edge: EdgeOptions): void;
```
**Parameters**:
| Parameter | Description | Type | Default | Required |
| --------- | ------------------ | ----------------------------------------------- | ------- | -------- |
| edge | Edge configuration | [EdgeOptions](/en/manual/element/edge/overview) | - | ✓ |
### Graph.setCombo(combo)
Set the combo style mapping, i.e., the value of `options.combo`.
```typescript
setCombo(combo: ComboOptions): void;
```
**Parameters**:
| Parameter | Description | Type | Default | Required |
| --------- | ------------------- | ------------------------------------------------- | ------- | -------- |
| combo | Combo configuration | [ComboOptions](/en/manual/element/combo/overview) | - | ✓ |
### Graph.collapseElement(id, options)
Collapse the specified element, usually used to collapse Combos or nodes with child elements.
```typescript
collapseElement(id: ID, options?: boolean | CollapseExpandNodeOptions): Promise<void>;
```
**Parameters**:
| Parameter | Description | Type | Default | Required |
| --------- | --------------------------------------------------------------- | ------- | ------------------------------------------------------- | -------- | --- |
| id | Element ID to collapse | string | - | ✓ |
| options | Enable animation or detailed configuration for collapsing nodes | boolean | [CollapseExpandNodeOptions](#collapseexpandnodeoptions) | - | |
**Return Value**:
- **Type**: Promise<void>
- **Description**: Returns a Promise that resolves when the collapse operation is complete
**Example**:
```typescript
// Simple collapse with default configuration
await graph.collapseElement('combo1');
// Collapse with animation
graph.collapseElement('combo1', true);
// Collapse while ensuring the position of expanded/collapsed nodes remains unchanged
await graph.collapseElement('combo1', {
align: true,
});
```
### Graph.expandElement(id, options)
Expand the specified element, usually used to expand previously collapsed Combos or nodes.
```typescript
expandElement(id: ID, options?: boolean | CollapseExpandNodeOptions): Promise<void>;
```
**Parameters**:
| Parameter | Description | Type | Default | Required |
| --------- | -------------------------------------------------------------- | ------- | ------------------------------------------------------- | -------- | --- |
| id | Element ID to expand | string | - | ✓ |
| options | Enable animation or detailed configuration for expanding nodes | boolean | [CollapseExpandNodeOptions](#collapseexpandnodeoptions) | - | |
**Return Value**:
- **Type**: Promise<void>
- **Description**: Returns a Promise that resolves when the expand operation is complete
**Example**:
```typescript
// Simple expand with default configuration
await graph.expandElement('combo1');
// Expand with animation
await graph.expandElement('combo1', true);
// Expand while ensuring the position of expanded/collapsed nodes remains unchanged
await graph.expandElement('combo1', {
align: true,
});
```
### Graph.frontElement(id)
Bring the specified element to the front, making it appear above other overlapping elements.
```typescript
frontElement(id: ID | ID[]): void;
```
**Parameters**:
| Parameter | Description | Type | Default | Required |
| --------- | ----------- | ------ | -------- | -------- | --- |
| id | Element ID | string | string[] | - | ✓ |
**Return Value**:
- **Type**: void
**Example**:
```typescript
// Bring a node to the front
graph.frontElement('node1');
// Bring multiple selected nodes to the front
graph.frontElement(['node1', 'node2', 'node3']);
```
### Graph.showElement(id, animation)
Show the specified element.
```typescript
showElement(id: ID | ID[], animation?: boolean): Promise<void>;
```
**Parameters**:
| Parameter | Description | Type | Default | Required |
| --------- | ---------------- | ------- | -------- | -------- | --- |
| id | Element ID | string | string[] | - | ✓ |
| animation | Enable animation | boolean | - | |
**Return Value**:
- **Type**: Promise<void>
- **Description**: Returns a Promise that resolves when the show operation is complete
**Example**:
```typescript
// Show a single element
await graph.showElement('node1');
// Show an element with animation
await graph.showElement('node1', true);
// Show multiple elements
await graph.showElement(['node1', 'node2', 'node3']);
```
### Graph.hideElement(id, animation)
Hide the specified element.
```typescript
hideElement(id: ID | ID[], animation?: boolean): Promise<void>;
```
**Parameters**:
| Parameter | Description | Type | Default | Required |
| --------- | ---------------- | ------- | -------- | -------- | --- |
| id | Element ID | string | string[] | - | ✓ |
| animation | Enable animation | boolean | - | |
**Return Value**:
- **Type**: Promise<void>
- **Description**: Returns a Promise that resolves when the hide operation is complete
**Example**:
```typescript
// Hide an element without animation
await graph.hideElement('node1');
// Hide an element with animation
await graph.hideElement('node1', true);
// Hide multiple elements
await graph.hideElement(['node1', 'node2', 'node3'], true);
```
### Graph.translateElementBy(id, offset, animation)
Translate an element by a specified distance, supporting two calling methods:
```typescript
// Translate an element by a specified distance (relative translation)
translateElement(id: ID, offset: Point, animation?: boolean): Promise<void>;
// Translate multiple elements by a specified distance (relative translation)
translateElement(offsets: Record<ID, Point>, animation?: boolean): Promise<void>;
```
**Parameters**:
**Single Element Translation**
| Parameter | Description | Type | Default | Required |
| --------- | -------------------------------------- | ---------------- | ------- | -------- |
| id | Element ID | string | - | ✓ |
| offset | Relative translation distance [dx, dy] | [number, number] | - | ✓ |
| animation | Enable animation | boolean | - | |
**Batch Element Translation**
| Parameter | Description | Type | Default | Required |
| --------- | --------------------------------------------- | ---------------------------- | ------- | -------- |
| offsets | Mapping of element ID to translation distance | Record<ID, [number, number]> | - | ✓ |
| animation | Enable animation | boolean | - | |
**Return Value**:
- **Type**: Promise<void>
- **Description**: Returns a Promise that resolves when the translation operation is complete
**Example**:
```typescript
// Translate right by 100 pixels and down by 50 pixels
await graph.translateElementBy('node1', [100, 50]);
// Translate with animation
await graph.translateElementBy('node1', [100, 50], true);
// Apply the same translation to multiple nodes
await graph.translateElementBy(
{
node1: [50, 50],
node2: [100, 100],
node3: [150, 150],
},
true,
);
```
### Graph.translateElementTo(id, position, animation)
Move an element to a specified position, supporting two calling methods:
```typescript
// Move an element to a specified position (absolute position)
translateElementTo(id: ID, position: Point, animation?: boolean): Promise<void>;
// Move multiple elements to specified positions (absolute position)
translateElementTo(positions: Record<ID, Point>, animation?: boolean): Promise<void>;
```
**Parameters**:
**Single Element Movement**
| Parameter | Description | Type | Default | Required |
| --------- | ------------------------------- | ---------------- | ------- | -------- |
| id | Element ID | string | - | ✓ |
| position | Target absolute position [x, y] | [number, number] | - | ✓ |
| animation | Enable animation | boolean | - | |
**Batch Element Movement**
| Parameter | Description | Type | Default | Required |
| --------- | ---------------------------------------- | -------------------------------- | ------- | -------- |
| positions | Mapping of element ID to target position | Record<string, [number, number]> | - | ✓ |
| animation | Enable animation | boolean | - | |
**Return Value**:
- **Type**: Promise<void>
- **Description**: Returns a Promise that resolves when the movement operation is complete
**Example**:
```typescript
// Move a node to position (200, 300) on the canvas
await graph.translateElementTo('node1', [200, 300]);
// Move with animation
await graph.translateElementTo('node1', [200, 300], true);
// Arrange a group of nodes neatly
await graph.translateElementTo(
{
node1: [100, 100],
node2: [200, 200],
node3: [300, 100],
},
true,
);
```
### Graph.focusElement(id, animation)
Focus on the specified element, centering it in the viewport.
```typescript
focusElement(id: ID | ID[], animation?: ViewportAnimationEffectTiming): Promise<void>;
```
**Parameters**:
| Parameter | Description | Type | Default | Required |
| --------- | ----------------------------------- | --------------------------------------------------------------- | -------- | -------- | --- |
| id | One or more element IDs to focus on | string | string[] | - | ✓ |
| animation | Viewport animation configuration | [ViewportAnimationEffectTiming](#viewportanimationeffecttiming) | - | |
**Return Value**:
- **Type**: Promise<void>
- **Description**: Returns a Promise that resolves when the focus operation is complete
**Example**:
```typescript
// Focus on a single node
await graph.focusElement('node1');
// Use custom animation configuration
await graph.focusElement('node1', {
duration: 800,
easing: 'ease-in-out',
});
// Focus on multiple nodes
await graph.focusElement(['node1', 'node2', 'node3']);
```
## Type Definitions
### CollapseExpandNodeOptions
Configuration options for collapsing or expanding elements.
```typescript
interface CollapseExpandNodeOptions {
/**
* Enable animation
*/
animation?: boolean;
/**
* Ensure the position of expanded/collapsed nodes remains unchanged
*/
align?: boolean;
}
```
### ViewportAnimationEffectTiming
Viewport animation configuration type.
```typescript
type ViewportAnimationEffectTiming =
| boolean // Enable animation
| {
easing?: string; // Easing function
duration?: number; // Animation duration (ms)
};
```
### AABB
AABB (Axis-Aligned Bounding Box) is a fundamental concept in computer graphics.
```typescript
interface AABB {
x: number; // x-coordinate of the top-left corner of the rectangle
y: number; // y-coordinate of the top-left corner of the rectangle
width: number; // Width of the rectangle
height: number; // Height of the rectangle
}
```
### State
Element state type.
```typescript
type State = 'selected' | 'hover' | 'active' | 'inactive' | 'disabled' | string;
```
Api Skill
packages/site/docs/api/element.zh.md anthropic-skill ~3,832 tokens---
title: 元素操作
order: 1
---
## 元素操作概述
G6 中的 [元素](/manual/element/overview) 操作 API 允许您控制图中节点、边和组合(Combo)等元素的行为和属性。这些 API 可以用于:
1. **元素状态管理**:设置、更新或移除元素的状态
2. **元素显示控制**:控制元素的层级、可见性
3. **元素展开/收起**:操作可折叠元素的展开/收起状态
4. **元素位置操作**:移动、对齐元素位置
5. **元素聚焦**:将视口聚焦到特定元素
通过这些操作,您可以实现丰富的交互效果和视觉呈现。
## API 参考
### Graph.getElementPosition(id)
获取元素位置。
```typescript
getElementPosition(id: ID): Point;
```
**参数**:
| 参数 | 描述 | 类型 | 默认值 | 必选 |
| ---- | ------- | ------ | ------ | ---- |
| id | 元素 ID | string | - | ✓ |
**返回值**:
- **类型**: [number, number] \| [number, number, number]
- **描述**: 返回元素的坐标位置
**示例**:
```typescript
graph.getElementPosition('node1');
```
### Graph.getElementRenderBounds(id)
获取元素自身以及子节点在世界坐标系下的渲染包围盒。
```typescript
getElementRenderBounds(id: ID): AABB;
```
**参数**:
| 参数 | 描述 | 类型 | 默认值 | 必选 |
| ---- | ------- | ------ | ------ | ---- |
| id | 元素 ID | string | - | ✓ |
**返回值**:
- **类型**: [AABB](#aabb)
- **描述**: 返回元素的渲染包围盒
### Graph.getElementRenderStyle(id)
获取元素的渲染样式。
```typescript
getElementRenderStyle(id: ID): Record<string, any>;
```
**参数**:
| 参数 | 描述 | 类型 | 默认值 | 必选 |
| ---- | ------- | ------ | ------ | ---- |
| id | 元素 ID | string | - | ✓ |
**返回值**:
- **类型**: Record\<string, any\>
- **描述**: 返回元素的渲染样式
### Graph.getElementState(id)
获取元素的状态。
```typescript
getElementState(id: ID): State[];
```
**参数**:
| 参数 | 描述 | 类型 | 默认值 | 必选 |
| ---- | ------- | ------ | ------ | ---- |
| id | 元素 ID | string | - | ✓ |
**返回值**:
- **类型**: [State](#state)[]
- **描述**: 返回元素的状态
### Graph.getElementType(id)
获取元素类型。
```typescript
getElementType(id: ID): string;
```
**参数**:
| 参数 | 描述 | 类型 | 默认值 | 必选 |
| ---- | ------- | ------ | ------ | ---- |
| id | 元素 ID | string | - | ✓ |
**返回值**:
- **类型**: string
- **描述**: 返回元素的类型
### Graph.getElementVisibility(id)
获取元素可见性。
```typescript
getElementVisibility(id: ID): 'visible' | 'hidden' ;
```
**参数**:
| 参数 | 描述 | 类型 | 默认值 | 必选 |
| ---- | ------- | ------ | ------ | ---- |
| id | 元素 ID | string | - | ✓ |
**返回值**:
- **类型**: 'visible' | 'hidden'
- **描述**: 返回元素的可见性
### Graph.getElementZIndex(id)
获取元素层级。
```typescript
getElementZIndex(id: ID): number;
```
**参数**:
| 参数 | 描述 | 类型 | 默认值 | 必选 |
| ---- | ------- | ------ | ------ | ---- |
| id | 元素 ID | string | - | ✓ |
**返回值**:
- **类型**: number
- **描述**: 返回元素的层级
### Graph.setElementState(id, state, options)
设置元素状态,支持两种调用方式:
```typescript
// 设置单个元素状态
setElementState(id: ID, state: State | State[], animation?: boolean): Promise<void>;
// 批量设置元素状态
setElementState(state: Record<ID, State | State[]>, animation?: boolean): Promise<void>;
```
**参数**:
**单个元素状态设置**
| 参数 | 描述 | 类型 | 默认值 | 必选 |
| --------- | ------------------- | -------------------------- | ------ | ---- |
| id | 要设置状态的元素 ID | string | - | ✓ |
| state | 要设置的状态 | [State](#state) \| State[] | - | ✓ |
| animation | 是否启用动画 | boolean | - | |
**批量元素状态设置**
| 参数 | 描述 | 类型 | 默认值 | 必选 |
| --------- | ------------------ | -------------------------------------- | ------ | ---- |
| state | 元素ID到状态的映射 | Record<ID, [State](#state) \| State[]> | - | ✓ |
| animation | 是否启用动画 | boolean | - | |
**返回值**:
- **类型**: Promise\<void\>
- **描述**: 返回一个 Promise,状态设置操作完成后 resolve
**示例**:
```typescript
// 设置单个元素状态
await graph.setElementState('node1', 'selected');
// 设置多个元素状态
await graph.setElementState({
node1: 'selected',
node2: 'hover',
node3: ['selected', 'hover'],
});
```
### Graph.setElementVisibility(id, visibility, animation)
设置元素的可见性,支持两种调用方式:
```typescript
// 设置单个元素可见性
setElementVisibility(id: ID, visibility: 'visible' | 'hidden', animation?: boolean): Promise<void>;
// 批量设置元素可见性
setElementVisibility(visibility: Record<ID, 'visible' | 'hidden'>, animation?: boolean): Promise<void>;
```
**参数**:
**单个元素可见性设置**
| 参数 | 描述 | 类型 | 默认值 | 必选 |
| ---------- | --------------------- | ------------------------- | ------ | ---- |
| id | 要设置可见性的元素 ID | string | - | ✓ |
| visibility | 要设置的可见性 | `'visible'` \| `'hidden'` | - | ✓ |
| animation | 是否启用动画 | boolean | - | |
**批量元素可见性设置**
| 参数 | 描述 | 类型 | 默认值 | 必选 |
| ---------- | -------------------- | ------------------------------------- | ------ | ---- |
| visibility | 元素ID到可见性的映射 | Record<ID, `'visible'` \| `'hidden'`> | - | ✓ |
| animation | 是否启用动画 | boolean | - | |
**返回值**:
- **类型**: Promise\<void\>
- **描述**: 返回一个 Promise,可见性设置操作完成后 resolve
**示例**:
```typescript
// 设置单个元素可见性
await graph.setElementVisibility('node1', 'hidden');
// 设置多个元素可见性
await graph.setElementVisibility({
node1: 'hidden',
node2: 'visibility',
});
```
### Graph.setElementZIndex(id, zIndex)
设置元素的层级,有两种调用方式:
```typescript
// 设置单个元素层级
setElementZIndex(id: ID, zIndex: number): Promise<void>;
// 批量设置元素层级
setElementZIndex(zIndex: Record<ID, number>): Promise<void>;
```
**参数**:
**单个元素层级设置**
| 参数 | 描述 | 类型 | 默认值 | 必选 |
| ------ | ------- | ------ | ------ | ---- |
| id | 元素 ID | string | - | ✓ |
| zIndex | 层级 | number | - | ✓ |
**批量元素层级设置**
| 参数 | 描述 | 类型 | 默认值 | 必选 |
| ------ | ------------------ | ------------------ | ------ | ---- |
| zIndex | 元素ID到层级的映射 | Record<ID, number> | - | ✓ |
**返回值**:
- **类型**: Promise\<void\>
- **描述**: 返回一个 Promise,层级设置操作完成后 resolve
**示例**:
```typescript
// 设置单个元素层级
await graph.setElementZIndex('node1', 10);
// 设置多个元素层级
await graph.setElementZIndex({
node1: 10,
node2: 20,
node3: 30,
});
```
### Graph.setNode(node)
设置节点样式映射。即 `options.node` 的值。
```typescript
setNode(node: NodeOptions): void;
```
**参数**:
| 参数 | 描述 | 类型 | 默认值 | 必选 |
| ---- | -------- | -------------------------------------------- | ------ | ---- |
| node | 节点配置 | [NodeOptions](/manual/element/node/overview) | - | ✓ |
**示例**:
```typescript
// 设置所有的节点填充色为红色
graph.setNode({
style: {
fill: 'red',
},
});
```
### Graph.setEdge(edge)
设置边样式映射。即 `options.edge` 的值。
```typescript
setEdge(edge: EdgeOptions): void;
```
**参数**:
| 参数 | 描述 | 类型 | 默认值 | 必选 |
| ---- | ------ | -------------------------------------------- | ------ | ---- |
| edge | 边配置 | [EdgeOptions](/manual/element/edge/overview) | - | ✓ |
### Graph.setCombo(combo)
设置组合样式映射。即 `options.combo` 的值。
```typescript
setCombo(combo: ComboOptions): void;
```
**参数**:
| 参数 | 描述 | 类型 | 默认值 | 必选 |
| ----- | -------- | ---------------------------------------------- | ------ | ---- |
| combo | 组合配置 | [ComboOptions](/manual/element/combo/overview) | - | ✓ |
### Graph.collapseElement(id, options)
收起指定元素,通常用于折叠组合(Combo)或具有子元素的节点。
```typescript
collapseElement(id: ID, options?: boolean | CollapseExpandNodeOptions): Promise<void>;
```
**参数**:
| 参数 | 描述 | 类型 | 默认值 | 必选 |
| ------- | ---------------------------------- | ------------------------------------------------------------------ | ------ | ---- |
| id | 要收起的元素 ID | string | - | ✓ |
| options | 是否启用动画或收起节点的详细配置项 | boolean \| [CollapseExpandNodeOptions](#collapseexpandnodeoptions) | - | |
**返回值**:
- **类型**: Promise\<void\>
- **描述**: 返回一个 Promise,收起操作完成后 resolve
**示例**:
```typescript
// 简单收起,使用默认配置
await graph.collapseElement('combo1');
// 收起并启用动画
await graph.collapseElement('combo1', true);
// 收起并保证展开/收起的节点位置不变
await graph.collapseElement('combo1', {
align: true,
});
```
### Graph.expandElement(id, options)
展开指定元素,通常用于展开先前收起的组合(Combo)或节点。
```typescript
expandElement(id: ID, options?: boolean | CollapseExpandNodeOptions): Promise<void>;
```
**参数**:
| 参数 | 描述 | 类型 | 默认值 | 必选 |
| ------- | ---------------------------------- | ------------------------------------------------------------------ | ------ | ---- |
| id | 要展开的元素 ID | string | - | ✓ |
| options | 是否启用动画或展开节点的详细配置项 | boolean \| [CollapseExpandNodeOptions](#collapseexpandnodeoptions) | - | |
**返回值**:
- **类型**: Promise\<void\>
- **描述**: 返回一个 Promise,展开操作完成后 resolve
**示例**:
```typescript
// 简单展开,使用默认配置
await graph.expandElement('combo1');
// 展开并启用动画
await graph.expandElement('combo1', true);
// 展开并保证展开/收起的节点位置不变
await graph.expandElement('combo1', {
align: true,
});
```
### Graph.frontElement(id)
将指定元素置于最顶层,使其显示在其他重叠元素之上。
```typescript
frontElement(id: ID | ID[]): void;
```
**参数**:
| 参数 | 描述 | 类型 | 默认值 | 必选 |
| ---- | ------- | ------------------ | ------ | ---- |
| id | 元素 ID | string \| string[] | - | ✓ |
**返回值**:
- **类型**: void
**示例**:
```typescript
// 将节点置于最顶层
graph.frontElement('node1');
// 对于选中的多个节点,都置于最顶层
graph.frontElement(['node1', 'node2', 'node3']);
```
### Graph.showElement(id, animation)
显示指定元素。
```typescript
showElement(id: ID | ID[], animation?: boolean): Promise<void>;
```
**参数**:
| 参数 | 描述 | 类型 | 默认值 | 必选 |
| --------- | ------------ | ------------------ | ------ | ---- |
| id | 元素 ID | string \| string[] | - | ✓ |
| animation | 是否启用动画 | boolean | - | |
**返回值**:
- **类型**: Promise\<void\>
- **描述**: 返回一个 Promise,显示操作完成后 resolve
**示例**:
```typescript
// 显示单个元素
await graph.showElement('node1');
// 带动画显示元素
await graph.showElement('node1', true);
// 显示多个元素
await graph.showElement(['node1', 'node2', 'node3']);
```
### Graph.hideElement(id, animation)
隐藏指定元素。
```typescript
hideElement(id: ID | ID[], animation?: boolean): Promise<void>;
```
**参数**:
| 参数 | 描述 | 类型 | 默认值 | 必选 |
| --------- | ------------ | ------------------ | ------ | ---- |
| id | 元素 ID | string \| string[] | - | ✓ |
| animation | 是否启用动画 | boolean | - | |
**返回值**:
- **类型**: Promise\<void\>
- **描述**: 返回一个 Promise,隐藏操作完成后 resolve
**示例**:
```typescript
// 无动画隐藏元素
await graph.hideElement('node1');
// 带动画隐藏元素
await graph.hideElement('node1', true);
// 隐藏多个元素
await graph.hideElement(['node1', 'node2', 'node3'], true);
```
### Graph.translateElementBy(id, offset, animation)
相对平移元素指定距离,支持两种调用方式:
```typescript
// 将元素平移指定距离(相对平移)
translateElement(id: ID, offset: Point, animation?: boolean): Promise<void>;
// 批量将元素平移指定距离(相对平移)
translateElement(offsets: Record<ID, Point>, animation?: boolean): Promise<void>;
```
**参数**:
**单个元素平移**
| 参数 | 描述 | 类型 | 默认值 | 必选 |
| --------- | ----------------------- | ---------------- | ------ | ---- |
| id | 要平移的元素 ID | string | - | ✓ |
| offset | 平移的相对距离 [dx, dy] | [number, number] | - | ✓ |
| animation | 是否启用动画 | boolean | - | |
**批量元素平移**
| 参数 | 描述 | 类型 | 默认值 | 必选 |
| --------- | ---------------------- | ---------------------------- | ------ | ---- |
| offsets | 元素ID到平移距离的映射 | Record<ID, [number, number]> | - | ✓ |
| animation | 是否启用动画 | boolean | - | |
**返回值**:
- **类型**: Promise\<void\>
- **描述**: 返回一个 Promise,平移操作完成后 resolve
**示例**:
```typescript
// 向右平移100像素,向下平移50像素
await graph.translateElementBy('node1', [100, 50]);
// 带动画平移
await graph.translateElementBy('node1', [100, 50], true);
// 对多个节点应用相同的平移
await graph.translateElementBy(
{
node1: [50, 50],
node2: [100, 100],
node3: [150, 150],
},
true,
);
```
### Graph.translateElementTo(id, position, animation)
将元素移动到指定位置,支持两种调用方式:
```typescript
// 将元素移动到指定位置(绝对位置)
translateElementTo(id: ID, position: Point, animation?: boolean): Promise<void>;
// 批量将元素移动到指定位置(绝对位置)
translateElementTo(positions: Record<ID, Point>, animation?: boolean): Promise<void>;
```
**参数**:
**单个元素移动**
| 参数 | 描述 | 类型 | 默认值 | 必选 |
| --------- | ------------------- | ---------------- | ------ | ---- |
| id | 要移动的元素 ID | string | - | ✓ |
| position | 目标绝对位置 [x, y] | [number, number] | - | ✓ |
| animation | 是否启用动画 | boolean | - | |
**批量元素移动**
| 参数 | 描述 | 类型 | 默认值 | 必选 |
| --------- | ---------------------- | -------------------------------- | ------ | ---- |
| positions | 元素ID到目标位置的映射 | Record<string, [number, number]> | - | ✓ |
| animation | 是否启用动画 | boolean | - | |
**返回值**:
- **类型**: Promise\<void\>
- **描述**: 返回一个 Promise,移动操作完成后 resolve
**示例**:
```typescript
// 将节点移动到画布的 (200, 300) 位置
await graph.translateElementTo('node1', [200, 300]);
// 带动画移动
await graph.translateElementTo('node1', [200, 300], true);
// 将一组节点整齐排列
await graph.translateElementTo(
{
node1: [100, 100],
node2: [200, 200],
node3: [300, 100],
},
true,
);
```
### Graph.focusElement(id, animation)
聚焦到指定元素,使元素居中于视口。
```typescript
focusElement(id: ID | ID[], animation?: ViewportAnimationEffectTiming): Promise<void>;
```
**参数**:
| 参数 | 描述 | 类型 | 默认值 | 必选 |
| --------- | ------------------------- | --------------------------------------------------------------- | ------ | ---- |
| id | 要聚焦的一个或多个元素 ID | string \| string[] | - | ✓ |
| animation | 视口动画配置 | [ViewportAnimationEffectTiming](#viewportanimationeffecttiming) | - | |
**返回值**:
- **类型**: Promise\<void\>
- **描述**: 返回一个 Promise,聚焦操作完成后 resolve
**示例**:
```typescript
// 聚焦到单个节点
await graph.focusElement('node1');
// 使用自定义动画配置
await graph.focusElement('node1', {
duration: 800,
easing: 'ease-in-out',
});
// 聚焦到多个节点
await graph.focusElement(['node1', 'node2', 'node3']);
```
## 类型定义
### CollapseExpandNodeOptions
收起或展开元素的配置选项。
```typescript
interface CollapseExpandNodeOptions {
/**
* 是否使用动画
*/
animation?: boolean;
/**
* 保证展开/收起的节点位置不变
*/
align?: boolean;
}
```
### ViewportAnimationEffectTiming
视口动画配置类型。
```typescript
type ViewportAnimationEffectTiming =
| boolean // 是否启用动画
| {
easing?: string; // 缓动函数
duration?: number; // 动画持续时间(ms)
};
```
### AABB
AABB (Axis-Aligned Bounding Box) 是"轴对齐包围盒"的缩写,是计算机图形学中的一个基础概念。
```typescript
interface AABB {
x: number; // 矩形左上角的 x 坐标
y: number; // 矩形左上角的 y 坐标
width: number; // 矩形宽度
height: number; // 矩形高度
}
```
### State
元素状态类型。
```typescript
type State = 'selected' | 'hover' | 'active' | 'inactive' | 'disabled' | string;
```
Api Skill
packages/site/docs/api/event.en.md anthropic-skill ~6,148 tokens---
title: Event Listening
order: 11
---
## Overview of the Event System
G6 provides a powerful event mechanism that allows you to respond to various interactive behaviors occurring in the chart, such as node clicks, edge hovers, canvas drags, etc. Through the event system, you can implement complex interactive logic to enhance user experience.
### Event Categories
Events in G6 can be broadly categorized into the following types:
1. **Element Events**: Events related to nodes, edges, and Combos, such as `node:click`, `edge:mouseenter`
2. **Canvas Events**: Events related to the entire canvas, such as `canvas:drag`, `canvas:wheel`
3. **Lifecycle Events**: Events related to the chart lifecycle, such as `beforerender`, `afterrender`
### Event Naming Convention
G6 events follow the `[object]:[event]` format, for example:
- `node:click` - Node click event
- `edge:mouseenter` - Mouse enters edge event
- `canvas:drag` - Canvas drag event
## Best Practice: Using Constant Enums
G6 provides a complete set of event constant enums, and it is **strongly recommended** to use these constants instead of directly using string event names:
```typescript
import { NodeEvent, EdgeEvent, CanvasEvent, GraphEvent } from '@antv/g6';
// Use constant enums to listen to events
graph.on(NodeEvent.CLICK, handleNodeClick);
graph.on(EdgeEvent.POINTER_OVER, handleEdgeHover);
graph.on(CanvasEvent.DRAG, handleCanvasDrag);
graph.on(GraphEvent.AFTER_RENDER, handleAfterRender);
```
**Advantages**:
- Type safety, avoiding string spelling errors
- Provides intelligent code hints and auto-completion
## API Reference
### Graph.on(eventName, callback, once)
Listen to a specified event and execute a callback function when the event is triggered.
```typescript
on<T extends IEvent = IEvent>(eventName: string, callback: (event: T) => void, once?: boolean): this;
```
#### Parameters
| Parameter | Description | Type | Default | Required |
| --------- | ------------------------------------------------------ | ------------------ | ------- | -------- |
| eventName | Name of the event to listen to | string | - | ✓ |
| callback | Callback function executed when the event is triggered | (event: T) => void | - | ✓ |
| once | Whether to listen only once | boolean | - | |
#### Return Value
- **Type:** this (Graph instance)
- **Description:** Returns the graph instance itself, supporting chain calls
#### Example
```typescript
import { NodeEvent, EdgeEvent, CanvasEvent } from '@antv/g6';
// Listen to node click event
graph.on(NodeEvent.CLICK, (evt) => {
const { target } = evt; // Get the ID of the clicked node
console.log(`Node ${target.id} was clicked`);
// Get node data
const nodeData = graph.getNodeData(target.id);
console.log('Node data:', nodeData);
// Modify node state
graph.setElementState(target.id, 'selected');
});
// Listen to edge mouse enter event
graph.on(EdgeEvent.POINTER_OVER, (evt) => {
const { target } = evt;
graph.setElementState(target.id, 'highlight');
});
// Listen to canvas drag event
graph.on(CanvasEvent.DRAG, (evt) => {
console.log('Canvas is being dragged');
});
```
### Graph.once(eventName, callback)
Listen to an event once, and automatically remove the listener after the event is triggered once.
```typescript
once<T extends IEvent = IEvent>(eventName: string, callback: (event: T) => void): this;
```
#### Parameters
| Parameter | Description | Type | Default | Required |
| --------- | ------------------------------------------------------ | ------------------ | ------- | -------- |
| eventName | Name of the event to listen to | string | - | ✓ |
| callback | Callback function executed when the event is triggered | (event: T) => void | - | ✓ |
#### Return Value
- **Type:** this (Graph instance)
- **Description:** Returns the graph instance itself, supporting chain calls
#### Example
```typescript
import { GraphEvent, NodeEvent } from '@antv/g6';
// Listen to the chart's first load completion event, executed only once
graph.once(GraphEvent.AFTER_RENDER, () => {
console.log('Chart rendered for the first time');
// Execute one-time initialization operations
highlightImportantNodes();
});
// Wait for the user to click a node for the first time and then perform operations
graph.once(NodeEvent.CLICK, (evt) => {
console.log('User clicked a node for the first time:', evt.target.id);
showTutorialTip('You can drag nodes to change their position');
});
```
### Graph.off()
Remove all event listeners.
```typescript
off(): this;
```
#### Return Value
- **Type:** this (Graph instance)
- **Description:** Returns the graph instance itself, supporting chain calls
#### Example
```typescript
// Remove all event listeners
graph.off();
console.log('All event listeners have been removed');
```
### Graph.off(eventName)
Remove all listeners of a specified event type.
```typescript
off(eventName: string): this;
```
#### Parameters
| Parameter | Description | Type | Default | Required |
| --------- | --------------------------- | ------ | ------- | -------- |
| eventName | Name of the event to remove | string | - | ✓ |
#### Return Value
- **Type:** this (Graph instance)
- **Description:** Returns the graph instance itself, supporting chain calls
#### Example
```typescript
import { NodeEvent } from '@antv/g6';
// Remove all node click event listeners
graph.off(NodeEvent.CLICK);
console.log('All node click event listeners have been removed');
// Remove related temporary event listeners after a certain operation mode ends
function exitEditMode() {
// Remove all listeners in edit mode
graph.off(NodeEvent.DRAG_END);
graph.off(NodeEvent.DROP);
console.log('Exited edit mode');
}
```
### Graph.off(eventName, callback)
Remove a specific callback function for a specific event.
```typescript
off(eventName: string, callback: (...args: any[]) => void): this;
```
#### Parameters
| Parameter | Description | Type | Default | Required |
| --------- | --------------------------- | ------------------------ | ------- | -------- |
| eventName | Name of the event to remove | string | - | ✓ |
| callback | Callback function to remove | (...args: any[]) => void | - | ✓ |
#### Return Value
- **Type:** this (Graph instance)
- **Description:** Returns the graph instance itself, supporting chain calls
#### Example
```typescript
import { NodeEvent } from '@antv/g6';
// Define callback function
const handleNodeClick = (evt) => {
console.log('Node clicked:', evt.target.id);
};
// Add listener
graph.on(NodeEvent.CLICK, handleNodeClick);
// Later, remove this specific listener at a certain point
graph.off(NodeEvent.CLICK, handleNodeClick);
console.log('Specific node click event listener has been removed');
```
## Event Constant Enums
G6 provides various event constant enums to facilitate developers in using standardized event names. Below is a detailed description of all event constants:
### Node Events (NodeEvent)
| Constant Name | Event Name | Description |
| ------------- | ------------------- | ----------------------------------------------------------------------------- |
| CLICK | `node:click` | Triggered when a node is clicked |
| DBLCLICK | `node:dblclick` | Triggered when a node is double-clicked |
| POINTER_OVER | `node:pointerover` | Triggered when the pointer enters a node |
| POINTER_LEAVE | `node:pointerleave` | Triggered when the pointer leaves a node |
| POINTER_ENTER | `node:pointerenter` | Triggered when the pointer enters a node or its child elements (non-bubbling) |
| POINTER_MOVE | `node:pointermove` | Triggered when the pointer moves over a node |
| POINTER_OUT | `node:pointerout` | Triggered when the pointer leaves a node |
| POINTER_DOWN | `node:pointerdown` | Triggered when the pointer is pressed down on a node |
| POINTER_UP | `node:pointerup` | Triggered when the pointer is released on a node |
| CONTEXT_MENU | `node:contextmenu` | Triggered when the context menu is opened on a node |
| DRAG_START | `node:dragstart` | Triggered when dragging a node starts |
| DRAG | `node:drag` | Triggered during node dragging |
| DRAG_END | `node:dragend` | Triggered when node dragging ends |
| DRAG_ENTER | `node:dragenter` | Triggered when a draggable item enters a node |
| DRAG_OVER | `node:dragover` | Triggered when a draggable item is over a node |
| DRAG_LEAVE | `node:dragleave` | Triggered when a draggable item leaves a node |
| DROP | `node:drop` | Triggered when a draggable item is dropped on a node |
### Edge Events (EdgeEvent)
| Constant Name | Event Name | Description |
| ------------- | ------------------- | ------------------------------------------------------------------------------ |
| CLICK | `edge:click` | Triggered when an edge is clicked |
| DBLCLICK | `edge:dblclick` | Triggered when an edge is double-clicked |
| POINTER_OVER | `edge:pointerover` | Triggered when the pointer enters an edge |
| POINTER_LEAVE | `edge:pointerleave` | Triggered when the pointer leaves an edge |
| POINTER_ENTER | `edge:pointerenter` | Triggered when the pointer enters an edge or its child elements (non-bubbling) |
| POINTER_MOVE | `edge:pointermove` | Triggered when the pointer moves over an edge |
| POINTER_OUT | `edge:pointerout` | Triggered when the pointer leaves an edge |
| POINTER_DOWN | `edge:pointerdown` | Triggered when the pointer is pressed down on an edge |
| POINTER_UP | `edge:pointerup` | Triggered when the pointer is released on an edge |
| CONTEXT_MENU | `edge:contextmenu` | Triggered when the context menu is opened on an edge |
| DRAG_ENTER | `edge:dragenter` | Triggered when a draggable item enters an edge |
| DRAG_OVER | `edge:dragover` | Triggered when a draggable item is over an edge |
| DRAG_LEAVE | `edge:dragleave` | Triggered when a draggable item leaves an edge |
| DROP | `edge:drop` | Triggered when a draggable item is dropped on an edge |
### Combo Events (ComboEvent)
| Constant Name | Event Name | Description |
| ------------- | -------------------- | ------------------------------------------------------------------------------ |
| CLICK | `combo:click` | Triggered when a Combo is clicked |
| DBLCLICK | `combo:dblclick` | Triggered when a Combo is double-clicked |
| POINTER_OVER | `combo:pointerover` | Triggered when the pointer enters a Combo |
| POINTER_LEAVE | `combo:pointerleave` | Triggered when the pointer leaves a Combo |
| POINTER_ENTER | `combo:pointerenter` | Triggered when the pointer enters a Combo or its child elements (non-bubbling) |
| POINTER_MOVE | `combo:pointermove` | Triggered when the pointer moves over a Combo |
| POINTER_OUT | `combo:pointerout` | Triggered when the pointer leaves a Combo |
| POINTER_DOWN | `combo:pointerdown` | Triggered when the pointer is pressed down on a Combo |
| POINTER_UP | `combo:pointerup` | Triggered when the pointer is released on a Combo |
| CONTEXT_MENU | `combo:contextmenu` | Triggered when the context menu is opened on a Combo |
| DRAG_START | `combo:dragstart` | Triggered when dragging a Combo starts |
| DRAG | `combo:drag` | Triggered during Combo dragging |
| DRAG_END | `combo:dragend` | Triggered when Combo dragging ends |
| DRAG_ENTER | `combo:dragenter` | Triggered when a draggable item enters a Combo |
| DRAG_OVER | `combo:dragover` | Triggered when a draggable item is over a Combo |
| DRAG_LEAVE | `combo:dragleave` | Triggered when a draggable item leaves a Combo |
| DROP | `combo:drop` | Triggered when a draggable item is dropped on a Combo |
### Canvas Events (CanvasEvent)
| Constant Name | Event Name | Description |
| ------------- | --------------------- | --------------------------------------------------------------------------------- |
| CLICK | `canvas:click` | Triggered when clicking on the canvas blank area |
| DBLCLICK | `canvas:dblclick` | Triggered when double-clicking on the canvas blank area |
| POINTER_OVER | `canvas:pointerover` | Triggered when the pointer enters the canvas |
| POINTER_LEAVE | `canvas:pointerleave` | Triggered when the pointer leaves the canvas |
| POINTER_ENTER | `canvas:pointerenter` | Triggered when the pointer enters the canvas or its child elements (non-bubbling) |
| POINTER_MOVE | `canvas:pointermove` | Triggered when the pointer moves over the canvas |
| POINTER_OUT | `canvas:pointerout` | Triggered when the pointer leaves the canvas |
| POINTER_DOWN | `canvas:pointerdown` | Triggered when the pointer is pressed down on the canvas |
| POINTER_UP | `canvas:pointerup` | Triggered when the pointer is released on the canvas |
| CONTEXT_MENU | `canvas:contextmenu` | Triggered when the context menu is opened on the canvas |
| DRAG_START | `canvas:dragstart` | Triggered when dragging the canvas starts |
| DRAG | `canvas:drag` | Triggered during canvas dragging |
| DRAG_END | `canvas:dragend` | Triggered when canvas dragging ends |
| DRAG_ENTER | `canvas:dragenter` | Triggered when a draggable item enters the canvas |
| DRAG_OVER | `canvas:dragover` | Triggered when a draggable item is over the canvas |
| DRAG_LEAVE | `canvas:dragleave` | Triggered when a draggable item leaves the canvas |
| DROP | `canvas:drop` | Triggered when a draggable item is dropped on the canvas |
| WHEEL | `canvas:wheel` | Triggered when scrolling the mouse wheel on the canvas |
### Graph Lifecycle Events (GraphEvent)
| Constant Name | Event Name | Description |
| ------------------------ | ------------------------ | ---------------------------------------------- |
| BEFORE_CANVAS_INIT | `beforecanvasinit` | Triggered before canvas initialization |
| AFTER_CANVAS_INIT | `aftercanvasinit` | Triggered after canvas initialization |
| BEFORE_SIZE_CHANGE | `beforesizechange` | Triggered before viewport size change |
| AFTER_SIZE_CHANGE | `aftersizechange` | Triggered after viewport size change |
| BEFORE_ELEMENT_CREATE | `beforeelementcreate` | Triggered before element creation |
| AFTER_ELEMENT_CREATE | `afterelementcreate` | Triggered after element creation |
| BEFORE_ELEMENT_UPDATE | `beforeelementupdate` | Triggered before element update |
| AFTER_ELEMENT_UPDATE | `afterelementupdate` | Triggered after element update |
| BEFORE_ELEMENT_DESTROY | `beforeelementdestroy` | Triggered before element destruction |
| AFTER_ELEMENT_DESTROY | `afterelementdestroy` | Triggered after element destruction |
| BEFORE_ELEMENT_TRANSLATE | `beforeelementtranslate` | Triggered before element translation |
| AFTER_ELEMENT_TRANSLATE | `afterelementtranslate` | Triggered after element translation |
| BEFORE_DRAW | `beforedraw` | Triggered before drawing starts |
| AFTER_DRAW | `afterdraw` | Triggered after drawing ends |
| BEFORE_RENDER | `beforerender` | Triggered before rendering starts |
| AFTER_RENDER | `afterrender` | Triggered after rendering completes |
| BEFORE_ANIMATE | `beforeanimate` | Triggered before animation starts |
| AFTER_ANIMATE | `afteranimate` | Triggered after animation ends |
| BEFORE_LAYOUT | `beforelayout` | Triggered before layout starts |
| AFTER_LAYOUT | `afterlayout` | Triggered after layout ends |
| BEFORE_STAGE_LAYOUT | `beforestagelayout` | Triggered before each stage in pipeline layout |
| AFTER_STAGE_LAYOUT | `afterstagelayout` | Triggered after each stage in pipeline layout |
| BEFORE_TRANSFORM | `beforetransform` | Triggered before viewport transformation |
| AFTER_TRANSFORM | `aftertransform` | Triggered after viewport transformation |
| BATCH_START | `batchstart` | Triggered when batch operation starts |
| BATCH_END | `batchend` | Triggered when batch operation ends |
| BEFORE_DESTROY | `beforedestroy` | Triggered before chart destruction |
| AFTER_DESTROY | `afterdestroy` | Triggered after chart destruction |
| BEFORE_RENDERER_CHANGE | `beforerendererchange` | Triggered before renderer change |
| AFTER_RENDERER_CHANGE | `afterrendererchange` | Triggered after renderer change |
### Container Events (ContainerEvent)
| Constant Name | Event Name | Description |
| ------------- | ---------- | --------------------------------------------- |
| KEY_DOWN | `keydown` | Triggered when a keyboard key is pressed down |
| KEY_UP | `keyup` | Triggered when a keyboard key is released |
### Common Events (CommonEvent)
These are events without prefixes and can be used to listen to global events:
| Constant Name | Event Name | Description |
| ------------- | -------------- | ---------------------------------------------------------------------------------- |
| CLICK | `click` | Triggered when any element is clicked |
| DBLCLICK | `dblclick` | Triggered when any element is double-clicked |
| POINTER_OVER | `pointerover` | Triggered when the pointer enters any element |
| POINTER_LEAVE | `pointerleave` | Triggered when the pointer leaves any element |
| POINTER_ENTER | `pointerenter` | Triggered when the pointer enters any element or its child elements (non-bubbling) |
| POINTER_MOVE | `pointermove` | Triggered when the pointer moves over any element |
| POINTER_OUT | `pointerout` | Triggered when the pointer leaves any element |
| POINTER_DOWN | `pointerdown` | Triggered when the pointer is pressed down on any element |
| POINTER_UP | `pointerup` | Triggered when the pointer is released on any element |
| CONTEXT_MENU | `contextmenu` | Triggered when the context menu is opened on any element |
| DRAG_START | `dragstart` | Triggered when dragging any element starts |
| DRAG | `drag` | Triggered during any element dragging |
| DRAG_END | `dragend` | Triggered when any element dragging ends |
| DRAG_ENTER | `dragenter` | Triggered when a draggable item enters any element |
| DRAG_OVER | `dragover` | Triggered when a draggable item is over any element |
| DRAG_LEAVE | `dragleave` | Triggered when a draggable item leaves any element |
| DROP | `drop` | Triggered when a draggable item is dropped on any element |
| KEY_DOWN | `keydown` | Triggered when a keyboard key is pressed down |
| KEY_UP | `keyup` | Triggered when a keyboard key is released |
| WHEEL | `wheel` | Triggered when scrolling the mouse wheel |
| PINCH | `pinch` | Triggered when pinching or spreading fingers on a multi-touch screen |
## Tips for Use
### Chain Calls
G6's event API supports chain calls, allowing you to register multiple events consecutively:
```typescript
import { NodeEvent, EdgeEvent, CanvasEvent } from '@antv/g6';
// Use constant enums + chain calls
graph.on(NodeEvent.CLICK, handleNodeClick).on(EdgeEvent.CLICK, handleEdgeClick).on(CanvasEvent.WHEEL, handleCanvasZoom);
```
### Event Delegation
You can use the event bubbling mechanism to listen to all child element events on the parent element:
```typescript
import { CommonEvent } from '@antv/g6';
// Handle all element click events uniformly
graph.on(CommonEvent.CLICK, (evt) => {
const { targetType, target } = evt;
if (targetType === 'node') {
console.log('Clicked on node:', target.id);
} else if (targetType === 'edge') {
console.log('Clicked on edge:', target.id);
} else {
console.log('Clicked on canvas blank area');
}
});
```
### Event Object Properties
Most event callback functions receive an event object containing the following common properties:
- `target` - The element that triggered the event
- `targetType` - The type of the element that triggered the event (node/edge/combo/canvas)
- `originalTarget` - The original graphic that triggered the event
- `currentTarget` - The current object that triggered the event
- `originalEvent` - The original browser event object
With these properties, you can precisely control interactive behavior.
Api Skill
packages/site/docs/api/event.zh.md anthropic-skill ~3,835 tokens---
title: 事件监听
order: 11
---
## 事件系统概述
G6 提供了强大的事件机制,允许你响应图表中发生的各种交互行为。例如节点点击、边悬停、画布拖拽等。通过事件系统,你可以实现复杂的交互逻辑,提升用户体验。
### 事件分类
G6 中的事件大致可分为以下几类:
1. **元素事件**:与节点、边、Combo 相关的事件,如 `node:click`, `edge:mouseenter`
2. **画布事件**:与整个画布相关的事件,如 `canvas:drag`, `canvas:wheel`
3. **生命周期事件**:与图表生命周期相关的事件,如 `beforerender`, `afterrender`
### 事件命名规则
G6 的事件命名遵循 `[对象]:[事件]` 的格式,例如:
- `node:click` - 节点点击事件
- `edge:mouseenter` - 鼠标进入边的事件
- `canvas:drag` - 画布拖拽事件
## 最佳实践:使用常量枚举
G6 提供了完整的事件常量枚举,**强烈建议**使用这些常量而非直接使用字符串事件名:
```typescript
import { NodeEvent, EdgeEvent, CanvasEvent, GraphEvent } from '@antv/g6';
// 使用常量枚举监听事件
graph.on(NodeEvent.CLICK, handleNodeClick);
graph.on(EdgeEvent.POINTER_OVER, handleEdgeHover);
graph.on(CanvasEvent.DRAG, handleCanvasDrag);
graph.on(GraphEvent.AFTER_RENDER, handleAfterRender);
```
**优势**:
- 类型安全,避免字符串拼写错误
- 提供智能代码提示和自动完成
## API 参考
### Graph.on(eventName, callback, once)
监听指定的事件,当事件触发时执行回调函数。
```typescript
on<T extends IEvent = IEvent>(eventName: string, callback: (event: T) => void, once?: boolean): this;
```
#### 参数
| 参数 | 描述 | 类型 | 默认值 | 必选 |
| --------- | ------------------------ | ------------------ | ------ | ---- |
| eventName | 要监听的事件名称 | string | - | ✓ |
| callback | 事件触发时执行的回调函数 | (event: T) => void | - | ✓ |
| once | 是否只监听一次 | boolean | - | |
#### 返回值
- **类型:** this(Graph 实例)
- **描述:** 返回图实例本身,支持链式调用
#### 示例
```typescript
import { NodeEvent, EdgeEvent, CanvasEvent } from '@antv/g6';
// 监听节点点击事件
graph.on(NodeEvent.CLICK, (evt) => {
const { target } = evt; // 获取被点击节点的 ID
console.log(`节点 ${target.id} 被点击了`);
// 获取节点数据
const nodeData = graph.getNodeData(target.id);
console.log('节点数据:', nodeData);
// 修改节点状态
graph.setElementState(target.id, 'selected');
});
// 监听边的鼠标进入事件
graph.on(EdgeEvent.POINTER_OVER, (evt) => {
const { target } = evt;
graph.setElementState(target.id, 'highlight');
});
// 监听画布拖拽事件
graph.on(CanvasEvent.DRAG, (evt) => {
console.log('画布正在被拖拽');
});
```
### Graph.once(eventName, callback)
一次性监听事件,事件触发一次后自动移除监听器。
```typescript
once<T extends IEvent = IEvent>(eventName: string, callback: (event: T) => void): this;
```
#### 参数
| 参数 | 描述 | 类型 | 默认值 | 必选 |
| --------- | ------------------------ | ------------------ | ------ | ---- |
| eventName | 要监听的事件名称 | string | - | ✓ |
| callback | 事件触发时执行的回调函数 | (event: T) => void | - | ✓ |
#### 返回值
- **类型:** this(Graph 实例)
- **描述:** 返回图实例本身,支持链式调用
#### 示例
```typescript
import { GraphEvent, NodeEvent } from '@antv/g6';
// 监听图表首次加载完成事件,仅执行一次
graph.once(GraphEvent.AFTER_RENDER, () => {
console.log('图表首次渲染完成');
// 执行一次性的初始化操作
highlightImportantNodes();
});
// 等待用户第一次点击某个节点后执行操作
graph.once(NodeEvent.CLICK, (evt) => {
console.log('用户首次点击了节点:', evt.target.id);
showTutorialTip('您可以拖拽节点改变位置');
});
```
### Graph.off()
移除全部事件监听器。
```typescript
off(): this;
```
#### 返回值
- **类型:** this(Graph 实例)
- **描述:** 返回图实例本身,支持链式调用
#### 示例
```typescript
// 移除所有事件监听器
graph.off();
console.log('已移除所有事件监听器');
```
### Graph.off(eventName)
移除指定事件类型的所有监听器。
```typescript
off(eventName: string): this;
```
#### 参数
| 参数 | 描述 | 类型 | 默认值 | 必选 |
| --------- | ---------------- | ------ | ------ | ---- |
| eventName | 要移除的事件名称 | string | - | ✓ |
#### 返回值
- **类型:** this(Graph 实例)
- **描述:** 返回图实例本身,支持链式调用
#### 示例
```typescript
import { NodeEvent } from '@antv/g6';
// 移除所有节点点击事件的监听器
graph.off(NodeEvent.CLICK);
console.log('已移除所有节点点击事件监听器');
// 在某个操作模式结束后,移除相关的临时事件监听
function exitEditMode() {
// 移除编辑模式下的所有监听器
graph.off(NodeEvent.DRAG_END);
graph.off(NodeEvent.DROP);
console.log('已退出编辑模式');
}
```
### Graph.off(eventName, callback)
移除特定事件的特定回调函数。
```typescript
off(eventName: string, callback: (...args: any[]) => void): this;
```
#### 参数
| 参数 | 描述 | 类型 | 默认值 | 必选 |
| --------- | ---------------- | ------------------------ | ------ | ---- |
| eventName | 要移除的事件名称 | string | - | ✓ |
| callback | 要移除的回调函数 | (...args: any[]) => void | - | ✓ |
#### 返回值
- **类型:** this(Graph 实例)
- **描述:** 返回图实例本身,支持链式调用
#### 示例
```typescript
import { NodeEvent } from '@antv/g6';
// 定义回调函数
const handleNodeClick = (evt) => {
console.log('节点被点击:', evt.target.id);
};
// 添加监听器
graph.on(NodeEvent.CLICK, handleNodeClick);
// 之后在某个时机移除这个特定的监听器
graph.off(NodeEvent.CLICK, handleNodeClick);
console.log('已移除特定的节点点击事件监听器');
```
## 事件常量枚举
G6 提供了多种事件常量枚举,便于开发者使用规范的事件名称。以下是所有事件常量的详细说明:
### 节点事件 (NodeEvent)
| 常量名 | 事件名 | 描述 |
| ------------- | ------------------- | ------------------------------------ |
| CLICK | `node:click` | 点击节点时触发 |
| DBLCLICK | `node:dblclick` | 双击节点时触发 |
| POINTER_OVER | `node:pointerover` | 指针移入节点时触发 |
| POINTER_LEAVE | `node:pointerleave` | 指针离开节点时触发 |
| POINTER_ENTER | `node:pointerenter` | 指针进入节点或其子元素时触发(不冒泡) |
| POINTER_MOVE | `node:pointermove` | 指针在节点上移动时触发 |
| POINTER_OUT | `node:pointerout` | 指针离开节点时触发 |
| POINTER_DOWN | `node:pointerdown` | 指针在节点上按下时触发 |
| POINTER_UP | `node:pointerup` | 指针在节点上抬起时触发 |
| CONTEXT_MENU | `node:contextmenu` | 节点上打开上下文菜单时触发 |
| DRAG_START | `node:dragstart` | 开始拖拽节点时触发 |
| DRAG | `node:drag` | 拖拽节点过程中触发 |
| DRAG_END | `node:dragend` | 拖拽节点结束时触发 |
| DRAG_ENTER | `node:dragenter` | 拖拽物进入节点时触发 |
| DRAG_OVER | `node:dragover` | 拖拽物在节点上方时触发 |
| DRAG_LEAVE | `node:dragleave` | 拖拽物离开节点时触发 |
| DROP | `node:drop` | 在节点上放置拖拽物时触发 |
### 边事件 (EdgeEvent)
| 常量名 | 事件名 | 描述 |
| ------------- | ------------------- | ---------------------------------- |
| CLICK | `edge:click` | 点击边时触发 |
| DBLCLICK | `edge:dblclick` | 双击边时触发 |
| POINTER_OVER | `edge:pointerover` | 指针移入边时触发 |
| POINTER_LEAVE | `edge:pointerleave` | 指针离开边时触发 |
| POINTER_ENTER | `edge:pointerenter` | 指针进入边或其子元素时触发(不冒泡) |
| POINTER_MOVE | `edge:pointermove` | 指针在边上移动时触发 |
| POINTER_OUT | `edge:pointerout` | 指针离开边时触发 |
| POINTER_DOWN | `edge:pointerdown` | 指针在边上按下时触发 |
| POINTER_UP | `edge:pointerup` | 指针在边上抬起时触发 |
| CONTEXT_MENU | `edge:contextmenu` | 边上打开上下文菜单时触发 |
| DRAG_ENTER | `edge:dragenter` | 拖拽物进入边时触发 |
| DRAG_OVER | `edge:dragover` | 拖拽物在边上方时触发 |
| DRAG_LEAVE | `edge:dragleave` | 拖拽物离开边时触发 |
| DROP | `edge:drop` | 在边上放置拖拽物时触发 |
### Combo事件 (ComboEvent)
| 常量名 | 事件名 | 描述 |
| ------------- | -------------------- | ------------------------------------- |
| CLICK | `combo:click` | 点击Combo时触发 |
| DBLCLICK | `combo:dblclick` | 双击Combo时触发 |
| POINTER_OVER | `combo:pointerover` | 指针移入Combo时触发 |
| POINTER_LEAVE | `combo:pointerleave` | 指针离开Combo时触发 |
| POINTER_ENTER | `combo:pointerenter` | 指针进入Combo或其子元素时触发(不冒泡) |
| POINTER_MOVE | `combo:pointermove` | 指针在Combo上移动时触发 |
| POINTER_OUT | `combo:pointerout` | 指针离开Combo时触发 |
| POINTER_DOWN | `combo:pointerdown` | 指针在Combo上按下时触发 |
| POINTER_UP | `combo:pointerup` | 指针在Combo上抬起时触发 |
| CONTEXT_MENU | `combo:contextmenu` | Combo上打开上下文菜单时触发 |
| DRAG_START | `combo:dragstart` | 开始拖拽Combo时触发 |
| DRAG | `combo:drag` | 拖拽Combo过程中触发 |
| DRAG_END | `combo:dragend` | 拖拽Combo结束时触发 |
| DRAG_ENTER | `combo:dragenter` | 拖拽物进入Combo时触发 |
| DRAG_OVER | `combo:dragover` | 拖拽物在Combo上方时触发 |
| DRAG_LEAVE | `combo:dragleave` | 拖拽物离开Combo时触发 |
| DROP | `combo:drop` | 在Combo上放置拖拽物时触发 |
### 画布事件 (CanvasEvent)
| 常量名 | 事件名 | 描述 |
| ------------- | --------------------- | ------------------------------------ |
| CLICK | `canvas:click` | 点击画布空白处时触发 |
| DBLCLICK | `canvas:dblclick` | 双击画布空白处时触发 |
| POINTER_OVER | `canvas:pointerover` | 指针移入画布时触发 |
| POINTER_LEAVE | `canvas:pointerleave` | 指针离开画布时触发 |
| POINTER_ENTER | `canvas:pointerenter` | 指针进入画布或其子元素时触发(不冒泡) |
| POINTER_MOVE | `canvas:pointermove` | 指针在画布上移动时触发 |
| POINTER_OUT | `canvas:pointerout` | 指针离开画布时触发 |
| POINTER_DOWN | `canvas:pointerdown` | 指针在画布上按下时触发 |
| POINTER_UP | `canvas:pointerup` | 指针在画布上抬起时触发 |
| CONTEXT_MENU | `canvas:contextmenu` | 画布上打开上下文菜单时触发 |
| DRAG_START | `canvas:dragstart` | 开始拖拽画布时触发 |
| DRAG | `canvas:drag` | 拖拽画布过程中触发 |
| DRAG_END | `canvas:dragend` | 拖拽画布结束时触发 |
| DRAG_ENTER | `canvas:dragenter` | 拖拽物进入画布时触发 |
| DRAG_OVER | `canvas:dragover` | 拖拽物在画布上方时触发 |
| DRAG_LEAVE | `canvas:dragleave` | 拖拽物离开画布时触发 |
| DROP | `canvas:drop` | 在画布上放置拖拽物时触发 |
| WHEEL | `canvas:wheel` | 在画布上滚动鼠标滚轮时触发 |
### 图表生命周期事件 (GraphEvent)
| 常量名 | 事件名 | 描述 |
| ------------------------ | ------------------------ | ---------------------------------- |
| BEFORE_CANVAS_INIT | `beforecanvasinit` | 画布初始化之前触发 |
| AFTER_CANVAS_INIT | `aftercanvasinit` | 画布初始化之后触发 |
| BEFORE_SIZE_CHANGE | `beforesizechange` | 视口尺寸变更之前触发 |
| AFTER_SIZE_CHANGE | `aftersizechange` | 视口尺寸变更之后触发 |
| BEFORE_ELEMENT_CREATE | `beforeelementcreate` | 元素创建之前触发 |
| AFTER_ELEMENT_CREATE | `afterelementcreate` | 元素创建之后触发 |
| BEFORE_ELEMENT_UPDATE | `beforeelementupdate` | 元素更新之前触发 |
| AFTER_ELEMENT_UPDATE | `afterelementupdate` | 元素更新之后触发 |
| BEFORE_ELEMENT_DESTROY | `beforeelementdestroy` | 元素销毁之前触发 |
| AFTER_ELEMENT_DESTROY | `afterelementdestroy` | 元素销毁之后触发 |
| BEFORE_ELEMENT_TRANSLATE | `beforeelementtranslate` | 元素平移之前触发 |
| AFTER_ELEMENT_TRANSLATE | `afterelementtranslate` | 元素平移之后触发 |
| BEFORE_DRAW | `beforedraw` | 绘制开始之前触发 |
| AFTER_DRAW | `afterdraw` | 绘制结束之后触发 |
| BEFORE_RENDER | `beforerender` | 渲染开始之前触发 |
| AFTER_RENDER | `afterrender` | 渲染完成之后触发 |
| BEFORE_ANIMATE | `beforeanimate` | 动画开始之前触发 |
| AFTER_ANIMATE | `afteranimate` | 动画结束之后触发 |
| BEFORE_LAYOUT | `beforelayout` | 布局开始之前触发 |
| AFTER_LAYOUT | `afterlayout` | 布局结束之后触发 |
| BEFORE_STAGE_LAYOUT | `beforestagelayout` | 流水线布局过程中每个阶段开始前触发 |
| AFTER_STAGE_LAYOUT | `afterstagelayout` | 流水线布局过程中每个阶段结束后触发 |
| BEFORE_TRANSFORM | `beforetransform` | 可视区域变化之前触发 |
| AFTER_TRANSFORM | `aftertransform` | 可视区域变化之后触发 |
| BATCH_START | `batchstart` | 批处理操作开始时触发 |
| BATCH_END | `batchend` | 批处理操作结束时触发 |
| BEFORE_DESTROY | `beforedestroy` | 图表销毁前触发 |
| AFTER_DESTROY | `afterdestroy` | 图表销毁后触发 |
| BEFORE_RENDERER_CHANGE | `beforerendererchange` | 渲染器变更之前触发 |
| AFTER_RENDERER_CHANGE | `afterrendererchange` | 渲染器变更之后触发 |
### 容器事件 (ContainerEvent)
| 常量名 | 事件名 | 描述 |
| -------- | --------- | ------------------ |
| KEY_DOWN | `keydown` | 键盘按键按下时触发 |
| KEY_UP | `keyup` | 键盘按键抬起时触发 |
### 通用事件 (CommonEvent)
这些是不带前缀的事件,可用于监听全局事件:
| 常量名 | 事件名 | 描述 |
| ------------- | -------------- | ---------------------------------------- |
| CLICK | `click` | 点击任何元素时触发 |
| DBLCLICK | `dblclick` | 双击任何元素时触发 |
| POINTER_OVER | `pointerover` | 指针移入任何元素时触发 |
| POINTER_LEAVE | `pointerleave` | 指针离开任何元素时触发 |
| POINTER_ENTER | `pointerenter` | 指针进入任何元素或其子元素时触发(不冒泡) |
| POINTER_MOVE | `pointermove` | 指针在任何元素上移动时触发 |
| POINTER_OUT | `pointerout` | 指针离开任何元素时触发 |
| POINTER_DOWN | `pointerdown` | 指针在任何元素上按下时触发 |
| POINTER_UP | `pointerup` | 指针在任何元素上抬起时触发 |
| CONTEXT_MENU | `contextmenu` | 任何元素上打开上下文菜单时触发 |
| DRAG_START | `dragstart` | 开始拖拽任何元素时触发 |
| DRAG | `drag` | 拖拽任何元素过程中触发 |
| DRAG_END | `dragend` | 拖拽任何元素结束时触发 |
| DRAG_ENTER | `dragenter` | 拖拽物进入任何元素时触发 |
| DRAG_OVER | `dragover` | 拖拽物在任何元素上方时触发 |
| DRAG_LEAVE | `dragleave` | 拖拽物离开任何元素时触发 |
| DROP | `drop` | 在任何元素上放置拖拽物时触发 |
| KEY_DOWN | `keydown` | 键盘按键按下时触发 |
| KEY_UP | `keyup` | 键盘按键抬起时触发 |
| WHEEL | `wheel` | 滚动鼠标滚轮时触发 |
| PINCH | `pinch` | 多点触控屏幕上双指捏合或张开时触发 |
## 使用技巧
### 链式调用
G6 的事件 API 支持链式调用,可以连续注册多个事件:
```typescript
import { NodeEvent, EdgeEvent, CanvasEvent } from '@antv/g6';
// 使用常量枚举+链式调用
graph.on(NodeEvent.CLICK, handleNodeClick).on(EdgeEvent.CLICK, handleEdgeClick).on(CanvasEvent.WHEEL, handleCanvasZoom);
```
### 事件代理
你可以利用事件冒泡机制,在父元素上监听所有子元素的事件:
```typescript
import { CommonEvent } from '@antv/g6';
// 统一处理所有元素的点击事件
graph.on(CommonEvent.CLICK, (evt) => {
const { targetType, target } = evt;
if (targetType === 'node') {
console.log('点击了节点:', target.id);
} else if (targetType === 'edge') {
console.log('点击了边:', target.id);
} else {
console.log('点击了画布空白处');
}
});
```
### 事件对象属性
大多数事件的回调函数会接收一个事件对象,包含以下常用属性:
- `target` - 触发事件的元素
- `targetType` - 触发事件的元素类型(node/edge/combo/canvas)
- `originalTarget` - 原始的触发事件的图形
- `currentTarget` - 当前触发事件的对象
- `originalEvent` - 原始的浏览器事件对象
通过这些属性,你可以精确地控制交互行为。
Api Skill
packages/site/docs/api/export-image.en.md anthropic-skill ~737 tokens---
title: Export Image
order: 12
---
## Overview of Image Export
G6 provides the functionality to export the graph as an image, allowing you to export the current canvas content as a DataURL format. This is convenient for saving, sharing, or further processing. The exported image will retain all visible elements on the canvas, including nodes, edges, combos, and other custom graphics.
## API Reference
### Graph.toDataURL(options)
Export the current canvas as an image in DataURL format.
```typescript
toDataURL(options?: Partial<DataURLOptions>): Promise<string>;
```
**Parameters**
| Parameter | Description | Type | Default | Required |
| --------- | -------------------------- | ------------------------- | ------- | -------- |
| options | Export image configuration | Partial\<DataURLOptions\> | - | |
**Return Value**
Returns a Promise that resolves to a DataURL string representing the image.
**DataURLOptions Type Definition**
| Parameter | Type | Required | Description |
| -------------- | ------------------------------------------- | -------- | -------------------------------------------------------------------------------------------------------- |
| mode | 'viewport' \| 'overall' | No | Export mode <br/> - viewport: Export viewport content <br/> - overall: Export entire canvas |
| type | 'image/png' \| 'image/jpeg' \| 'image/webp' | No | Image type <br/> - image/png: PNG format <br/> - image/jpeg: JPEG format <br/> - image/webp: WebP format |
| encoderOptions | number | No | Image quality, only effective for image/jpeg and image/webp, range 0 ~ 1 |
## Download Image
G6 5.0 only provides an API to export the canvas as a Base64 image ([toDataURL](#graphtodataurloptions)). If you need to download the image, you can use the following method:
```typescript
async function downloadImage() {
const dataURL = await graph.toDataURL();
const [head, content] = dataURL.split(',');
const contentType = head.match(/:(.*?);/)![1];
const bstr = atob(content);
let length = bstr.length;
const u8arr = new Uint8Array(length);
while (length--) {
u8arr[length] = bstr.charCodeAt(length);
}
const blob = new Blob([u8arr], { type: contentType });
const url = URL.createObjectURL(blob);
const a = document.createElement('a');
a.href = url;
a.download = 'graph.png';
a.click();
}
```
<br />
:::warning{title=Note}
The exported image content may not include the complete canvas content. The export range only includes the content within the Graph canvas. Some plugins use custom containers, canvases, etc., which will not appear in the exported image.
:::
Api Skill
packages/site/docs/api/export-image.zh.md anthropic-skill ~533 tokens---
title: 导出图片
order: 12
---
## 图片导出概述
G6 提供了将图导出为图片的功能,可以将当前画布内容导出为 DataURL 格式,方便保存、分享或进一步处理。导出的图片会保留画布上的所有可见元素,包括节点、边、组合以及其他自定义图形。
## API 参考
### Graph.toDataURL(options)
将当前画布导出为 DataURL 格式的图片。
```typescript
toDataURL(options?: Partial<DataURLOptions>): Promise<string>;
```
**参数**
| 参数 | 描述 | 类型 | 默认值 | 必选 |
| ------- | ------------ | ------------------------- | ------ | ---- |
| options | 导出图片配置 | Partial\<DataURLOptions\> | - | |
**返回值**
返回一个 Promise,解析为表示图片的 DataURL 字符串。
**DataURLOptions 类型定义**
| 参数 | 类型 | 必选 | 描述 |
| -------------- | ------------------------------------------- | ---- | ------------------------------------------------------------------------------------------------ |
| mode | 'viewport' \| 'overall' | 否 | 导出模式 <br/> - viewport: 导出视口内容 <br/> - overall: 导出整个画布 |
| type | 'image/png' \| 'image/jpeg' \| 'image/webp' | 否 | 图片类型 <br/> - image/png: PNG 格式 <br/> - image/jpeg: JPEG 格式 <br/> - image/webp: WebP 格式 |
| encoderOptions | number | 否 | 图片质量,仅对 image/jpeg 和 image/webp 有效,取值范围 0 ~ 1 |
## 下载图片
G6 5.0 仅提供导出画布为 Base64 图片的 API([toDataURL](#graphtodataurloptions)),如果需要下载图片,可以使用以下方法:
```typescript
async function downloadImage() {
const dataURL = await graph.toDataURL();
const [head, content] = dataURL.split(',');
const contentType = head.match(/:(.*?);/)![1];
const bstr = atob(content);
let length = bstr.length;
const u8arr = new Uint8Array(length);
while (length--) {
u8arr[length] = bstr.charCodeAt(length);
}
const blob = new Blob([u8arr], { type: contentType });
const url = URL.createObjectURL(blob);
const a = document.createElement('a');
a.href = url;
a.download = 'graph.png';
a.click();
}
```
<br />
:::warning{title=注意}
导出的图片内容可能不会包含完整的画布内容,导出范围仅包含 Graph 画布中的内容。部分插件使用了自定义的容器、画布等,这部分内容不会出现在导出的图片中。
:::
Api Skill
packages/site/docs/api/graph.en.md anthropic-skill ~142 tokens---
title: Graph Instance
order: 2
---
## API Reference
### Graph.destroy()
Destroy the current graph instance and release all resources related to it.
⚠️ **Note**: After destruction, no operations can be performed. If you need to use it again, you must create a new graph instance.
```typescript
destroy(): void;
```
**Usage Scenarios**:
- When the user closes the chart or switches to another view, this method can be called to release resources.
- When needing to recreate a graph instance, ensure the old instance is destroyed first to avoid memory leaks.
Api Skill
packages/site/docs/api/graph.zh.md anthropic-skill ~62 tokens---
title: 图实例
order: 2
---
## API 参考
### Graph.destroy()
销毁当前图实例,释放与图实例相关的所有资源。
⚠️ **注意**: 销毁后无法进行任何操作,如果需要重新使用,需要重新创建一个新的图实例。
```typescript
destroy(): void;
```
**使用场景**:
- 当用户关闭图表或切换到其他视图时,可以调用此方法来释放资源。
- 在需要重新创建图实例时,确保先销毁旧的实例,以避免内存泄漏。
Api Skill
packages/site/docs/api/layout.en.md anthropic-skill ~1,852 tokens---
title: Layout
order: 6
---
## Overview of Layout
[Layout](/en/manual/layout/overview) is a crucial part of graph visualization, determining the positioning of nodes on the canvas. G6 offers a variety of layout algorithms to meet different data structures and visualization needs. Through the layout API, you can:
- Set and update the graph's layout configuration
- Execute or stop layout calculations
- Combine multiple layout strategies
- Customize layout algorithms
A suitable layout can clearly display the relationship patterns between nodes, enhancing the graph's readability and aesthetics.
## API Reference
### Graph.setLayout(layout)
Set the graph's layout algorithm and configuration.
⚠️ **Note**: Calling this function won't automatically re-layout, so there's need to call `graph.layout()` separately.
```typescript
setLayout(layout: LayoutOptions | ((prev: LayoutOptions) => LayoutOptions)): void;
```
**Parameters**
| Parameter | Description | Type | Default | Required |
| --------- | -------------------------------------------------------------------------------------------------- | --------------------------------------------------------------------------- | ------- | -------- |
| layout | Layout configuration object, or a function returning a new configuration based on the previous one | [LayoutOptions](#layoutoptions) \| ((prev: LayoutOptions) => LayoutOptions) | - | ✓ |
**Example 1**: Set a force-directed layout
```typescript
// Set a simple force-directed layout
graph.setLayout({
type: 'force',
preventOverlap: true, // Prevent node overlap
nodeStrength: -50, // Repulsion between nodes, negative value for repulsion
edgeStrength: 0.5, // Edge strength, affects edge length
});
```
**Example 2**: Update layout using a function
```typescript
// Update based on the current layout configuration
graph.setLayout((prevLayout) => {
// If the previous layout was force-directed, adjust its parameters
if (prevLayout.type === 'force') {
return {
...prevLayout,
preventOverlap: true,
nodeStrength: -100, // Increase repulsion
alphaDecay: 0.01, // Lower decay rate for more iteration time
};
}
// Otherwise, switch to radial layout
return {
type: 'radial',
unitRadius: 100,
preventOverlap: true,
};
});
```
**Example 3**: Set a combined layout
```typescript
// Set a combined layout - different nodes use different layout algorithms
graph.setLayout([
{
type: 'grid',
// Filter function: only nodes with type 'main' participate in the layout
nodeFilter: (node) => node.data.type === 'main',
rows: 1,
},
{
type: 'circle',
nodeFilter: (node) => node.data.type === 'sub',
radius: 100,
},
]);
```
### Graph.getLayout()
Get the current layout configuration.
```typescript
getLayout(): LayoutOptions;
```
**Return Value**
- **Type**: [LayoutOptions](#layoutoptions)
- **Description**: The current layout configuration object
**Example**
```typescript
// Get the current layout configuration
const currentLayout = graph.getLayout();
console.log('Current layout type:', currentLayout.type);
```
### Graph.layout(layoutOptions)
Execute layout calculations. When graph data changes, call this method to trigger the layout algorithm to recalculate node positions.
```typescript
layout(layoutOptions?: LayoutOptions): Promise<void>;
```
**Parameters**
| Parameter | Description | Type | Default | Required |
| ------------- | --------------------------- | --------------------------------------------------------------------------- | ------- | -------- |
| layoutOptions | Layout configuration object | [LayoutOptions](#layoutoptions) \| ((prev: LayoutOptions) => LayoutOptions) | - | |
If `layoutOptions` is provided, it takes precedence over the graph's current layout configuration.
**Note**
Layout calculation is an asynchronous process, especially for complex layout algorithms like force-directed layout. This method returns a Promise, which can be used to perform subsequent operations after the layout is complete.
**Example 1**: Basic usage
```typescript
// Execute layout
await graph.layout();
console.log('Layout calculation complete');
```
**Example 2**: Re-layout after adding data
```typescript
// Add new nodes and edges
graph.addData({
nodes: [{ id: 'newNode1' }, { id: 'newNode2' }],
edges: [{ id: 'newEdge', source: 'existingNode', target: 'newNode1' }],
});
// Draw new nodes and edges
await graph.draw();
// Recalculate layout
await graph.layout();
```
**Example 3**: Listen to layout events
```typescript
import { GraphEvent } from '@antv/g6';
// Before layout starts
graph.on(GraphEvent.BEFORE_LAYOUT, () => {
console.log('Layout calculation starting...');
});
// After layout completes
graph.on(GraphEvent.AFTER_LAYOUT, () => {
console.log('Layout calculation complete');
});
// Execute layout
graph.layout();
```
### Graph.stopLayout()
Stop an ongoing layout calculation. Mainly used to stop iterative layout algorithms like force-directed layout.
```typescript
stopLayout(): void;
```
**Note**
Applicable to layouts with iterative animations, currently `force` belongs to this category. If the layout calculation takes too long, you can manually stop the iteration.
**Example 1**: Basic usage
```typescript
// Stop layout after 5 seconds
setTimeout(() => {
graph.stopLayout();
console.log('Layout manually stopped');
}, 5000);
```
**Example 2**: Stop layout with user interaction
```typescript
// Stop layout when the user clicks the canvas
import { CanvasEvent } from '@antv/g6';
graph.on(CanvasEvent.CLICK, () => {
graph.stopLayout();
console.log('User clicked canvas, layout stopped');
});
```
## Type Definitions
### LayoutOptions
Layout configuration type, can be a single layout configuration or an array of layout configurations.
```typescript
type LayoutOptions = SingleLayoutOptions | SingleLayoutOptions[];
```
### SingleLayoutOptions
Single layout configuration, can be a built-in layout configuration or a custom base layout configuration.
```typescript
type SingleLayoutOptions = BuiltInLayoutOptions | BaseLayoutOptions;
```
### BaseLayoutOptions
Basic configuration items common to all layout types.
```typescript
interface BaseLayoutOptions {
// Layout type
type: string;
// Node filter function for participating in the layout
nodeFilter?: (node: NodeData) => boolean;
// Whether to calculate the layout before initializing elements
preLayout?: boolean;
// Whether invisible nodes participate in the layout (effective when preLayout is true)
isLayoutInvisibleNodes?: boolean;
// Enable layout animation, for iterative layouts, animation transitions occur between iterations
animation?: boolean;
// Whether to run the layout in a WebWorker
enableWorker?: boolean;
// Number of iterations for iterative layouts
iterations?: number;
// Other specific layout configuration items
[key: string]: any;
}
```
### BuiltInLayoutOptions
Configuration for G6's built-in layout types, see [API - Built-in Layouts](/en/manual/layout/antv-dagre-layout) for details.
Api Skill
packages/site/docs/api/layout.zh.md anthropic-skill ~1,168 tokens---
title: 布局
order: 6
---
## 布局概述
[布局](/manual/layout/overview) 是图可视化中至关重要的一环,它决定了节点在画布上的位置排布。G6 提供了多种布局算法,以满足不同数据结构和可视化需求。通过布局 API,你可以:
- 设置和更新图的布局配置
- 执行或停止布局计算
- 组合多种布局策略
- 自定义布局算法
合适的布局可以清晰地展示节点间的关系模式,提高图的可读性和美观度。
## API 参考
### Graph.setLayout(layout)
设置图的布局算法及配置。
⚠️ **注意**: 调用此函数不会自动重新布局,需要单独调用 `graph.layout()`。
```typescript
setLayout(layout: LayoutOptions | ((prev: LayoutOptions) => LayoutOptions)): void;
```
**参数**
| 参数 | 描述 | 类型 | 默认值 | 必选 |
| ------ | -------------------------------------------------- | --------------------------------------------------------------------------- | ------ | ---- |
| layout | 布局配置对象,或者一个基于之前配置返回新配置的函数 | [LayoutOptions](#layoutoptions) \| ((prev: LayoutOptions) => LayoutOptions) | - | ✓ |
**示例 1**: 设置力导向布局
```typescript
// 设置简单的力导向布局
graph.setLayout({
type: 'force',
preventOverlap: true, // 防止节点重叠
nodeStrength: -50, // 节点间斥力,负值为斥力
edgeStrength: 0.5, // 边的强度,会影响边的长度
});
```
**示例 2**: 使用函数式更新布局
```typescript
// 基于当前布局配置进行更新
graph.setLayout((prevLayout) => {
// 如果之前是力导向布局,调整其参数
if (prevLayout.type === 'force') {
return {
...prevLayout,
preventOverlap: true,
nodeStrength: -100, // 增加斥力
alphaDecay: 0.01, // 降低衰减率,让布局有更多迭代时间
};
}
// 否则切换到放射状布局
return {
type: 'radial',
unitRadius: 100,
preventOverlap: true,
};
});
```
**示例 3**: 设置组合布局
```typescript
// 设置组合布局 - 不同的节点使用不同的布局算法
graph.setLayout([
{
type: 'grid',
// 过滤函数:只有type为'main'的节点参与布局
nodeFilter: (node) => node.data.type === 'main',
rows: 1,
},
{
type: 'circle',
nodeFilter: (node) => node.data.type === 'sub',
radius: 100,
},
]);
```
### Graph.getLayout()
获取当前的布局配置。
```typescript
getLayout(): LayoutOptions;
```
**返回值**
- **类型**: [LayoutOptions](#layoutoptions)
- **描述**: 当前的布局配置对象
**示例**
```typescript
// 获取当前布局配置
const currentLayout = graph.getLayout();
console.log('当前布局类型:', currentLayout.type);
```
### Graph.layout(layoutOptions)
执行布局计算。当图数据发生变化后,调用此方法可触发布局算法重新计算节点位置。
```typescript
layout(layoutOptions?: LayoutOptions): Promise<void>;
```
**参数**
| 参数 | 描述 | 类型 | 默认值 | 必选 |
| ------------- | ------------ | --------------------------------------------------------------------------- | ------ | ---- |
| layoutOptions | 布局配置对象 | [LayoutOptions](#layoutoptions) \| ((prev: LayoutOptions) => LayoutOptions) | - | |
如果传入 `layoutOptions`,则优先考虑传入的布局配置,否则使用图的当前布局配置进行布局。
**说明**
布局计算是一个异步过程,特别是对于复杂的布局算法(如力导向布局)。此方法返回一个 Promise,可以用于在布局完成后执行后续操作。
**示例 1**: 基础用法
```typescript
// 执行布局
await graph.layout();
console.log('布局计算完成');
```
**示例 2**: 添加数据后重新布局
```typescript
// 添加新节点和边
graph.addData({
nodes: [{ id: 'newNode1' }, { id: 'newNode2' }],
edges: [{ id: 'newEdge', source: 'existingNode', target: 'newNode1' }],
});
// 绘制新节点和边
await graph.draw();
// 重新计算布局
await graph.layout();
```
**示例 3**: 监听布局事件
```typescript
import { GraphEvent } from '@antv/g6';
// 布局开始前
graph.on(GraphEvent.BEFORE_LAYOUT, () => {
console.log('布局计算开始...');
});
// 布局完成后
graph.on(GraphEvent.AFTER_LAYOUT, () => {
console.log('布局计算完成');
});
// 执行布局
graph.layout();
```
### Graph.stopLayout()
停止正在进行中的布局计算。主要用于停止迭代类型的布局算法,如力导向布局。
```typescript
stopLayout(): void;
```
**说明**
适用于带有迭代动画的布局,目前有 `force` 属于此类布局。当布局计算时间过长时,可以手动停止迭代。
**示例 1**: 基本使用
```typescript
// 5秒后停止布局
setTimeout(() => {
graph.stopLayout();
console.log('布局已手动停止');
}, 5000);
```
**示例 2**: 结合用户交互停止布局
```typescript
// 当用户点击画布时停止布局
import { CanvasEvent } from '@antv/g6';
graph.on(CanvasEvent.CLICK, () => {
graph.stopLayout();
console.log('用户点击画布,布局已停止');
});
```
## 类型定义
### LayoutOptions
布局配置类型,可以是单一布局配置或布局配置数组。
```typescript
type LayoutOptions = SingleLayoutOptions | SingleLayoutOptions[];
```
### SingleLayoutOptions
单一布局配置,可以是内置布局配置或自定义基础布局配置。
```typescript
type SingleLayoutOptions = BuiltInLayoutOptions | BaseLayoutOptions;
```
### BaseLayoutOptions
所有布局类型共有的基础配置项。
```typescript
interface BaseLayoutOptions {
// 布局类型
type: string;
// 参与该布局的节点过滤函数
nodeFilter?: (node: NodeData) => boolean;
// 是否在初始化元素前计算布局
preLayout?: boolean;
// 不可见节点是否参与布局(当 preLayout 为 true 时生效)
isLayoutInvisibleNodes?: boolean;
// 启用布局动画,对于迭代布局,会在两次迭代之间进行动画过渡
animation?: boolean;
// 是否在 WebWorker 中运行布局
enableWorker?: boolean;
// 迭代布局的迭代次数
iterations?: number;
// 其他特定布局的配置项
[key: string]: any;
}
```
### BuiltInLayoutOptions
G6 内置的布局类型配置,具体请查看 [API - 内置布局](/manual/layout/antv-dagre-layout)。
Api Skill
packages/site/docs/api/option.en.md anthropic-skill ~883 tokens---
title: Graph Options
order: 7
---
## Overview of Graph Options
The [options](/en/manual/graph/option) of a G6 graph instance control various aspects of the graph, including canvas settings, viewport properties, data, layout, styles, interaction behaviors, plugins, and more. By configuring these options appropriately, you can flexibly customize the appearance and behavior of the graph.
Options can be specified when creating a graph instance or dynamically modified at runtime through the API. Some basic configurations (such as devicePixelRatio, container) require destroying and recreating the graph instance to take effect after modification.
## API Reference
### Graph.getOptions()
Retrieve all configuration options of the current graph.
```typescript
getOptions(): GraphOptions;
```
**Return Value**
- **Type**: [GraphOptions](/en/manual/graph/option)
- **Description**: Complete configuration options of the current graph
**Example**
```typescript
// Retrieve the current graph's options
const options = graph.getOptions();
console.log('Current graph options:', options);
// Retrieve specific options
console.log('Current canvas width:', options.width);
console.log('Current layout options:', options.layout);
```
### Graph.setOptions(options)
Update the graph's configuration options.
```typescript
setOptions(options: GraphOptions): void;
```
**Parameters**
| Parameter | Description | Type | Default | Required |
| --------- | ------------------------- | --------------------------------------- | ------- | -------- |
| options | New configuration options | [GraphOptions](/en/manual/graph/option) | - | ✓ |
**Note**
⚠️ **Attention**: To update basic properties like devicePixelRatio, container, etc., you need to destroy the current graph instance and recreate it. Most other configurations can be dynamically updated.
**Example 1**: Basic Usage
```typescript
// Update graph configuration
graph.setOptions({
width: 1000, // Update width
height: 800, // Update height
autoFit: 'view', // Enable auto-fit
animation: true, // Enable animation
});
```
**Example 2**: Update Theme
```typescript
// Update graph theme configuration
graph.setOptions({
theme: {
type: 'dark', // Switch to dark theme
// Custom theme configuration
node: {
palette: ['#1AAF8B', '#F8E71C', '#8B572A', '#7ED321'],
},
edge: {
palette: ['#F5A623', '#F8E71C', '#8B572A', '#7ED321'],
},
},
});
```
**Example 3**: Update Layout Configuration
```typescript
// Update layout configuration
graph.setOptions({
layout: {
type: 'force', // Switch to force-directed layout
preventOverlap: true,
nodeStrength: -50,
edgeStrength: 0.7,
},
});
```
**Example 4**: Update Default Node and Edge Configuration
```typescript
// Update default style configuration for nodes and edges
graph.setOptions({
node: {
style: {
fill: '#91d5ff',
stroke: '#40a9ff',
lineWidth: 1,
radius: 10,
},
},
edge: {
style: {
stroke: '#91d5ff',
lineWidth: 2,
endArrow: true,
},
},
});
```
## Type Definitions
### GraphOptions
```typescript
type GraphOptions = {
// Whether to enable zooming
enableZoom?: boolean;
// Whether to enable dragging
enableDrag?: boolean;
// Default style for nodes
defaultNodeStyle?: {
fill: string;
stroke: string;
};
// Additional configuration options for the graph
[configKey: string]: any;
};
```
Api Skill
packages/site/docs/api/option.zh.md anthropic-skill ~497 tokens---
title: 图配置项
order: 7
---
## 图配置项概述
G6 图实例的 [配置项](/manual/graph/option) 控制着图的各个方面,包括画布设置、视口属性、数据、布局、样式、交互行为、插件等。通过合理配置这些选项,可以灵活定制图的外观和行为。
配置项可以在图实例创建时指定,也可以通过 API 在运行时动态修改。某些基础配置(如 devicePixelRatio、container)修改后需要销毁并重新创建图实例才能生效。
## API 参考
### Graph.getOptions()
获取当前图表的所有配置项。
```typescript
getOptions(): GraphOptions;
```
**返回值**
- **类型**: [GraphOptions](/manual/graph/option)
- **描述**: 当前图表的完整配置项
**示例**
```typescript
// 获取当前图表的配置项
const options = graph.getOptions();
console.log('当前图表配置:', options);
// 获取特定配置
console.log('当前画布宽度:', options.width);
console.log('当前布局配置:', options.layout);
```
### Graph.setOptions(options)
更新图表的配置项。
```typescript
setOptions(options: GraphOptions): void;
```
**参数**
| 参数 | 描述 | 类型 | 默认值 | 必选 |
| ------- | ---------- | ------------------------------------ | ------ | ---- |
| options | 新的配置项 | [GraphOptions](/manual/graph/option) | - | ✓ |
**说明**
⚠️ **注意**: 要更新 devicePixelRatio、container 等基础属性,需要销毁当前图实例后重新创建。其他大部分配置可以动态更新。
**示例 1**: 基本用法
```typescript
// 更新图表配置
graph.setOptions({
width: 1000, // 更新宽度
height: 800, // 更新高度
autoFit: 'view', // 开启自适应
animation: true, // 启用动画
});
```
**示例 2**: 更新主题
```typescript
// 更新图表主题配置
graph.setOptions({
theme: {
type: 'dark', // 切换到暗色主题
// 自定义主题配置
node: {
palette: ['#1AAF8B', '#F8E71C', '#8B572A', '#7ED321'],
},
edge: {
palette: ['#F5A623', '#F8E71C', '#8B572A', '#7ED321'],
},
},
});
```
**示例 3**: 更新布局配置
```typescript
// 更新布局配置
graph.setOptions({
layout: {
type: 'force', // 切换到力导向布局
preventOverlap: true,
nodeStrength: -50,
edgeStrength: 0.7,
},
});
```
**示例 4**: 更新节点和边的默认配置
```typescript
// 更新节点和边的默认样式配置
graph.setOptions({
node: {
style: {
fill: '#91d5ff',
stroke: '#40a9ff',
lineWidth: 1,
radius: 10,
},
},
edge: {
style: {
stroke: '#91d5ff',
lineWidth: 2,
endArrow: true,
},
},
});
```
Api Skill
packages/site/docs/api/plugin.en.md anthropic-skill ~1,554 tokens---
title: Plugin
order: 8
---
## Overview of Plugins
[Plugins](/en/manual/plugin/overview) are an important mechanism in G6 for extending functionality and enhancing the interactive experience of graphs. Plugins typically provide independent functional modules, such as thumbnails, toolbars, context menus, etc. They integrate well with the main graph while maintaining modular and maintainable code.
The plugin system is designed to follow the "plug and play" principle, allowing dynamic addition or removal as needed.
## API Reference
### Graph.getPluginInstance(key)
Retrieve the plugin instance specified by the key, used to access and operate the methods provided by the plugin.
```typescript
getPluginInstance<T extends Plugin>(key: string): T;
```
**Parameters**
| Parameter | Description | Type | Default | Required |
| --------- | ------------------------------- | ------ | ------- | -------- |
| key | Unique identifier of the plugin | string | - | ✓ |
**Return Value**
- **Type**: Plugin instance
- **Description**: The plugin instance corresponding to the specified key
**Note**
Many plugins provide specific API methods, which can be directly called by obtaining the plugin instance. For example, the fullscreen plugin provides `request()` and `exit()` methods to control fullscreen status.
**Example**: Operate the fullscreen plugin
```typescript
// Get the fullscreen plugin instance
const fullscreen = graph.getPluginInstance('fullscreen');
// Request to enter fullscreen
fullscreen.request();
// Exit fullscreen later
setTimeout(() => {
fullscreen.exit();
}, 5000);
```
### Graph.getPlugins()
Retrieve all configured plugins in the current graph.
```typescript
getPlugins(): PluginOptions;
```
**Return Value**
- **Type**: [PluginOptions](#pluginoptions)
- **Description**: All configured plugins in the current graph
**Example**
```typescript
// Get all plugin configurations
const plugins = graph.getPlugins();
// View currently active plugins
console.log('Current graph plugin configurations:', plugins);
```
### Graph.setPlugins(plugins)
Set the graph's plugins, replacing all existing plugin configurations.
```typescript
setPlugins(plugins: PluginOptions | ((prev: PluginOptions) => PluginOptions)): void;
```
**Parameters**
| Parameter | Description | Type | Default | Required |
| --------- | ----------------------------------------------------------------------------------------------- | --------------------------------------------------------------------------- | ------- | -------- |
| plugins | New plugin configurations, or a function returning new configurations based on the current ones | [PluginOptions](#pluginoptions) \| ((prev: PluginOptions) => PluginOptions) | - | ✓ |
**Note**
The set plugins will completely replace the original plugin configurations. To add new plugins based on existing ones, you can use functional updates:
```typescript
graph.setPlugins((plugins) => [...plugins, { type: 'grid', key: 'grid-line' }]);
```
**Example 1**: Set basic plugins
```typescript
// Set multiple basic plugins
graph.setPlugins([
// String form (using default configuration)
'minimap',
// Object form (custom configuration)
{
type: 'grid',
key: 'grid-line',
},
{
type: 'toolbar',
key: 'graph-toolbar',
position: 'top-right',
},
]);
```
**Example 2**: Use functional updates
```typescript
// Add new plugins to existing configurations
graph.setPlugins((currentPlugins) => [
...currentPlugins,
{
type: 'grid',
key: 'grid-line',
},
]);
// Replace specific plugins
graph.setPlugins((currentPlugins) => {
// Filter out existing grid plugins
const filteredPlugins = currentPlugins.filter((plugin) => {
if (typeof plugin === 'string') return plugin !== 'grid';
if (typeof plugin === 'function') return true;
return plugin.type !== 'grid';
});
// Add new grid plugin configuration
return [
...filteredPlugins,
{
type: 'grid',
key: 'new-grid',
follow: true,
},
];
});
```
### Graph.updatePlugin(plugin)
Update the configuration of a specified plugin, identified by the `key` of the plugin to be updated.
```typescript
updatePlugin(plugin: UpdatePluginOption): void;
```
**Parameters**
| Parameter | Description | Type | Default | Required |
| --------- | ----------------------------------------- | ----------------------------------------- | ------- | -------- |
| plugin | Configuration of the plugin to be updated | [UpdatePluginOption](#updatepluginoption) | - | ✓ |
**Note**
To update a plugin, the `key` field must be specified in the original plugin configuration to accurately locate and update the plugin.
**Example 1**: Update plugin configuration
```typescript
// Specify key when initially setting plugins
graph.setPlugins([
{
type: 'grid',
key: 'main-grid',
follow: true,
},
]);
// Update grid plugin configuration
graph.updatePlugin({
key: 'main-grid',
follow: false,
});
```
## Type Definitions
### PluginOptions
Plugin configuration type, representing an array of plugin configurations.
```typescript
type PluginOptions = (string | CustomPluginOption | ((this: Graph) => CustomPluginOption))[];
```
### CustomPluginOption
Custom plugin configuration interface, used to configure plugin parameters.
```typescript
type CustomPluginOption = {
// Plugin type
type: string;
// Plugin key, i.e., unique identifier
// Used to identify the plugin for further operations
key?: string;
// Other configuration items for different types of plugins
[configKey: string]: any;
};
```
### UpdatePluginOption
Configuration interface for updating plugins, used to dynamically modify plugin parameters.
```typescript
type UpdatePluginOption = {
// Unique identifier of the plugin to be updated
key: string;
// Other configuration items to be updated
[configKey: string]: unknown;
};
```
Api Skill
packages/site/docs/api/plugin.zh.md anthropic-skill ~991 tokens---
title: 插件
order: 8
---
## 插件概述
[插件](/manual/plugin/overview)(Plugin)是 G6 中扩展功能的重要机制,用于增强图表的功能和交互体验。插件通常提供一些独立的功能模块,如缩略图、工具栏、上下文菜单等,它们可以与图表主体良好集成,同时又保持代码的模块化和可维护性。
插件系统设计遵循"即插即用"的原则,可以根据需要动态添加或移除。
## API 参考
### Graph.getPluginInstance(key)
获取指定 key 的插件实例,用于访问和操作插件提供的方法。
```typescript
getPluginInstance<T extends Plugin>(key: string): T;
```
**参数**
| 参数 | 描述 | 类型 | 默认值 | 必选 |
| ---- | ---------------- | ------ | ------ | ---- |
| key | 插件的唯一标识符 | string | - | ✓ |
**返回值**
- **类型**: 插件实例
- **描述**: 指定 key 对应的插件实例
**说明**
许多插件提供了特定的API方法,通过获取插件实例可以直接调用这些方法。例如,全屏插件提供了 `request()` 和 `exit()` 方法来控制全屏状态。
**示例**: 操作全屏插件
```typescript
// 获取全屏插件实例
const fullscreen = graph.getPluginInstance('fullscreen');
// 请求进入全屏
fullscreen.request();
// 稍后退出全屏
setTimeout(() => {
fullscreen.exit();
}, 5000);
```
### Graph.getPlugins()
获取当前图表中所有已配置的插件。
```typescript
getPlugins(): PluginOptions;
```
**返回值**
- **类型**: [PluginOptions](#pluginoptions)
- **描述**: 当前图表中已配置的所有插件
**示例**
```typescript
// 获取所有插件配置
const plugins = graph.getPlugins();
// 查看当前激活的插件
console.log('当前图表的插件配置:', plugins);
```
### Graph.setPlugins(plugins)
设置图表的插件,将替换所有现有的插件配置。
```typescript
setPlugins(plugins: PluginOptions | ((prev: PluginOptions) => PluginOptions)): void;
```
**参数**
| 参数 | 描述 | 类型 | 默认值 | 必选 |
| ------- | ------------------------------------------------ | --------------------------------------------------------------------------- | ------ | ---- |
| plugins | 新的插件配置,或一个基于当前配置返回新配置的函数 | [PluginOptions](#pluginoptions) \| ((prev: PluginOptions) => PluginOptions) | - | ✓ |
**说明**
设置的插件会全量替换原有的插件配置。如果需要在现有插件基础上添加新插件,可以使用函数式更新方式:
```typescript
graph.setPlugins((plugins) => [...plugins, { type: 'grid', key: 'grid-line' }]);
```
**示例 1**: 设置基本插件
```typescript
// 设置多个基本插件
graph.setPlugins([
// 字符串形式(使用默认配置)
'minimap',
// 对象形式(自定义配置)
{
type: 'grid',
key: 'grid-line',
},
{
type: 'toolbar',
key: 'graph-toolbar',
position: 'top-right',
},
]);
```
**示例 2**: 使用函数式更新
```typescript
// 添加新插件到现有配置
graph.setPlugins((currentPlugins) => [
...currentPlugins,
{
type: 'grid',
key: 'grid-line',
},
]);
// 替换特定插件
graph.setPlugins((currentPlugins) => {
// 过滤掉现有的网格插件
const filteredPlugins = currentPlugins.filter((plugin) => {
if (typeof plugin === 'string') return plugin !== 'grid';
if (typeof plugin === 'function') return true;
return plugin.type !== 'grid';
});
// 添加新的网格插件配置
return [
...filteredPlugins,
{
type: 'grid',
key: 'new-grid',
follow: true,
},
];
});
```
### Graph.updatePlugin(plugin)
更新指定的插件配置,需要通过 `key` 标识要更新的插件。
```typescript
updatePlugin(plugin: UpdatePluginOption): void;
```
**参数**
| 参数 | 描述 | 类型 | 默认值 | 必选 |
| ------ | -------------- | ----------------------------------------- | ------ | ---- |
| plugin | 更新的插件配置 | [UpdatePluginOption](#updatepluginoption) | - | ✓ |
**说明**
如果要更新一个插件,必须在原始插件配置中指定 `key` 字段,以便能够准确找到并更新该插件。
**示例 1**: 更新插件配置
```typescript
// 初始设置插件时指定 key
graph.setPlugins([
{
type: 'grid',
key: 'main-grid',
follow: true,
},
]);
// 更新网格插件配置
graph.updatePlugin({
key: 'main-grid',
follow: false,
});
```
## 类型定义
### PluginOptions
插件配置类型,表示一组插件配置的数组。
```typescript
type PluginOptions = (string | CustomPluginOption | ((this: Graph) => CustomPluginOption))[];
```
### CustomPluginOption
自定义插件配置接口,用于配置插件参数。
```typescript
type CustomPluginOption = {
// 插件类型
type: string;
// 插件 key,即唯一标识
// 用于标识插件,从而进一步操作此插件
key?: string;
// 针对不同类型的插件,还可能有其他配置项
[configKey: string]: any;
};
```
### UpdatePluginOption
更新插件的配置接口,用于动态修改插件参数。
```typescript
type UpdatePluginOption = {
// 要更新的插件的唯一标识
key: string;
// 其他要更新的配置项
[configKey: string]: unknown;
};
```
Api Skill
packages/site/docs/api/render.en.md anthropic-skill ~983 tokens---
title: Drawing and Rendering
order: 3
---
## Overview of Drawing and Rendering
G6 provides a series of drawing and rendering-related APIs to control the display process of graphical elements. In G6, drawing and rendering are two different concepts:
- **Drawing (draw)**: Responsible only for drawing graphical elements onto the canvas, without involving layout calculations.
- **Rendering (render)**: A complete rendering process, including data processing, layout calculations, and final drawing.
Understanding the differences between these APIs is crucial for optimizing performance and achieving specific effects.
## API Reference
### Graph.draw()
Draw elements without performing layout calculations.
```typescript
draw(): Promise<void>;
```
**Note**
The `draw` method only executes the drawing process of elements and does not recalculate the layout.
⚠️ **Attention**: `draw` is an asynchronous method, requiring the use of `await` or Promise chaining to ensure subsequent operations are executed after drawing is complete.
**Example 1**: Basic Usage
```typescript
// Basic usage
await graph.draw();
```
**Example 2**: Redraw after modifying node styles
```javascript
// Redraw after modifying node styles
graph.updateNodeData([
{
id: 'node1',
style: {
fill: 'red',
stroke: 'blue',
lineWidth: 2,
},
},
]);
// Only draw the updated styles without re-layout
await graph.draw();
```
**Example 3**: Batch update multiple elements and draw once
```javascript
// Update multiple nodes
graph.updateNodeData([{ id: 'node1', style: { fill: 'red' } }]);
graph.updateNodeData([{ id: 'node2', style: { fill: 'blue' } }]);
// Update edges
graph.updateEdgeData([{ id: 'edge1', style: { stroke: 'green' } }]);
// Draw after batch operations
await graph.draw();
```
**Example 4**: Use event listener to detect drawing completion
```javascript
import { GraphEvent } from '@antv/g6';
graph.on(GraphEvent.AFTER_DRAW, () => {
console.log('Drawing complete');
});
await graph.draw();
```
### Graph.render()
Execute the complete rendering process, including data processing, layout calculations, and drawing.
```typescript
render(): Promise<void>;
```
**Note**
The `render` method executes the complete rendering process:
1. Process data updates
2. Draw elements onto the canvas
3. Execute layout algorithms
**Example 1**: Basic Usage
```typescript
// Basic usage
await graph.render();
```
**Example 2**: Render after adding new data
```typescript
graph.addData({
nodes: [{ id: 'node3' }, { id: 'node4' }],
edges: [{ id: 'edge2', source: 'node1', target: 'node3' }],
});
await graph.render();
```
**Example 3**: Listen to rendering events
```typescript
import { GraphEvent } from '@antv/g6';
// Before rendering starts
graph.on(GraphEvent.BEFORE_RENDER, () => {
console.log('Rendering starts...');
// Show loading indicator
showLoadingIndicator();
});
// After rendering completes
graph.on(GraphEvent.AFTER_RENDER, () => {
console.log('Rendering complete');
// Hide loading indicator
hideLoadingIndicator();
});
graph.render();
```
### Graph.clear()
Clear all elements on the canvas, including nodes, edges, and other graphical elements.
```typescript
clear(): Promise<void>;
```
**Note**
This method deletes all elements in the graph but retains the canvas configuration and styles. It is an asynchronous method that returns a Promise.
**Example**
```typescript
// Basic usage
await graph.clear();
```
## Usage Tips
### Choosing between draw and render
- Use `draw()` when:
- Only the styles or states of elements are modified, without needing to recalculate positions.
- Performance-sensitive, aiming to avoid unnecessary layout calculations.
- Use `render()` when:
- Initializing the graph.
- Changing layout configurations.
- Adding or removing a large number of nodes/edges.
- Need to recalculate positions of all elements.
Api Skill
packages/site/docs/api/render.zh.md anthropic-skill ~572 tokens---
title: 绘制与渲染
order: 3
---
## 绘制与渲染概述
G6 提供了一系列绘制和渲染相关的 API,用于控制图形元素的显示过程。在 G6 中,绘制和渲染是两个不同的概念:
- **绘制(draw)**: 仅负责将图形元素绘制到画布上,不涉及布局计算
- **渲染(render)**: 完整的渲染流程,包括数据处理、布局计算和最终绘制
理解这些 API 的区别对于优化性能和实现特定效果至关重要。
## API 参考
### Graph.draw()
绘制元素,但不执行布局计算。
```typescript
draw(): Promise<void>;
```
**说明**
`draw` 方法仅执行元素的绘制过程,不会重新计算布局。
⚠️ **注意**: `draw` 为异步方法,需要使用 `await` 或 Promise 链式调用来确保绘制完成后再执行后续操作。
**示例 1**: 基础用法
```typescript
// 基本用法
await graph.draw();
```
**示例 2**: 修改节点样式后重新绘制
```javascript
// 修改节点样式后重新绘制
graph.updateNodeData([
{
id: 'node1',
style: {
fill: 'red',
stroke: 'blue',
lineWidth: 2,
},
},
]);
// 仅绘制更新后的样式,不重新布局
await graph.draw();
```
**示例 3**: 批量更新多个元素后一次性绘制
```javascript
// 更新多个节点
graph.updateNodeData([{ id: 'node1', style: { fill: 'red' } }]);
graph.updateNodeData([{ id: 'node2', style: { fill: 'blue' } }]);
// 更新边
graph.updateEdgeData([{ id: 'edge1', style: { stroke: 'green' } }]);
// 批量操作完成后绘制
await graph.draw();
```
**示例 4**: 使用事件监听绘制完成
```javascript
import { GraphEvent } from '@antv/g6';
graph.on(GraphEvent.AFTER_DRAW, () => {
console.log('绘制完成');
});
await graph.draw();
```
### Graph.render()
执行完整的渲染流程,包括数据处理、布局计算和绘制。
```typescript
render(): Promise<void>;
```
**说明**
`render` 方法会执行完整的渲染流程:
1. 处理数据更新
2. 绘制元素到画布上
3. 执行布局算法
**示例 1**: 基本用法
```typescript
// 基本用法
await graph.render();
```
**示例 2**: 添加新数据后渲染
```typescript
graph.addData({
nodes: [{ id: 'node3' }, { id: 'node4' }],
edges: [{ id: 'edge2', source: 'node1', target: 'node3' }],
});
await graph.render();
```
**示例 3**: 监听渲染事件
```typescript
import { GraphEvent } from '@antv/g6';
// 渲染开始前
graph.on(GraphEvent.BEFORE_RENDER, () => {
console.log('渲染开始...');
// 显示加载指示器
showLoadingIndicator();
});
// 渲染完成后
graph.on(GraphEvent.AFTER_RENDER, () => {
console.log('渲染完成');
// 隐藏加载指示器
hideLoadingIndicator();
});
graph.render();
```
### Graph.clear()
清空画布上的所有元素,包括节点、边和其他图形元素。
```typescript
clear(): Promise<void>;
```
**说明**
此方法会删除图中的所有元素,但保留画布配置和样式。这是一个异步方法,返回一个 Promise。
**示例**
```typescript
// 基本用法
await graph.clear();
```
## 使用技巧
### draw 与 render 的选择
- 使用 `draw()` 当:
- 仅修改了元素样式或状态,不需要重新计算位置
- 性能敏感,希望避免不必要的布局计算
- 使用 `render()` 当:
- 初始化图表
- 更改了布局配置
- 添加或删除了大量节点/边
- 需要重新计算所有元素位置
Api Skill
packages/site/docs/api/theme.en.md anthropic-skill ~362 tokens---
title: Theme
order: 9
---
## Overview of Theme
G6 allows users to customize the appearance of graphs through themes. Themes can be used to define colors, shapes, and styles for nodes, edges, and other graph elements.
## API Reference
### Graph.getTheme()
Get the theme
```typescript
getTheme(): ThemeOptions;
```
<details><summary>Related Parameters</summary>
**Return Value**:
- **Type:** false \| 'light' \| 'dark' \| string
- **Description:** Current theme
</details>
### Graph.setTheme(theme)
Set the theme
```typescript
setTheme(theme: ThemeOptions | ((prev: ThemeOptions) => ThemeOptions)): void;
```
**Example**
```ts
graph.setTheme('dark');
```
<details><summary>Related Parameters</summary>
<table><thead><tr><th>
Parameter
</th><th>
Type
</th><th>
Description
</th></tr></thead>
<tbody><tr><td>
theme
</td><td>
false \| 'light' \| 'dark' \| string \| ((prev: false \| 'light' \| 'dark' \| string) => false \| 'light' \| 'dark' \| string)
</td><td>
Theme name
</td></tr>
</tbody></table>
**Return Value**:
- **Type:** void
</details>
## Type Definitions
### ThemeOptions
```typescript
type ThemeOptions = {
// Colors used in the theme
colors: string[];
// Node style settings
nodeStyle?: {
fill: string;
stroke: string;
};
// Edge style settings
edgeStyle?: {
stroke: string;
};
// Additional configuration options for the theme
[configKey: string]: any;
};
```
Api Skill
packages/site/docs/api/theme.zh.md anthropic-skill ~191 tokens---
title: 主题
order: 9
---
## API 参考
### Graph.getTheme()
获取主题
```typescript
getTheme(): ThemeOptions;
```
<details><summary>相关参数</summary>
**返回值**:
- **类型:** false \| 'light' \| 'dark' \| string
- **描述:** 当前主题
</details>
### Graph.setTheme(theme)
设置主题
```typescript
setTheme(theme: ThemeOptions | ((prev: ThemeOptions) => ThemeOptions)): void;
```
**示例**
```ts
graph.setTheme('dark');
```
<details><summary>相关参数</summary>
<table><thead><tr><th>
参数
</th><th>
类型
</th><th>
描述
</th></tr></thead>
<tbody><tr><td>
theme
</td><td>
false \| 'light' \| 'dark' \| string \| ((prev: false \| 'light' \| 'dark' \| string) => false \| 'light' \| 'dark' \| string)
</td><td>
主题名
</td></tr>
</tbody></table>
**返回值**:
- **类型:** void
</details>
Api Skill
packages/site/docs/api/transform.en.md anthropic-skill ~1,382 tokens---
title: Data Transformation
order: 10
---
## Overview of Data Transformation
[Data Transformation](/en/manual/transform/overview) is a powerful feature in G6 that allows for processing and transforming data during the graph rendering process. With data transformers, you can achieve various data processing needs, such as:
- Data Filtering: Filter nodes and edges to be displayed based on conditions
- Data Calculation: Generate new attributes based on original data, such as calculating node size based on the number of connections, without polluting the original data
- Data Aggregation: Aggregate a large number of nodes into fewer nodes to improve the performance of large-scale graphs
Data transformation occurs at specific stages of the rendering process, allowing flexible changes to the final presentation without modifying the original data source.
## API Reference
### Graph.getTransforms()
Retrieve all configured data transformers in the current graph.
```typescript
getTransforms(): TransformOptions;
```
**Return Value**
- **Type**: [TransformOptions](#transformoptions)
- **Description**: All configured data transformers in the current graph
**Example**
```typescript
// Retrieve all data transformers
const transforms = graph.getTransforms();
console.log('Data transformers in the current graph:', transforms);
```
### Graph.setTransforms(transforms)
Set the data transformers for the graph, replacing all existing transformers.
```typescript
setTransforms(transforms: TransformOptions | ((prev: TransformOptions) => TransformOptions)): void;
```
**Parameters**
| Parameter | Description | Type | Default | Required |
| ---------- | --------------------------------------------------------------------------------------------------------- | ------------------------------------------------------------------------------------- | ------- | -------- |
| transforms | New data transformer configurations, or a function returning new configurations based on the current ones | [TransformOptions](#transformoptions) \| (prev: TransformOptions) => TransformOptions | - | ✓ |
**Note**
Data transformers can process data at different stages of the graph rendering process. The set data transformations will completely replace the original ones. To add new data transformations based on existing ones, you can use functional updates.
**Example 1**: Set basic data transformations
```typescript
graph.setTransforms(['process-parallel-edges', 'map-node-size']);
```
**Example 2**: Set data transformations with configurations
```typescript
graph.setTransforms([
// String form (using default configuration)
'process-parallel-edges',
// Object form (custom configuration)
{
type: 'process-parallel-edges',
key: 'my-process-parallel-edges',
distance: 20, // Distance between parallel edges
},
]);
```
**Example 3**: Use functional updates
```typescript
// Add new data transformations to existing configurations
graph.setTransforms((currentTransforms) => [
...currentTransforms,
{
type: 'map-node-size',
key: 'my-map-node-size',
maxSize: 100,
minSize: 20,
},
]);
```
### Graph.updateTransform(transform)
Update the configuration of a specified data transformer, identified by the `key` of the transformer to be updated.
```typescript
updateTransform(transform: UpdateTransformOption): void;
```
**Parameters**
| Parameter | Description | Type | Default | Required |
| --------- | --------------------------------------------------- | ----------------------------------------------- | ------- | -------- |
| transform | Configuration of the data transformer to be updated | [UpdateTransformOption](#updatetransformoption) | - | ✓ |
**Note**
To update a data transformer, the `key` field must be specified in the original data transformer configuration to accurately locate and update the transformer.
**Example**: Update data transformer configuration
```typescript
// Specify key when initially setting data transformers
graph.setTransforms([
{
type: 'process-parallel-edges',
key: 'my-process-parallel-edges',
distance: 20,
},
]);
// Update distance between parallel edges
graph.updateTransform({
key: 'my-process-parallel-edges',
distance: 30,
});
```
## Type Definitions
### TransformOptions
Data transformer configuration type, representing an array of data transformer configurations.
```typescript
type TransformOptions = (CustomTransformOption | ((this: Graph) => CustomTransformOption))[];
```
### CustomTransformOption
Custom data transformer configuration interface, used to configure data processing parameters.
```typescript
type CustomTransformOption = {
// Data processing type
type: string;
// Unique identifier for the data transformer
key?: string;
// Other configuration items for different types of data processing
[configKey: string]: any;
};
```
### UpdateTransformOption
Configuration interface for updating data transformers, used to dynamically modify data processing parameters.
```typescript
type UpdateTransformOption = {
// Unique identifier of the data transformer to be updated
key: string;
// Other configuration items to be updated
[configKey: string]: unknown;
};
```
Api Skill
packages/site/docs/api/transform.zh.md anthropic-skill ~832 tokens---
title: 数据处理
order: 10
---
## 数据处理概述
[数据处理](/manual/transform/overview)(Transform)是 G6 中一项强大的功能,允许在图渲染过程中对数据进行处理和转换。通过数据处理器,您可以实现各种数据处理需求,比如:
- 数据过滤:根据条件筛选需要显示的节点和边
- 数据计算:基于原始数据生成新的属性,如根据节点连接数计算节点大小,但不污染原始数据
- 数据聚合:将大量节点聚合为少量节点,提高大规模图表的性能
数据处理发生在渲染流程的特定阶段,可以灵活地改变最终呈现的结果,而无需修改原始数据源。
## API 参考
### Graph.getTransforms()
获取当前图表中所有已配置的数据处理器。
```typescript
getTransforms(): TransformOptions;
```
**返回值**
- **类型**: [TransformOptions](#transformoptions)
- **描述**: 当前图表中已配置的所有数据处理器
**示例**
```typescript
// 获取当前所有数据处理器
const transforms = graph.getTransforms();
console.log('当前图表的数据处理器:', transforms);
```
### Graph.setTransforms(transforms)
设置图表的数据处理器,将替换所有现有的数据处理器。
```typescript
setTransforms(transforms: TransformOptions | ((prev: TransformOptions) => TransformOptions)): void;
```
**参数**
| 参数 | 描述 | 类型 | 默认值 | 必选 |
| ---------- | ------------------------------------------------------ | ------------------------------------------------------------------------------------- | ------ | ---- |
| transforms | 新的数据处理器配置,或一个基于当前配置返回新配置的函数 | [TransformOptions](#transformoptions) \| (prev: TransformOptions) => TransformOptions | - | ✓ |
**说明**
数据处理器能够在图渲染过程的不同阶段对数据进行处理。设置的数据处理会全量替换原有的数据处理,如果需要在现有数据处理基础上添加新的数据处理,可以使用函数式更新方式。
**示例 1**: 设置基本数据处理
```typescript
graph.setTransforms(['process-parallel-edges', 'map-node-size']);
```
**示例 2**: 设置带配置的数据处理
```typescript
graph.setTransforms([
// 字符串形式(使用默认配置)
'process-parallel-edges',
// 对象形式(自定义配置)
{
type: 'process-parallel-edges',
key: 'my-process-parallel-edges',
distance: 20, // 平行边之间的距离
},
]);
```
**示例 3**: 使用函数式更新
```typescript
// 添加新的数据处理到现有配置
graph.setTransforms((currentTransforms) => [
...currentTransforms,
{
type: 'map-node-size',
key: 'my-map-node-size',
maxSize: 100,
minSize: 20,
},
]);
```
### Graph.updateTransform(transform)
更新指定的数据处理器配置,需要通过 `key` 标识要更新的数据处理。
```typescript
updateTransform(transform: UpdateTransformOption): void;
```
**参数**
| 参数 | 描述 | 类型 | 默认值 | 必选 |
| --------- | ------------------ | ----------------------------------------------- | ------ | ---- |
| transform | 更新的数据处理配置 | [UpdateTransformOption](#updatetransformoption) | - | ✓ |
**说明**
如果要更新一个数据处理器,必须在原始数据处理配置中指定 `key` 字段,以便能够准确找到并更新该数据处理。
**示例**: 更新数据处理配置
```typescript
// 初始设置数据处理时指定 key
graph.setTransforms([
{
type: 'process-parallel-edges',
key: 'my-process-parallel-edges',
distance: 20,
},
]);
// 更新平行边距离
graph.updateTransform({
key: 'my-process-parallel-edges',
distance: 30,
});
```
## 类型定义
### TransformOptions
数据处理器配置类型,表示一组数据处理配置的数组。
```typescript
type TransformOptions = (CustomTransformOption | ((this: Graph) => CustomTransformOption))[];
```
### CustomTransformOption
自定义数据处理配置接口,用于配置数据处理参数。
```typescript
type CustomTransformOption = {
// 数据处理类型
type: string;
// 数据处理唯一标识
key?: string;
// 针对不同类型的数据处理,还可能有其他配置项
[configKey: string]: any;
};
```
### UpdateTransformOption
更新数据处理的配置接口,用于动态修改数据处理参数。
```typescript
type UpdateTransformOption = {
// 要更新的数据处理的唯一标识
key: string;
// 其他要更新的配置项
[configKey: string]: unknown;
};
```
Api Skill
packages/site/docs/api/viewport.en.md anthropic-skill ~3,341 tokens---
title: Viewport Operations
order: 4
---
## Overview of Viewport Operations
G6 provides a series of viewport operation APIs to control the zooming, panning, and rotating of the canvas. These operations help users better view and interact with graphical content. Through viewport operations, you can achieve the following functions:
- Zoom the canvas to view details or the global view
- Pan the canvas to view different areas
- Rotate the canvas to get different perspectives
- Automatically fit content to the viewport
### Categories of Viewport Operations
Viewport operations in G6 are mainly divided into the following categories:
1. **Zoom Operations**: such as `zoomTo`, `zoomBy`
2. **Pan Operations**: such as `translateTo`, `translateBy`
3. **Rotate Operations**: such as `rotateTo`, `rotateBy`
4. **Fit Operations**: such as `fitView`, `fitCenter`
5. **Viewport Information Retrieval**: such as `getZoom`, `getPosition`
## API Reference
### Graph.zoomTo(zoom, animation, origin)
Zoom the canvas to a specified scale (absolute zoom).
```typescript
zoomTo(zoom: number, animation?: ViewportAnimationEffectTiming, origin?: Point): Promise<void>;
```
**Parameters**
| Parameter | Description | Type | Default | Required |
| --------- | -------------------------------------------------------------- | --------------------------------------------------------------- | ------- | -------- |
| zoom | Target zoom scale (1 = original size, >1 zoom in, <1 zoom out) | number | - | ✓ |
| animation | Animation configuration | [ViewportAnimationEffectTiming](#viewportanimationeffecttiming) | - | |
| origin | Zoom center point (viewport coordinates) | [Point](#point) | - | |
**Example**
```typescript
// Zoom in to 2x
graph.zoomTo(2);
// Zoom out to 0.5x with animation
graph.zoomTo(0.5, {
duration: 500,
easing: 'ease',
});
// Zoom in with the viewport center as the origin
graph.zoomTo(1.5, false, graph.getCanvasCenter());
```
### Graph.zoomBy(ratio, animation, origin)
Zoom based on the current zoom scale (relative zoom).
```typescript
zoomBy(ratio: number, animation?: ViewportAnimationEffectTiming, origin?: Point): Promise<void>;
```
**Parameters**
| Parameter | Description | Type | Default | Required |
| --------- | ---------------------------------------- | --------------------------------------------------------------- | ------- | -------- |
| ratio | Zoom ratio (>1 zoom in, <1 zoom out) | number | - | ✓ |
| animation | Animation configuration | [ViewportAnimationEffectTiming](#viewportanimationeffecttiming) | - | |
| origin | Zoom center point (viewport coordinates) | [Point](#point) | - | |
**Example**
```typescript
// Zoom in by 1.2x based on the current scale
graph.zoomBy(1.2);
// Zoom out to 0.8x based on the current scale with animation
graph.zoomBy(0.8, {
duration: 300,
});
```
### Graph.translateTo(position, animation)
Pan the graph to a specified position (absolute pan).
```typescript
translateTo(position: Point, animation?: ViewportAnimationEffectTiming): Promise<void>;
```
**Parameters**
| Parameter | Description | Type | Default | Required |
| --------- | --------------------------- | --------------------------------------------------------------- | ------- | -------- |
| position | Target position coordinates | [Point](#point) | - | ✓ |
| animation | Animation configuration | [ViewportAnimationEffectTiming](#viewportanimationeffecttiming) | - | |
**Example**
```typescript
// Pan to a specified position
graph.translateTo([100, 100]);
// Pan with animation
graph.translateTo([200, 200], {
duration: 1000,
easing: 'ease-in-out',
});
```
### Graph.translateBy(offset, animation)
Pan the graph by a specified distance relative to the current position (relative pan).
```typescript
translateBy(offset: Point, animation?: ViewportAnimationEffectTiming): Promise<void>;
```
**Parameters**
| Parameter | Description | Type | Default | Required |
| --------- | ----------------------- | --------------------------------------------------------------- | ------- | -------- |
| offset | Pan offset | [Point](#point) | - | ✓ |
| animation | Animation configuration | [ViewportAnimationEffectTiming](#viewportanimationeffecttiming) | - | |
**Example**
```typescript
// Pan right by 100 pixels and down by 50 pixels
graph.translateBy([100, 50]);
// Relative pan with animation
graph.translateBy([-50, -50], {
duration: 500,
});
```
### Graph.rotateTo(angle, animation, origin)
Rotate the canvas to a specified angle (absolute rotation).
```typescript
rotateTo(angle: number, animation?: ViewportAnimationEffectTiming, origin?: Point): Promise<void>;
```
**Parameters**
| Parameter | Description | Type | Default | Required |
| --------- | -------------------------------------------- | --------------------------------------------------------------- | ------- | -------- |
| angle | Target rotation angle (radians) | number | - | ✓ |
| animation | Animation configuration | [ViewportAnimationEffectTiming](#viewportanimationeffecttiming) | - | |
| origin | Rotation center point (viewport coordinates) | [Point](#point) | - | |
**Example**
```typescript
// Rotate to 45 degrees
graph.rotateTo(Math.PI / 4);
// Rotate to 90 degrees with animation
graph.rotateTo(Math.PI / 2, {
duration: 1000,
});
```
### Graph.rotateBy(angle, animation, origin)
Rotate based on the current angle (relative rotation).
```typescript
rotateBy(angle: number, animation?: ViewportAnimationEffectTiming, origin?: Point): Promise<void>;
```
**Parameters**
| Parameter | Description | Type | Default | Required |
| --------- | -------------------------------------------- | --------------------------------------------------------------- | ------- | -------- |
| angle | Rotation angle increment (radians) | number | - | ✓ |
| animation | Animation configuration | [ViewportAnimationEffectTiming](#viewportanimationeffecttiming) | - | |
| origin | Rotation center point (viewport coordinates) | [Point](#point) | - | |
**Example**
```typescript
// Rotate clockwise by 30 degrees relative to the current angle
graph.rotateBy(Math.PI / 6);
// Relative rotation with animation
graph.rotateBy(-Math.PI / 4, {
duration: 500,
easing: 'ease-out',
});
```
### Graph.fitView(options, animation)
Scale the graph to fit the appropriate size and pan to the center of the viewport.
```typescript
fitView(options?: FitViewOptions, animation?: ViewportAnimationEffectTiming): Promise<void>;
```
**Parameters**
| Parameter | Description | Type | Default | Required |
| --------- | ----------------------- | --------------------------------------------------------------- | ------- | -------- |
| options | Fit options | FitViewOptions | - | |
| animation | Animation configuration | [ViewportAnimationEffectTiming](#viewportanimationeffecttiming) | - | |
**FitViewOptions Type Description**
| Property | Type | Default | Description |
| --------- | ---------------------- | ---------- | ------------------------------------------------- |
| when | 'overflow' \| 'always' | 'overflow' | Fit timing: only when overflow or always |
| direction | 'x' \| 'y' \| 'both' | 'both' | Fit direction: x-axis, y-axis, or both directions |
**Example**
```typescript
// Basic usage
graph.fitView();
// Configure fit options
graph.fitView(
{
when: 'always', // Always fit
direction: 'both', // Fit in both directions
},
{
duration: 1000, // With animation
},
);
// Fit in the x direction only when content overflows
graph.fitView({
when: 'overflow',
direction: 'x',
});
```
### Graph.fitCenter(animation)
Pan the graph to the center of the viewport.
```typescript
fitCenter(animation?: ViewportAnimationEffectTiming): Promise<void>;
```
**Parameters**
| Parameter | Description | Type | Default | Required |
| --------- | ----------------------- | --------------------------------------------------------------- | ------- | -------- |
| animation | Animation configuration | [ViewportAnimationEffectTiming](#viewportanimationeffecttiming) | - | |
**Example**
```typescript
// Center the graph
graph.fitCenter();
// Center with animation
graph.fitCenter({
duration: 500,
easing: 'ease-in',
});
```
### Graph.getZoom()
Get the current zoom scale.
```typescript
getZoom(): number;
```
**Example**
```typescript
const currentZoom = graph.getZoom();
console.log('Current zoom scale:', currentZoom);
```
### Graph.getPosition()
Get the position of the graph (position of the canvas origin in the viewport coordinate system).
```typescript
getPosition(): Point;
```
**Example**
```typescript
const position = graph.getPosition();
console.log('Current position:', position);
```
### Graph.getRotation()
Get the current rotation angle.
```typescript
getRotation(): number;
```
**Example**
```typescript
const rotation = graph.getRotation();
console.log('Current rotation angle (radians):', rotation);
console.log('Current rotation angle (degrees):', (rotation * 180) / Math.PI);
```
### Graph.getCanvasCenter()
Get the viewport coordinates of the viewport center.
```typescript
getCanvasCenter(): Point;
```
**Example**
```typescript
const center = graph.getCanvasCenter();
console.log('Viewport center coordinates:', center);
```
### Graph.getViewportCenter()
Get the canvas coordinates of the viewport center.
```typescript
getViewportCenter(): Point;
```
**Example**
```typescript
const viewportCenter = graph.getViewportCenter();
console.log('Canvas coordinates of the viewport center:', viewportCenter);
```
### Graph.setZoomRange(zoomRange)
Set the zoom range of the current graph.
```typescript
setZoomRange(zoomRange: [number, number]): void;
```
**Parameters**
| Parameter | Description | Type | Default | Required |
| --------- | ----------- | ----------------------------- | ------- | -------- |
| zoomRange | Zoom range | [number, number] \| undefined | - | ✓ |
**Example**
```typescript
// Limit the zoom range between 0.5x and 2x
graph.setZoomRange([0.5, 2]);
// Remove zoom restrictions
graph.setZoomRange(undefined);
```
### Graph.getZoomRange()
Get the zoom range of the current graph.
```typescript
getZoomRange(): GraphOptions['zoomRange'];
```
**Example**
```typescript
const range = graph.getZoomRange();
console.log('Current zoom range:', range);
```
### Graph.resize()
Resize the canvas to the size of the graph container.
```typescript
resize(): void;
```
### Graph.resize(width, height)
Resize the canvas to the specified width and height.
```typescript
resize(width: number, height: number): void;
```
**Parameters**
| Parameter | Description | Type | Default | Required |
| --------- | ------------- | ------ | ------- | -------- |
| width | Target width | number | - | ✓ |
| height | Target height | number | - | ✓ |
**Example**
```typescript
// Set the canvas size to 800x600
graph.resize(800, 600);
```
## Type Definitions
### ViewportAnimationEffectTiming
Viewport animation configuration type.
```typescript
type ViewportAnimationEffectTiming =
| boolean // Whether to enable animation
| {
easing?: string; // Easing function
duration?: number; // Animation duration (ms)
};
```
### Point
Coordinate point type.
```typescript
type Point = [number, number] | [number, number, number] | Float32Array;
```
### FitViewOptions
View fit options.
```typescript
interface FitViewOptions {
when?: 'overflow' | 'always'; // Fit timing
direction?: 'x' | 'y' | 'both'; // Fit direction
}
```
Api Skill
packages/site/docs/api/viewport.zh.md anthropic-skill ~2,500 tokens---
title: 视口操作
order: 4
---
## 视口操作概述
G6 提供了一系列视口操作 API,用于控制画布的缩放、平移和旋转。这些操作可以帮助用户更好地查看和交互图形内容。通过视口操作,你可以实现以下功能:
- 缩放画布以查看细节或全局视图
- 平移画布以查看不同区域
- 旋转画布以获得不同视角
- 自动适配内容到视口
### 视口操作分类
G6 的视口操作主要分为以下几类:
1. **缩放操作**:如 `zoomTo`、`zoomBy`
2. **平移操作**:如 `translateTo`、`translateBy`
3. **旋转操作**:如 `rotateTo`、`rotateBy`
4. **自适应操作**:如 `fitView`、`fitCenter`
5. **视口信息获取**:如 `getZoom`、`getPosition`
## API 参考
### Graph.zoomTo(zoom, animation, origin)
缩放画布至指定比例(绝对缩放)。
```typescript
zoomTo(zoom: number, animation?: ViewportAnimationEffectTiming, origin?: Point): Promise<void>;
```
**参数**
| 参数 | 描述 | 类型 | 默认值 | 必选 |
| --------- | --------------------------------------------- | --------------------------------------------------------------- | ------ | ---- |
| zoom | 目标缩放比例 (1 = 原始大小, >1 放大, <1 缩小) | number | - | ✓ |
| animation | 动画配置 | [ViewportAnimationEffectTiming](#viewportanimationeffecttiming) | - | |
| origin | 缩放中心点(视口坐标) | [Point](#point) | - | |
**示例**
```typescript
// 放大到2倍
graph.zoomTo(2);
// 带动画效果的缩小到0.5倍
graph.zoomTo(0.5, {
duration: 500,
easing: 'ease',
});
// 以视口中心点为原点放大
graph.zoomTo(1.5, false, graph.getCanvasCenter());
```
### Graph.zoomBy(ratio, animation, origin)
基于当前缩放比例进行缩放(相对缩放)。
```typescript
zoomBy(ratio: number, animation?: ViewportAnimationEffectTiming, origin?: Point): Promise<void>;
```
**参数**
| 参数 | 描述 | 类型 | 默认值 | 必选 |
| --------- | --------------------------- | --------------------------------------------------------------- | ------ | ---- |
| ratio | 缩放比例 (>1 放大, <1 缩小) | number | - | ✓ |
| animation | 动画配置 | [ViewportAnimationEffectTiming](#viewportanimationeffecttiming) | - | |
| origin | 缩放中心点(视口坐标) | [Point](#point) | - | |
**示例**
```typescript
// 在当前比例基础上放大1.2倍
graph.zoomBy(1.2);
// 在当前比例基础上缩小到0.8倍,带动画
graph.zoomBy(0.8, {
duration: 300,
});
```
### Graph.translateTo(position, animation)
将图平移至指定位置(绝对平移)。
```typescript
translateTo(position: Point, animation?: ViewportAnimationEffectTiming): Promise<void>;
```
**参数**
| 参数 | 描述 | 类型 | 默认值 | 必选 |
| --------- | ------------ | --------------------------------------------------------------- | ------ | ---- |
| position | 目标位置坐标 | [Point](#point) | - | ✓ |
| animation | 动画配置 | [ViewportAnimationEffectTiming](#viewportanimationeffecttiming) | - | |
**示例**
```typescript
// 平移到指定位置
graph.translateTo([100, 100]);
// 带动画效果的平移
graph.translateTo([200, 200], {
duration: 1000,
easing: 'ease-in-out',
});
```
### Graph.translateBy(offset, animation)
将图相对当前位置平移指定距离(相对平移)。
```typescript
translateBy(offset: Point, animation?: ViewportAnimationEffectTiming): Promise<void>;
```
**参数**
| 参数 | 描述 | 类型 | 默认值 | 必选 |
| --------- | ---------- | --------------------------------------------------------------- | ------ | ---- |
| offset | 平移偏移量 | [Point](#point) | - | ✓ |
| animation | 动画配置 | [ViewportAnimationEffectTiming](#viewportanimationeffecttiming) | - | |
**示例**
```typescript
// 向右平移100像素,向下平移50像素
graph.translateBy([100, 50]);
// 带动画效果的相对平移
graph.translateBy([-50, -50], {
duration: 500,
});
```
### Graph.rotateTo(angle, animation, origin)
旋转画布至指定角度(绝对旋转)。
```typescript
rotateTo(angle: number, animation?: ViewportAnimationEffectTiming, origin?: Point): Promise<void>;
```
**参数**
| 参数 | 描述 | 类型 | 默认值 | 必选 |
| --------- | -------------------- | --------------------------------------------------------------- | ------ | ---- |
| angle | 目标旋转角度(弧度制) | number | - | ✓ |
| animation | 动画配置 | [ViewportAnimationEffectTiming](#viewportanimationeffecttiming) | - | |
| origin | 旋转中心点(视口坐标) | [Point](#point) | - | |
**示例**
```typescript
// 旋转到45度
graph.rotateTo(Math.PI / 4);
// 带动画效果的旋转到90度
graph.rotateTo(Math.PI / 2, {
duration: 1000,
});
```
### Graph.rotateBy(angle, animation, origin)
基于当前角度进行旋转(相对旋转)。
```typescript
rotateBy(angle: number, animation?: ViewportAnimationEffectTiming, origin?: Point): Promise<void>;
```
**参数**
| 参数 | 描述 | 类型 | 默认值 | 必选 |
| --------- | -------------------- | --------------------------------------------------------------- | ------ | ---- |
| angle | 旋转角度增量(弧度制) | number | - | ✓ |
| animation | 动画配置 | [ViewportAnimationEffectTiming](#viewportanimationeffecttiming) | - | |
| origin | 旋转中心点(视口坐标) | [Point](#point) | - | |
**示例**
```typescript
// 相对当前角度顺时针旋转30度
graph.rotateBy(Math.PI / 6);
// 带动画效果的相对旋转
graph.rotateBy(-Math.PI / 4, {
duration: 500,
easing: 'ease-out',
});
```
### Graph.fitView(options, animation)
将图缩放至合适大小并平移至视口中心。
```typescript
fitView(options?: FitViewOptions, animation?: ViewportAnimationEffectTiming): Promise<void>;
```
**参数**
| 参数 | 描述 | 类型 | 默认值 | 必选 |
| --------- | -------- | --------------------------------------------------------------- | ------ | ---- |
| options | 适配选项 | FitViewOptions | - | |
| animation | 动画配置 | [ViewportAnimationEffectTiming](#viewportanimationeffecttiming) | - | |
**FitViewOptions 类型说明**
| 属性 | 类型 | 默认值 | 描述 |
| --------- | ---------------------- | ---------- | ---------------------------- |
| when | 'overflow' \| 'always' | 'overflow' | 适配时机:仅溢出时或始终适配 |
| direction | 'x' \| 'y' \| 'both' | 'both' | 适配方向:x轴、y轴或两个方向 |
**示例**
```typescript
// 基本使用
graph.fitView();
// 配置适配选项
graph.fitView(
{
when: 'always', // 始终进行适配
direction: 'both', // 在两个方向上适配
},
{
duration: 1000, // 带动画效果
},
);
// 仅在内容溢出时适配x方向
graph.fitView({
when: 'overflow',
direction: 'x',
});
```
### Graph.fitCenter(animation)
将图平移至视口中心。
```typescript
fitCenter(animation?: ViewportAnimationEffectTiming): Promise<void>;
```
**参数**
| 参数 | 描述 | 类型 | 默认值 | 必选 |
| --------- | -------- | --------------------------------------------------------------- | ------ | ---- |
| animation | 动画配置 | [ViewportAnimationEffectTiming](#viewportanimationeffecttiming) | - | |
**示例**
```typescript
// 居中显示
graph.fitCenter();
// 带动画效果的居中
graph.fitCenter({
duration: 500,
easing: 'ease-in',
});
```
### Graph.getZoom()
获取当前缩放比例。
```typescript
getZoom(): number;
```
**示例**
```typescript
const currentZoom = graph.getZoom();
console.log('当前缩放比例:', currentZoom);
```
### Graph.getPosition()
获取图的位置(画布原点在视口坐标系下的位置)。
```typescript
getPosition(): Point;
```
**示例**
```typescript
const position = graph.getPosition();
console.log('当前位置:', position);
```
### Graph.getRotation()
获取当前旋转角度。
```typescript
getRotation(): number;
```
**示例**
```typescript
const rotation = graph.getRotation();
console.log('当前旋转角度(弧度):', rotation);
console.log('当前旋转角度(度):', (rotation * 180) / Math.PI);
```
### Graph.getCanvasCenter()
获取视口中心的视口坐标。
```typescript
getCanvasCenter(): Point;
```
**示例**
```typescript
const center = graph.getCanvasCenter();
console.log('视口中心坐标:', center);
```
### Graph.getViewportCenter()
获取视口中心的画布坐标。
```typescript
getViewportCenter(): Point;
```
**示例**
```typescript
const viewportCenter = graph.getViewportCenter();
console.log('视口中心的画布坐标:', viewportCenter);
```
### Graph.setZoomRange(zoomRange)
设置当前图的缩放区间。
```typescript
setZoomRange(zoomRange: [number, number]): void;
```
**参数**
| 参数 | 描述 | 类型 | 默认值 | 必选 |
| --------- | -------- | ----------------------------- | ------ | ---- |
| zoomRange | 缩放区间 | [number, number] \| undefined | - | ✓ |
**示例**
```typescript
// 限制缩放范围在0.5到2倍之间
graph.setZoomRange([0.5, 2]);
// 移除缩放限制
graph.setZoomRange(undefined);
```
### Graph.getZoomRange()
获取当前图的缩放区间。
```typescript
getZoomRange(): GraphOptions['zoomRange'];
```
**示例**
```typescript
const range = graph.getZoomRange();
console.log('当前缩放区间:', range);
```
### Graph.resize()
调整画布大小为图容器大小。
```typescript
resize(): void;
```
### Graph.resize(width, height)
调整画布大小为指定宽高。
```typescript
resize(width: number, height: number): void;
```
**参数**
| 参数 | 描述 | 类型 | 默认值 | 必选 |
| ------ | -------- | ------ | ------ | ---- |
| width | 目标宽度 | number | - | ✓ |
| height | 目标高度 | number | - | ✓ |
**示例**
```typescript
// 设置画布大小为800x600
graph.resize(800, 600);
```
## 类型定义
### ViewportAnimationEffectTiming
视口动画配置类型。
```typescript
type ViewportAnimationEffectTiming =
| boolean // 是否启用动画
| {
easing?: string; // 缓动函数
duration?: number; // 动画持续时间(ms)
};
```
### Point
坐标点类型。
```typescript
type Point = [number, number] | [number, number, number] | Float32Array;
```
### FitViewOptions
视图适配选项。
```typescript
interface FitViewOptions {
when?: 'overflow' | 'always'; // 适配时机
direction?: 'x' | 'y' | 'both'; // 适配方向
}
```
Backup Skill
packages/site/docs/backup/CameraSetting.en.md anthropic-skill ~326 tokens---
title: CameraSetting
---
## Options
### <Badge type="success">Required</Badge> type
> _string_
Plugin type
### aspect
> _number \| 'auto'_
Camera viewport aspect ratio, only valid in perspective camera.
- number : Specific aspect ratio
- `'auto'` : Automatically set to the aspect ratio of the canvas
### azimuth
> _number_
Azimuth
### cameraType
> _'orbiting' \| 'exploring' \| 'tracking'_
Camera type
- `'orbiting'`: Fixed viewpoint, change camera position
- `'exploring'`: Similar to orbiting, but allows the camera to rotate between the North Pole and the South Pole
- `'tracking'`: Fixed camera position, change viewpoint
### distance
> _number_ **Default:** `500`
The distance from the camera to the target
### elevation
> _number_
Elevation
### far
> _number_
The position of the far plane
### fov
> _number_
Camera field of view, only valid in perspective camera
### maxDistance
> _number_
Maximum distance
### minDistance
> _number_
Minimum distance
### near
> _number_
The position of the near plane
### projectionMode
> _'perspective' \| 'orthographic'_
Projection mode, perspective projection is only valid in 3D scenes
- `'perspective'` : perspective projection
- `'orthographic'` : Orthogonal projection
### roll
> _number_
Roll
## API
Backup Skill
packages/site/docs/backup/CameraSetting.zh.md anthropic-skill ~269 tokens---
title: CameraSetting 相机设置
---
## 配置项
### <Badge type="success">Required</Badge> type
> _`camera-setting` \| string_
⚠️ **注意**:
- 相机设置插件必须在 3D 场景下使用
- 此插件在使用前需要自行注册:
```javascript
import { register, CameraSetting, ExtensionCategory } from '@antv/g6';
register(ExtensionCategory.PLUGIN, 'camera-setting', CameraSetting); // type: 'camera-setting'
```
### aspect
> _number \| `'auto'`_
相机视口宽高比,仅在透视相机下有效
- number : 具体的宽高比
- `'auto'` : 自动设置为画布的宽高比
### azimuth
> _number_
方位角
### cameraType
> _'orbiting' \| 'exploring' \| 'tracking'_
相机类型
- `'orbiting'`: 固定视点,改变相机位置
- `'exploring'`: 类似 orbiting,但允许相机在北极和南极之间旋转
- `'tracking'`: 固定相机位置,改变视点
### distance
> _number_ **Default:** `500`
相机距离目标的距离
### elevation
> _number_
仰角
### far
> _number_
远平面位置
### fov
> _number_
相机视角,仅在透视相机下有效
### maxDistance
> _number_
最大视距
### minDistance
> _number_
最小视距
### near
> _number_
近平面位置
### projectionMode
> _'perspective' \| 'orthographic'_
投影模式,透视投影仅在 3D 场景下有效
- `'perspective'` : 透视投影
- `'orthographic'` : 正交投影
### roll
> _number_
滚转角
## API
Animation Skill
packages/site/docs/manual/animation/animation.en.md anthropic-skill ~1,805 tokens---
title: Animation Overview
order: 1
---
## Overview
<image width="150px" src="https://mdn.alipayobjects.com/huamei_qa8qxu/afts/img/A*NkILT56xXp4AAAAAAAAAAAAADmJ7AQ/original" />
Animation refers to the state changes of elements over a period of time, such as the position, size, and color of nodes. In G6, animations are often used to enhance user experience and improve the coherence and smoothness of the graph update process.
G6 provides a set of animation paradigms to describe element animations and has built-in some common animation effects. Users can achieve different animation effects by configuring animation parameters.
The implementation of an animation paradigm is as follows:
```typescript
[
{
fields: ['x', 'y'],
},
];
```
The aforementioned animation paradigm indicates that when the `x` and `y` attributes of an element change, an animation will be executed.
## Configure Animation
In G6, animation configuration is divided into global configuration and local configuration. Global configuration is mainly used to set whether animations are enabled globally, the duration of animations, and other parameters. Local configuration is primarily used to set the animation effects for elements.
### Disabled Global Animation
To disable global animations, you can pass the `animation` option when instantiating the `Graph`:
```typescript
{
animation: false,
}
```
### Configure Global Animation
If you want to enable animations and also configure the default duration for the animations, you can pass the `animation` option:
```typescript
{
animation: {
duration: 500,
},
}
```
### Configure Element Animation
For individual elements, you can configure animations at different stages. For example, if you want an element to have a fade-in and fade-out effect when it enters and exits, you can configure it as follows:
```typescript
{
node: {
animation: {
enter: 'fade',
exit: 'fade'
}
}
}
```
If you want to update the position of an element with a translation transition, you can configure it as follows:
```typescript
{
node: {
animation: {
update: 'translate',
}
}
}
```
If you wish to disable animations for an element, you can configure it as follows:
```typescript
{
node: {
animation: false,
}
}
```
## Animation Paradigm
The animation configuration mentioned in the previous section actually used the built-in animation paradigm. This section introduces how to customize the animation paradigm.
:::info{title=Tip}
Before writing an animation paradigm, it is necessary to understand the compositional structure of an element. For details, please refer to the [Element](/en/manual/element/overview) section.
:::
The [Element](/en/manual/element/overview) section mentioned that elements in G6 are composed of one or more atomic graphics. Therefore, the animation of an element is essentially a combination of these atomic shape animations.
Thus, the animation paradigm is an array that describes the animation effects of each atomic shape within the element. For the element itself, it is also a special composite shape and thus has basic shape attributes such as `x`, `y`, etc.
Therefore, you can directly write an animation paradigm for the element itself:
```typescript
[
{
fields: ['x', 'y'],
},
];
```
## Custom Animation
If the built-in animations do not meet your requirements, you can create custom animations. For details, please refer to [Custom Animation](/en/manual/animation/custom-animation).
## Animation Priority
Animation priority refers to the precedence between global animation configuration and element-specific animation configuration. It can be summarized as follows:
| Global Animation Config | Local Animation Config | Whether to Execute Animation |
| ----------------------- | ---------------------- | ------------------------------------------------------------------------------------------------ |
| ✅ true | ✅ true | ✅ Execute animation with default configuration |
| ✅ true | ❌ false | ❌ Won't execute animation |
| ✅ true | ✅ Custom Animation | ✅ Execute animation with local animation configuration |
| ❌ false | ✅ true | ❌ Won't execute animation |
| ❌ false | ❌ false | ❌ Won't execute animation |
| ❌ false | ✅ Custom Animation | ❌ Won't execute animation |
| ✅ Custom Animation | ✅ true | ✅ Execute animation with global animation configuration |
| ✅ Custom Animation | ✅ Custom Animation | ✅ Execute animation, local animation configuration overrides the global animation configuration |
| ✅ Custom Animation | ❌ false | ❌ Won't execute animation |
## Persistent Animation
If you want elements to have persistent animations, such as the undulating effect of nodes or the ant line effect of edges, this can be achieved by customizing the elements. Below is an implementation of an edge with an Ant Line animation provided:
```typescript
import { Line } from '@antv/g6';
class AntLine extends Line {
onCreate() {
this.shapeMap.key.animate([{ lineDashOffset: -20 }, { lineDashOffset: 0 }], {
duration: 500,
iterations: Infinity,
});
}
}
```
The `onCreate` is a lifecycle hook used to execute animations when an element is created.
Configure the edge style in the options as follows:
```typescript
{
edge: {
type: 'ant-line',
style:{
lineDash: [10, 10]
}
}
}
```
<embed src="@/common/manual/core-concept/animation/ant-line.md"></embed>
The `lineDash` is an array for `lineDashOffset`, and the AntLine effect is achieved by continuously varying the `lineDashOffset`.
Similarly, you can also create a breathing effect for nodes:
```typescript
import { Circle } from '@antv/g6';
class BreathingCircle extends Circle {
onCreate() {}
}
```
The `lineDashOffset` is the offset for `lineDash`, and the AntLine effect is achieved by continuously varying the `lineDashOffset`.
Similarly, you can also create a breathing effect for nodes:
```typescript
import { Circle } from '@antv/g6';
class BreathingCircle extends Circle {
onCreate() {
this.shapeMap.halo.animate([{ lineWidth: 5 }, { lineWidth: 10 }], {
duration: 1000,
iterations: Infinity,
direction: 'alternate',
});
}
}
```
Node Style Configuration:
```typescript
{
node: {
type: 'breathing-circle',
style: {
halo: true,
haloLineWidth: 5,
},
},
}
```
<embed src="@/common/manual/core-concept/animation/breathing-circle.md"></embed>
Animation Skill
packages/site/docs/manual/animation/animation.zh.md anthropic-skill ~916 tokens---
title: 动画总览
order: 1
---
## 概述
<image width="150px" src="https://mdn.alipayobjects.com/huamei_qa8qxu/afts/img/A*NkILT56xXp4AAAAAAAAAAAAADmJ7AQ/original" />
动画是指元素在一段时间内的状态变化,例如节点的位置、大小、颜色等。在 G6 中,动画通常用于增强用户体验,提升图更新过程的连贯性和流畅度。
G6 提供了一套动画范式来描述元素动画,并内置了一些常用的动画效果,用户可以通过配置动画参数来实现不同的动画效果。
一个动画范式的实现如下:
```typescript
[
{
fields: ['x', 'y'],
},
];
```
上述动画范式表示当元素的 `x` 和 `y` 属性发生变化时,会执行动画。
## 配置动画
G6 中动画配置分为全局配置和局部配置,全局配置主要用于配置全局是否开启动画、动画时长等参数,局部配置主要用于配置元素的动画效果。
### 关闭全局动画
若要关闭全局动画,可以在实例化 `Graph` 时传入 `animation` 配置项:
```typescript
{
animation: false,
}
```
### 配置全局动画
如果要启用动画且同时配置动画的默认播放时长,可以传入 `animation` 配置项:
```typescript
{
animation: {
duration: 500,
},
}
```
### 配置元素动画
对于单个元素,可以配置其在不同阶段的动画。例如希望元素在进场和退场时具有淡入淡出效果,可以以如下方式配置:
```typescript
{
node: {
animation: {
enter: 'fade',
exit: 'fade'
}
}
}
```
如果希望更新元素位置时是以平移过渡的方式,可以配置如下:
```typescript
{
node: {
animation: {
update: 'translate',
}
}
}
```
如果希望关闭元素的动画,可以配置如下:
```typescript
{
node: {
animation: false,
}
}
```
## 动画范式
上一节中提到的动画配置实际上使用了内置的动画范式,本节介绍如何自定义动画范式。
:::info{title=提示}
在编写动画范式之前需要了解元素的组成结构,具体请参考[元素](/manual/element/overview)一节
:::
[元素](/manual/element/overview)一节中提到:G6 中的元素是由一个或多个原子图形组合而成。因此元素的动画本质上是这些原子图形动画的组合。
因此动画范式是一个数组,用于描述元素中各原子图形的动画效果。对于元素本身来说,其也是一个特殊的复合图形,因此具有基本的图形属性,如 `x`、`y` 等。
因此可以直接为元素本身编写动画范式:
```typescript
[
{
fields: ['x', 'y'],
},
];
```
## 自定义动画
如果内置动画无法满足需求,可以自定义动画,具体请参考[自定义动画](/manual/animation/custom-animation)。
## 动画优先级
动画优先级是指全局动画配置和元素动画配置之前的优先级,可以归纳如下:
| 全局动画配置 | 局部动画配置 | 是否执行动画 |
| ------------ | ------------ | ------------------------------------------------- |
| ✅ true | ✅ true | ✅ 执行动画,以默认动画配置执行 |
| ✅ true | ❌ false | ❌ 不执行该类元素动画 |
| ✅ true | ✅ 配置动画 | ✅ 执行动画,以局部动画配置执行 |
| ❌ false | ✅ true | ❌ 不执行任何动画 |
| ❌ false | ❌ false | ❌ 不执行任何动画 |
| ❌ false | ✅ 配置动画 | ❌ 不执行任何动画 |
| ✅ 配置动画 | ✅ true | ✅ 执行动画,以全局动画配置执行 |
| ✅ 配置动画 | ✅ 配置动画 | ✅ 执行动画,将局部动画配置覆盖全局动画配置后执行 |
| ✅ 配置动画 | ❌ false | ❌ 不执行该类元素动画 |
## 持续动画
如果希望元素具有持续动画,例如节点的波动效果、边的蚂蚁线效果等,可以通过自定义元素方式实现,下面提供一个具有蚂蚁线(Ant Line)动画的边的实现:
```typescript
import { Line } from '@antv/g6';
class AntLine extends Line {
onCreate() {
this.shapeMap.key.animate([{ lineDashOffset: -20 }, { lineDashOffset: 0 }], {
duration: 500,
iterations: Infinity,
});
}
}
```
其中 `onCreate` 是一个生命周期钩子,用于在元素创建时执行动画。
在 options 中配置边样式:
```typescript
{
edge: {
type: 'ant-line',
style:{
lineDash: [10, 10]
}
}
}
```
<embed src="@/common/manual/core-concept/animation/ant-line.md"></embed>
其中 `lineDash` 是 `lineDashOffset` 的数组,通过不断变化 `lineDashOffset` 来实现飞线效果。
同样的,还可以实现节点的呼吸效果:
```typescript
import { Circle } from '@antv/g6';
class BreathingCircle extends Circle {
onCreate() {}
}
```
其中 `lineDashOffset` 是 `lineDash` 的偏移量,通过不断变化 `lineDashOffset` 来实现飞线效果。
同样的,还可以实现节点的呼吸效果:
```typescript
import { Circle } from '@antv/g6';
class BreathingCircle extends Circle {
onCreate() {
this.shapeMap.halo.animate([{ lineWidth: 5 }, { lineWidth: 10 }], {
duration: 1000,
iterations: Infinity,
direction: 'alternate',
});
}
}
```
节点样式配置:
```typescript
{
node: {
type: 'breathing-circle',
style: {
halo: true,
haloLineWidth: 5,
},
},
}
```
<embed src="@/common/manual/core-concept/animation/breathing-circle.md"></embed>
Animation Skill
packages/site/docs/manual/animation/custom-animation.en.md anthropic-skill ~698 tokens---
title: Custom Animation
order: 2
---
## Overview
## Implement Animation
For circular node (Circle) elements, the main shape is a circle. Now, let's create an animation for it so that when the size of the node changes, it transitions with a scaling animation:
```typescript
[
{
fields: ['r'],
shape: 'key',
},
];
```
Now let's create a graph instance and update the element size to trigger the update animation:
```typescript
const graph = new Graph({
container: 'container',
width: 50,
height: 50,
data: {
nodes: [{ id: 'node-1', style: { x: 25, y: 25, size: 20 } }],
},
node: {
animation: {
update: [{ fields: ['r'], shape: 'key' }],
},
},
});
graph.draw().then(() => {
graph.updateNodeData([{ id: 'node-1', style: { size: 40 } }]);
graph.draw();
});
```
> ⬇️ Move the pointer to the graph below and click the play button on the left to replay
<embed src="@/common/manual/custom-extension/animation/implement-animation.md"></embed>
#### Principle Analysis
When animating an element, the element converts its animation frame parameters into animation frame parameters for its individual sub-graphics and executes the corresponding animations.
In the example above, by updating the node size, an animation was performed on the node, and its animation frame parameters were:
```json
[{ "size": 20 }, { "size": 40 }]
```
After obtaining the attribute, the node element converts it into animation frame parameters for the main shape (circle):
```json
[{ "r": 10 }, { "r": 20 }]
```
Therefore, what is ultimately happening here is that a transition animation is being performed on the circle, changing its radius from 10 to 20.
#### Composite Animation
By directly combining the position change animation with the size change animation into a single animation paradigm, you can obtain a composite animation paradigm:
```typescript
[
{
fields: ['x', 'y'],
},
{
fields: ['r'],
shape: 'key',
},
];
```
And update both the position and size of the node simultaneously:
```typescript
graph.updateNodeData([{ id: 'node-1', style: { x: 175, size: 40 } }]);
graph.draw();
```
> ⬇️ Move the pointer to the graph below and click the play button on the left to replay
<embed src="@/common/manual/custom-extension/animation/composite-animation-1.md"></embed>
Add color transition:
```typescript
[
{
fields: ['x', 'y'],
},
{
fields: ['r', 'fill'],
shape: 'key',
},
];
```
Execute node update:
```typescript
graph.updateNodeData([{ id: 'node-1', style: { x: 175, size: 40, fill: 'pink' } }]);
graph.draw();
```
> ⬇️ Move the pointer to the graph below and click the play button on the left to replay
<embed src="@/common/manual/custom-extension/animation/composite-animation-2.md"></embed>
Animation Skill
packages/site/docs/manual/animation/custom-animation.zh.md anthropic-skill ~435 tokens---
title: 自定义动画
order: 2
---
## 概述
## 实现动画
对于圆形节点(Circle)元素,其主图形是一个圆形,现在为其编写一个动画,当节点的尺寸发生变化时,能够以缩放的方式进行过渡动画:
```typescript
[
{
fields: ['r'],
shape: 'key',
},
];
```
下面我们创建一个图实例并更新元素尺寸来触发更新动画:
```typescript
const graph = new Graph({
container: 'container',
width: 50,
height: 50,
data: {
nodes: [{ id: 'node-1', style: { x: 25, y: 25, size: 20 } }],
},
node: {
animation: {
update: [{ fields: ['r'], shape: 'key' }],
},
},
});
graph.draw().then(() => {
graph.updateNodeData([{ id: 'node-1', style: { size: 40 } }]);
graph.draw();
});
```
> ⬇️ 指针移动至下方图中,并点击左侧播放按钮进行重新播放
<embed src="@/common/manual/custom-extension/animation/implement-animation.md"></embed>
#### 原理分析
当对一个元素执行动画时,该元素会将其动画帧参数转化为其各个子图形上的动画帧参数,并执行对应的动画。
在上面的例子中,通过更新节点尺寸(size),对该节点执行了动画,其动画帧参数为:
```json
[{ "size": 20 }, { "size": 40 }]
```
节点元素拿到该属性后,将其转化为主图形(圆形)的动画帧参数:
```json
[{ "r": 10 }, { "r": 20 }]
```
因此这里最终是对圆形执行了半径从 10 到 20 的过渡动画。
#### 复合动画
直接将位置变化动画和尺寸变化动画合并到一个动画范式即可得到复合动画范式:
```typescript
[
{
fields: ['x', 'y'],
},
{
fields: ['r'],
shape: 'key',
},
];
```
并同时更新该节点的位置和尺寸:
```typescript
graph.updateNodeData([{ id: 'node-1', style: { x: 175, size: 40 } }]);
graph.draw();
```
> ⬇️ 指针移动至下方图中,并点击左侧播放按钮进行重新播放
<embed src="@/common/manual/custom-extension/animation/composite-animation-1.md"></embed>
加入颜色过渡:
```typescript
[
{
fields: ['x', 'y'],
},
{
fields: ['r', 'fill'],
shape: 'key',
},
];
```
执行节点更新:
```typescript
graph.updateNodeData([{ id: 'node-1', style: { x: 175, size: 40, fill: 'pink' } }]);
graph.draw();
```
> ⬇️ 指针移动至下方图中,并点击左侧播放按钮进行重新播放
<embed src="@/common/manual/custom-extension/animation/composite-animation-2.md"></embed>
Behavior Skill
packages/site/docs/manual/behavior/AutoAdaptLabel.en.md anthropic-skill ~2,139 tokens---
title: AutoAdaptLabel
order: 1
---
## Overview
Auto-adapt label display is a dynamic label management strategy designed to intelligently adjust which labels should be displayed or hidden based on factors such as spatial allocation of the current visible range and node importance. By analyzing the visible area in real-time, it ensures that users receive the most relevant and clear information display in different interaction scenarios, while avoiding visual overload and information redundancy.
## Usage Scenarios
This interaction is mainly used for:
- Node size changes
- Graph scaling
## Online Experience
<embed src="@/common/api/behaviors/auto-adapt-label.md"></embed>
## Basic Usage
Add this interaction in the graph configuration
**1. Quick Configuration (Static)**
Declare directly using a string form. This method is simple but only supports default configuration and cannot be dynamically modified after configuration:
```javascript
const graph = new Graph({
// Other configurations...
behaviors: ['auto-adapt-label'],
});
```
**2. Object Configuration (Recommended)**
Configure using an object form, supporting custom parameters, and can dynamically update the configuration at runtime:
```javascript
const graph = new Graph({
// Other configurations...
behaviors: [
{
type: 'auto-adapt-label',
throttle: 200, // Throttle time
padding: 10, // Extra spacing when detecting overlap
},
],
});
```
## Configuration Options
| Option | Description | Type | Default | Required |
| --------- | ------------------------------------------------------------------------------------------------------------------------------------------------------------------------------------------------------------------------------------------------------------------------------------------------ | --------------------------------------------------------------------------------------------------------------------------------- | ------------------ | -------- |
| type | Interaction type name | string | `auto-adapt-label` | √ |
| enable | Whether to enable this interaction | boolean \| ((event: [Event](/en/api/event#event-object-properties)) => boolean) | true | |
| throttle | Label update throttle time (ms) | number | 100 | |
| padding | Extra spacing when detecting label overlap | number \| number[] | 0 | |
| sort | Custom sorting function, sorting elements from high to low importance, with higher importance elements having higher label display priority. Generally, combo > node > edge | (a: ElementDatum, b: ElementDatum) => -1 \| 0 \| 1 | | |
| sortNode | Sort nodes from high to low importance, with higher importance nodes having higher label display priority. Several built-in [centrality algorithms](#nodecentralityoptions) are available, or a custom sorting function can be used. Note that if `sort` is set, `sortNode` will not take effect | [NodeCentralityOptions](#nodecentralityoptions) \| (nodeA: [NodeData](/en/manual/data#nodedata), nodeB: NodeData => -1 \| 0 \| 1) | `type: 'degree'` | |
| sortEdge | Sort edges from high to low importance, with higher importance edges having higher label display priority. By default, it is sorted according to the order of data. Note that if `sort` is set, `sortEdge` will not take effect | (edgeA: [EdgeData](/en/manual/data#edgedata), edgeB: EdgeData) => -1 \| 0 \| 1 | | |
| sortCombo | Sort groups from high to low importance, with higher importance groups having higher label display priority. By default, it is sorted according to the order of data. Note that if `sort` is set, `sortCombo` will not take effect | (comboA: [ComboData](/en/manual/data#combodata), comboB: ComboData) => -1 \| 0 \| 1 | | |
### NodeCentralityOptions
Methods for measuring node centrality
- `'degree'`: Degree centrality, measured by the degree of the node (number of connected edges). Nodes with high degree centrality usually have more direct connections and may play important roles in the network
- `'betweenness'`: Betweenness centrality, measured by the number of times a node appears in all shortest paths. Nodes with high betweenness centrality usually act as bridges in the network, controlling the flow of information
- `'closeness'`: Closeness centrality, measured by the reciprocal of the sum of the shortest path lengths from the node to all other nodes. Nodes with high closeness centrality can usually reach other nodes in the network more quickly
- `'eigenvector'`: Eigenvector centrality, measured by the degree of connection of the node to other central nodes. Nodes with high eigenvector centrality are usually connected to other important nodes
- `'pagerank'`: PageRank centrality, measured by the number of times a node is referenced by other nodes, commonly used in directed graphs. Nodes with high PageRank centrality usually have high influence in the network, similar to webpage ranking algorithms
```typescript
type NodeCentralityOptions =
| { type: 'degree'; direction?: 'in' | 'out' | 'both' }
| { type: 'betweenness'; directed?: boolean; weightPropertyName?: string }
| { type: 'closeness'; directed?: boolean; weightPropertyName?: string }
| { type: 'eigenvector'; directed?: boolean }
| { type: 'pagerank'; epsilon?: number; linkProb?: number };
```
## Practical Example
```js | ob { inject: true }
import { Graph } from '@antv/g6';
const data = {
nodes: [
{ id: 'node1', style: { x: 200, y: 100, labelText: '短标签' } },
{ id: 'node2', style: { x: 360, y: 100, labelText: '中等长度的标签' } },
{ id: 'node3', style: { x: 280, y: 220, labelText: '这是一个非常非常长的标签,需要自适应显示' } },
],
edges: [
{ source: 'node1', target: 'node2' },
{ source: 'node1', target: 'node3' },
{ source: 'node2', target: 'node3' },
],
};
const graph = new Graph({
container: 'container',
data,
behaviors: [
'zoom-canvas',
'drag-canvas',
{
key: 'auto-adapt-label',
type: 'auto-adapt-label',
padding: 0,
throttle: 200,
},
],
plugins: [{ type: 'grid-line', size: 30 }],
animation: true,
});
graph.render();
```
Behavior Skill
packages/site/docs/manual/behavior/AutoAdaptLabel.zh.md anthropic-skill ~1,425 tokens---
title: 标签自适应显示 AutoAdaptLabel
order: 1
---
## 概述
标签自适应显示是一种动态标签管理策略,旨在根据当前可视范围的空间分配、节点重要性等因素,智能调整哪些标签应显示或隐藏。通过对可视区域的实时分析,确保用户在不同的交互场景下获得最相关最清晰的信息展示,同时避免视觉过载和信息冗余。
## 使用场景
这一交互主要用于:
- 节点尺寸变化
- 图形缩放
## 在线体验
<embed src="@/common/api/behaviors/auto-adapt-label.md"></embed>
## 基本用法
在图配置中添加这一交互
**1. 快速配置(静态)**
使用字符串形式直接声明,这种方式简洁但仅支持默认配置,且配置后不可动态修改:
```javascript
const graph = new Graph({
// 其他配置...
behaviors: ['auto-adapt-label'],
});
```
**2. 对象配置(推荐)**
使用对象形式进行配置,支持自定义参数,且可以在运行时动态更新配置:
```javascript
const graph = new Graph({
// 其他配置...
behaviors: [
{
type: 'auto-adapt-label',
throttle: 200, // 节流时间
padding: 10, // 检测重叠时的额外间距
},
],
});
```
## 配置项
| 配置项 | 说明 | 类型 | 默认值 | 必选 |
| --------- | ------------------------------------------------------------------------------------------------------------------------------------------------------------------------------------------- | -------------------------------------------------------------------------------------------------------------------------------------- | ------------------ | ---- |
| type | 交互类型名称 | string | `auto-adapt-label` | √ |
| enable | 是否启用该交互 | boolean \| ((event: [Event](/api/event#事件对象属性)) => boolean) | true | |
| throttle | 标签更新节流时间(ms) | number | 100 | |
| padding | 标签检测重叠时的额外间距 | number \| number[] | 0 | |
| sort | 自定义排序函数,根据元素的重要性从高到低排序,重要性越高的元素其标签显示优先级越高。一般情况下 combo > node > edge | (a: ElementDatum, b: ElementDatum) => -1 \| 0 \| 1 | | |
| sortNode | 根据节点的重要性从高到低排序,重要性越高的节点其标签显示优先级越高。内置几种[中心性算法](#nodecentralityoptions),也可以自定义排序函数。需要注意,如果设置了 `sort`,则 `sortNode` 不会生效 | [NodeCentralityOptions](#nodecentralityoptions) \| (nodeA: [NodeData](/manual/data#节点数据nodedata), nodeB: NodeData => -1 \| 0 \| 1) | `type: 'degree'` | |
| sortEdge | 根据边的重要性从高到低排序,重要性越高的边其标签显示优先级越高。默认按照数据先后进行排序。需要注意,如果设置了 `sort`,则 `sortEdge` 不会生效 | (edgeA: [EdgeData](/manual/data#边数据edgedata), edgeB: EdgeData) => -1 \| 0 \| 1 | | |
| sortCombo | 根据群组的重要性从高到低排序,重要性越高的群组其标签显示优先级越高。默认按照数据先后进行排序。需要注意,如果设置了 `sort`,则 `sortCombo` 不会生效 | (comboA: [ComboData](/manual/data#组合数据combodata), comboB: ComboData) => -1 \| 0 \| 1 | | |
### NodeCentralityOptions
节点中心性的度量方法
- `'degree'`:度中心性,通过节点的度数(连接的边的数量)来衡量其重要性。度中心性高的节点通常具有较多的直接连接,在网络中可能扮演着重要的角色
- `'betweenness'`:介数中心性,通过节点在所有最短路径中出现的次数来衡量其重要性。介数中心性高的节点通常在网络中起到桥梁作用,控制着信息的流动
- `'closeness'`:接近中心性,通过节点到其他所有节点的最短路径长度总和的倒数来衡量其重要性。接近中心性高的节点通常能够更快地到达网络中的其他节点
- `'eigenvector'`:特征向量中心性,通过节点与其他中心节点的连接程度来衡量其重要性。特征向量中心性高的节点通常连接着其他重要节点
- `'pagerank'`:PageRank 中心性,通过节点被其他节点引用的次数来衡量其重要性,常用于有向图。PageRank 中心性高的节点通常在网络中具有较高的影响力,类似于网页排名算法
```typescript
type NodeCentralityOptions =
| { type: 'degree'; direction?: 'in' | 'out' | 'both' }
| { type: 'betweenness'; directed?: boolean; weightPropertyName?: string }
| { type: 'closeness'; directed?: boolean; weightPropertyName?: string }
| { type: 'eigenvector'; directed?: boolean }
| { type: 'pagerank'; epsilon?: number; linkProb?: number };
```
## 实际案例
```js | ob { inject: true }
import { Graph } from '@antv/g6';
const data = {
nodes: [
{ id: 'node1', style: { x: 200, y: 100, labelText: '短标签' } },
{ id: 'node2', style: { x: 360, y: 100, labelText: '中等长度的标签' } },
{ id: 'node3', style: { x: 280, y: 220, labelText: '这是一个非常非常长的标签,需要自适应显示' } },
],
edges: [
{ source: 'node1', target: 'node2' },
{ source: 'node1', target: 'node3' },
{ source: 'node2', target: 'node3' },
],
};
const graph = new Graph({
container: 'container',
data,
behaviors: [
'zoom-canvas',
'drag-canvas',
{
key: 'auto-adapt-label',
type: 'auto-adapt-label',
padding: 0,
throttle: 200,
},
],
plugins: [{ type: 'grid-line', size: 30 }],
animation: true,
});
graph.render();
```
Behavior Skill
packages/site/docs/manual/behavior/BrushSelect.en.md anthropic-skill ~4,542 tokens---
title: BrushSelect
order: 2
---
## Overview
Brush select allows users to click and drag a box to enclose elements, selecting the elements within the box.
## Usage Scenarios
This interaction is mainly used for:
- Quickly selecting a batch of elements
- Quickly deselecting a batch of elements
## Online Experience
<embed src="@/common/api/behaviors/brush-select.md"></embed>
## Basic Usage
Add this interaction in the graph configuration:
**1. Quick Configuration (Static)**
Declare directly using a string form. This method is simple but only supports default configuration and cannot be dynamically modified after configuration:
```javascript
const graph = new Graph({
// Other configurations...
behaviors: ['brush-select'],
});
```
**2. Object Configuration (Recommended)**
Configure using an object form, supporting custom parameters, and can dynamically update the configuration at runtime:
```javascript
const graph = new Graph({
// Other configurations...
behaviors: [
{
type: 'brush-select',
key: 'brush-select-1',
immediately: true, // Elements are immediately selected as the box encloses them
trigger: ['shift', 'alt', 'control'], // Use multiple keys for selection
},
],
});
```
## Configuration Options
| Option | Description | Type | Default | Required |
| -------------- | ---------------------------------------------------------------------------------------------------------------------------------------------------------------------------------------------------------------------------------------------------------------------------------------------------------------------------------------------------------------------------------------------------------------------------------------------------------------------------------------------------------------------------- | -------------------------------------------------------------------------------- | ------------------------- | -------- |
| type | Interaction type name. This plugin is built-in, and you can use it with `type: 'brush-select'`. | `brush-select` \| string | `brush-select` | ✓ |
| animation | Whether to enable animation | boolean | false | |
| enable | Whether to enable brush select functionality | boolean \| ((event: [Event](/en/api/event#event-object-properties)) => boolean) | true | |
| enableElements | Types of elements that can be selected | ( `node` \| `edge` \| `combo` )[] | [`node`, `combo`, `edge`] | |
| immediately | Whether to select immediately, only effective when [selection mode](#mode) is `default`, [example](#immediately) | boolean | false | |
| mode | Selection mode, [example](#mode) | `union` \| `intersect` \| `diff` \| `default` | `default` | |
| onSelect | Callback for selected element state | (states:Record<string,string\|string[]>) =>Record<string,string\|string[]> | | |
| state | Switch to this state when selected | string \| `selected` \| `active` \| `inactive` \| `disabled` \| `highlight` | `selected` | |
| style | Specify the style of the selection box, [configuration options](#style) | | See below | |
| trigger | Press this shortcut key in combination with a mouse click to perform selection **Key reference:** _<a href="https://developer.mozilla.org/en-US/docs/Web/API/UI_Events/Keyboard_event_key_values" target="_blank" rel="noopener noreferrer">MDN Key Values</a>_. If set to an **empty array**, it means selection can be performed with a mouse click without pressing other keys <br/> ⚠️ Note, setting `trigger` to `['drag']` will cause the `drag-canvas` behavior to fail. The two cannot be configured simultaneously. | string[] \| (`Control` \| `Shift`\| `Alt` \| `......`)[] | [`shift`] | |
### immediately
Whether to select immediately, only effective when selection mode is `default`
```js
const graph = new Graph({
behaviors: [
{
type: 'brush-select',
key: 'brush-select',
immediately: true, // Elements are immediately selected as the box encloses them
trigger: [], // No need to press other keys, just click and drag the mouse to select
},
],
});
```
```js | ob { pin: false, inject: true }
import { Graph } from '@antv/g6';
const graph = new Graph({
container: 'container',
width: 400,
height: 200,
data: {
nodes: [
{ id: 'node-1', style: { x: 100, y: 50 } },
{ id: 'node-2', style: { x: 260, y: 50 } },
{ id: 'node-3', style: { x: 280, y: 100 } },
],
edges: [
{ source: 'node-1', target: 'node-2' },
{ source: 'node-1', target: 'node-3' },
{ source: 'node-2', target: 'node-3' },
],
},
node: {
style: { fill: '#7e3feb' },
},
edge: {
stroke: '#8b9baf',
},
behaviors: [
{
type: 'brush-select',
key: 'brush-select',
immediately: true, // Immediate selection
trigger: [],
},
],
plugins: [{ type: 'grid-line', size: 30 }],
});
graph.render();
```
### mode
Four selection modes are built-in:
- `union`: Retain the current state of selected elements and add the specified state.
- `intersect`: If the selected elements already have the specified state, retain it; otherwise, clear the state.
- `diff`: Invert the specified state of the selected elements.
- `default`: Clear the current state of selected elements and add the specified state.
```js
const graph = new Graph({
behaviors: [
{
type: 'brush-select',
key: 'brush-select',
mode: 'default', // Selection mode, default selection mode
},
],
});
```
```js | ob { pin: false }
createGraph(
{
data: {
nodes: [
{ id: 'node-1', style: { x: 200, y: 100 } },
{ id: 'node-2', style: { x: 360, y: 100 } },
{ id: 'node-3', style: { x: 280, y: 220 } },
],
edges: [
{ source: 'node-1', target: 'node-2' },
{ source: 'node-1', target: 'node-3' },
{ source: 'node-2', target: 'node-3' },
],
},
node: {
style: { fill: '#7e3feb' },
state: {
custom: { fill: '#ffa940' },
},
},
edge: {
stroke: '#8b9baf',
state: {
custom: { stroke: '#ffa940' },
},
},
behaviors: [
{
type: 'brush-select',
key: 'brush-select',
trigger: [],
immediately: true,
},
],
plugins: [{ type: 'grid-line', size: 30 }],
animation: true,
},
{ width: 600, height: 300 },
(gui, graph) => {
const options = {
key: 'brush-select',
type: 'brush-select',
animation: false,
enable: true,
enableElements: ['node', 'edge', 'combo'],
mode: 'default',
state: 'selected',
};
const optionFolder = gui.addFolder('BrushSelect Options');
optionFolder.add(options, 'type').disable(true);
optionFolder.add(options, 'state', ['active', 'selected', 'custom']);
optionFolder.add(options, 'mode', ['union', 'intersect', 'diff', 'default']);
// .onChange((e) => {
// immediately.show(e === 'default');
// });
optionFolder.onChange(({ property, value }) => {
graph.updateBehavior({
key: 'brush-select',
[property]: value,
});
graph.render();
});
},
);
```
### style
| Attribute | Description | Type | Default |
| ----------------- | ------------------------- | ---------------------------------------- | --------- |
| cursor | Mouse style | string | |
| fill | Fill color | string \| Pattern \| null | `#1677FF` |
| fillOpacity | Fill opacity | number \| string | 0.1 |
| isBillboard | Enable billboard mode | boolean | |
| isSizeAttenuation | Enable size attenuation | boolean | |
| lineCap | Line end style | `butt` \| `round` \| `square` | |
| lineDash | Dash configuration | number \| string \| (string \| number)[] | |
| lineDashOffset | Dash offset | number | |
| lineJoin | Line join style | `miter` \| `round` \| `bevel` | |
| lineWidth | Line width | number \| string | 1 |
| opacity | Overall opacity | number \| string | |
| radius | Rectangle corner radius | number \| string \| number[] | |
| shadowBlur | Shadow blur degree | number | |
| shadowColor | Shadow color | string | |
| shadowOffsetX | Shadow X direction offset | number | |
| shadowOffsetY | Shadow Y direction offset | number | |
| stroke | Stroke color | string \| Pattern \| null | `#1677FF` |
| strokeOpacity | Stroke opacity | number \| string | |
| visibility | Visibility | `visible` \| `hidden` | |
| zIndex | Rendering level | number | 2 |
**Example**:
```js
const graph = new Graph({
behaviors: [
{
type: 'brush-select',
key: 'brush-select',
style: {
width: 0,
height: 0,
lineWidth: 4,
lineDash: [2, 2], // Dashed outline
// RGB super colorful box
fill: 'linear-gradient(217deg, rgba(255,0,0,.8), rgba(255,0,0,0) 70.71%),linear-gradient(127deg, rgba(0,255,0,.8), rgba(0,255,0,0) 70.71%),linear-gradient(336deg, rgba(0,0,255,.8), rgba(0,0,255,0) 70.71%)',
stroke: 'pink',
fillOpacity: 0.2,
zIndex: 2,
pointerEvents: 'none',
},
},
],
});
```
```js | ob { pin: false, inject: true }
import { Graph } from '@antv/g6';
const graph = new Graph({
container: 'container',
width: 600,
height: 300,
data: {
nodes: [
{ id: 'node-1', style: { x: 200, y: 100 } },
{ id: 'node-2', style: { x: 360, y: 100 } },
{ id: 'node-3', style: { x: 280, y: 220 } },
],
edges: [
{ source: 'node-1', target: 'node-2' },
{ source: 'node-1', target: 'node-3' },
{ source: 'node-2', target: 'node-3' },
],
},
node: {
style: { fill: '#7e3feb' },
},
edge: {
stroke: '#8b9baf',
},
behaviors: [
{
type: 'brush-select',
key: 'brush-select',
trigger: [],
immediately: true,
style: {
width: 0,
height: 0,
lineWidth: 4,
lineDash: [2, 2], // Dashed outline
// RGB super colorful box
fill: 'linear-gradient(217deg, rgba(255,0,0,.8), rgba(255,0,0,0) 70.71%),linear-gradient(127deg, rgba(0,255,0,.8), rgba(0,255,0,0) 70.71%),linear-gradient(336deg, rgba(0,0,255,.8), rgba(0,0,255,0) 70.71%)',
stroke: 'pink',
fillOpacity: 0.2,
zIndex: 2,
pointerEvents: 'none',
},
},
],
plugins: [{ type: 'grid-line', size: 30 }],
animation: true,
});
graph.render();
```
### Practical Example
```js | ob { inject: true }
import { Graph } from '@antv/g6';
const graph = new Graph({
container: 'container',
data: {
nodes: [
{ id: 'node-1', style: { x: 200, y: 250 } },
{ id: 'node-2', style: { x: 250, y: 200 } },
{ id: 'node-3', style: { x: 300, y: 250 } },
{ id: 'node-4', style: { x: 250, y: 300 } },
],
edges: [
{ source: 'node-1', target: 'node-2' },
{ source: 'node-2', target: 'node-3' },
{ source: 'node-3', target: 'node-4' },
{ source: 'node-4', target: 'node-1' },
],
},
behaviors: [
{
key: 'brush-select',
type: 'brush-select',
enable: true,
animation: false,
mode: 'default', // union intersect diff default
state: 'selected', // 'active', 'selected', 'inactive', ...
trigger: [], // ['Shift', 'Alt', 'Control', 'Drag', 'Meta', ...]
style: {
width: 0,
height: 0,
lineWidth: 4,
lineDash: [2, 2],
fill: 'linear-gradient(217deg, rgba(255,0,0,.8), rgba(255,0,0,0) 70.71%),linear-gradient(127deg, rgba(0,255,0,.8), rgba(0,255,0,0) 70.71%),linear-gradient(336deg, rgba(0,0,255,.8), rgba(0,0,255,0) 70.71%)',
stroke: 'pink',
fillOpacity: 0.2,
zIndex: 2,
pointerEvents: 'none',
},
},
],
});
graph.render();
```
Behavior Skill
packages/site/docs/manual/behavior/BrushSelect.zh.md anthropic-skill ~3,729 tokens---
title: 框选 BrushSelect
order: 2
---
## 概述
鼠标点击拖一个框笼罩元素,框选范围内的元素会被选中。
## 使用场景
这一交互主要用于:
- 快速选中一批元素
- 快速取消选中一批元素
## 在线体验
<embed src="@/common/api/behaviors/brush-select.md"></embed>
## 基本用法
在图配置中添加这一交互:
**1. 快速配置(静态)**
使用字符串形式直接声明,这种方式简洁但仅支持默认配置,且配置后不可动态修改:
```javascript
const graph = new Graph({
// 其他配置...
behaviors: ['brush-select'],
});
```
**2. 对象配置(推荐)**
使用对象形式进行配置,支持自定义参数,且可以在运行时动态更新配置:
```javascript
const graph = new Graph({
// 其他配置...
behaviors: [
{
type: 'brush-select',
key: 'brush-select-1',
immediately: true, // 可以看到框框笼罩过去时,元素立即被框选了
trigger: ['shift', 'alt', 'control'], // 配合多种按键进行框选
},
],
});
```
## 配置项
| 配置项 | 说明 | 类型 | 默认值 | 必选 |
| -------------- | ------------------------------------------------------------------------------------------------------------------------------------------------------------------------------------------------------------------------------------------------------------------------------------------------------------------------------------------------------------------------------- | -------------------------------------------------------------------------------- | ------------------------- | ---- |
| type | 交互类型名称。此插件已内置,你可以通过 `type: 'brush-select'` 来使用它。 | `brush-select` \| string | `brush-select` | ✓ |
| animation | 是否启用动画 | boolean | false | |
| enable | 是否启用框选功能 | boolean \| ((event: [Event](/api/event#事件对象属性)) => boolean) | true | |
| enableElements | 可框选的元素类型 | ( `node` \| `edge` \| `combo` )[] | [`node`, `combo`, `edge`] | |
| immediately | 是否及时框选, 仅在 [框选模式 mode](#mode) 为 `default` 时生效,[示例](#immediately) | boolean | false | |
| mode | 框选的选择模式,[示例](#mode) | `union` \| `intersect` \| `diff` \| `default` | `default` | |
| onSelect | 框选元素状态回调 | (states:Record<string,string\|string[]>) =>Record<string,string\|string[]> | | |
| state | 被选中时切换到该状态 | string \| `selected` \| `active` \| `inactive` \| `disabled` \| `highlight` | `selected` | |
| style | 指定框选时的框样式,[配置项](#style) | | 见下文 | |
| trigger | 按下该快捷键配合鼠标点击进行框选 **按键参考:** _<a href="https://developer.mozilla.org/zh-CN/docs/Web/API/UI_Events/Keyboard_event_key_values" target="_blank" rel="noopener noreferrer">MDN Key Values</a>_ 。若设为**空数组**时则表示鼠标点击进行框选,不需要按下其他按键配合 <br/> ⚠️ 注意,`trigger` 设置为 `['drag']` 时会导致 `drag-canvas` 行为失效。两者不可同时配置。 | string[] \| (`Control` \| `Shift`\| `Alt` \| `......`)[] | [`shift`] | |
### immediately
是否及时框选, 仅在框选模式为 `default` 时生效
```js
const graph = new Graph({
behaviors: [
{
type: 'brush-select',
key: 'brush-select',
immediately: true, // 可以看到框框笼罩过去时,元素立即被框选了
trigger: [], // 不需要配合其他按键,点击鼠标拖动即可框选
},
],
});
```
```js | ob { pin: false, inject: true }
import { Graph } from '@antv/g6';
const graph = new Graph({
container: 'container',
width: 400,
height: 200,
data: {
nodes: [
{ id: 'node-1', style: { x: 100, y: 50 } },
{ id: 'node-2', style: { x: 260, y: 50 } },
{ id: 'node-3', style: { x: 280, y: 100 } },
],
edges: [
{ source: 'node-1', target: 'node-2' },
{ source: 'node-1', target: 'node-3' },
{ source: 'node-2', target: 'node-3' },
],
},
node: {
style: { fill: '#7e3feb' },
},
edge: {
stroke: '#8b9baf',
},
behaviors: [
{
type: 'brush-select',
key: 'brush-select',
immediately: true, // 立即框选
trigger: [],
},
],
plugins: [{ type: 'grid-line', size: 30 }],
});
graph.render();
```
### mode
内置支持四种框选的选择模式:
- `union`:保持已选元素的当前状态,并添加指定的 state 状态。
- `intersect`:如果已选元素已有指定的 state 状态,则保留;否则清除该状态。
- `diff`:对已选元素的指定 state 状态进行取反操作。
- `default`:清除已选元素的当前状态,并添加指定的 state 状态。
```js
const graph = new Graph({
behaviors: [
{
type: 'brush-select',
key: 'brush-select',
mode: 'default', // 框选模式, 默认框选模式
},
],
});
```
```js | ob { pin: false }
createGraph(
{
data: {
nodes: [
{ id: 'node-1', style: { x: 200, y: 100 } },
{ id: 'node-2', style: { x: 360, y: 100 } },
{ id: 'node-3', style: { x: 280, y: 220 } },
],
edges: [
{ source: 'node-1', target: 'node-2' },
{ source: 'node-1', target: 'node-3' },
{ source: 'node-2', target: 'node-3' },
],
},
node: {
style: { fill: '#7e3feb' },
state: {
custom: { fill: '#ffa940' },
},
},
edge: {
stroke: '#8b9baf',
state: {
custom: { stroke: '#ffa940' },
},
},
behaviors: [
{
type: 'brush-select',
key: 'brush-select',
trigger: [],
immediately: true,
},
],
plugins: [{ type: 'grid-line', size: 30 }],
animation: true,
},
{ width: 600, height: 300 },
(gui, graph) => {
const options = {
key: 'brush-select',
type: 'brush-select',
animation: false,
enable: true,
enableElements: ['node', 'edge', 'combo'],
mode: 'default',
state: 'selected',
};
const optionFolder = gui.addFolder('BrushSelect Options');
optionFolder.add(options, 'type').disable(true);
optionFolder.add(options, 'state', ['active', 'selected', 'custom']);
optionFolder.add(options, 'mode', ['union', 'intersect', 'diff', 'default']);
// .onChange((e) => {
// immediately.show(e === 'default');
// });
optionFolder.onChange(({ property, value }) => {
graph.updateBehavior({
key: 'brush-select',
[property]: value,
});
graph.render();
});
},
);
```
### style
| 属性 | 描述 | 类型 | 默认值 |
| ----------------- | ------------------ | ---------------------------------------- | --------- |
| cursor | 鼠标样式 | string | |
| fill | 填充颜色 | string \| Pattern \| null | `#1677FF` |
| fillOpacity | 填充透明度 | number \| string | 0.1 |
| isBillboard | 是否启用公告牌模式 | boolean | |
| isSizeAttenuation | 是否启用大小衰减 | boolean | |
| lineCap | 线段端点样式 | `butt` \| `round` \| `square` | |
| lineDash | 虚线配置 | number \| string \| (string \| number)[] | |
| lineDashOffset | 虚线偏移量 | number | |
| lineJoin | 线段连接处样式 | `miter` \| `round` \| `bevel` | |
| lineWidth | 线宽度 | number \| string | 1 |
| opacity | 整体透明度 | number \| string | |
| radius | 矩形圆角半径 | number \| string \| number[] | |
| shadowBlur | 阴影模糊程度 | number | |
| shadowColor | 阴影颜色 | string | |
| shadowOffsetX | 阴影 X 方向偏移 | number | |
| shadowOffsetY | 阴影 Y 方向偏移 | number | |
| stroke | 描边颜色 | string \| Pattern \| null | `#1677FF` |
| strokeOpacity | 描边透明度 | number \| string | |
| visibility | 可见性 | `visible` \| `hidden` | |
| zIndex | 渲染层级 | number | 2 |
**示例**:
```js
const graph = new Graph({
behaviors: [
{
type: 'brush-select',
key: 'brush-select',
style: {
width: 0,
height: 0,
lineWidth: 4,
lineDash: [2, 2], // 虚线外框
// rgb超级炫彩框框
fill: 'linear-gradient(217deg, rgba(255,0,0,.8), rgba(255,0,0,0) 70.71%),linear-gradient(127deg, rgba(0,255,0,.8), rgba(0,255,0,0) 70.71%),linear-gradient(336deg, rgba(0,0,255,.8), rgba(0,0,255,0) 70.71%)',
stroke: 'pink',
fillOpacity: 0.2,
zIndex: 2,
pointerEvents: 'none',
},
},
],
});
```
```js | ob { pin: false, inject: true }
import { Graph } from '@antv/g6';
const graph = new Graph({
container: 'container',
width: 600,
height: 300,
data: {
nodes: [
{ id: 'node-1', style: { x: 200, y: 100 } },
{ id: 'node-2', style: { x: 360, y: 100 } },
{ id: 'node-3', style: { x: 280, y: 220 } },
],
edges: [
{ source: 'node-1', target: 'node-2' },
{ source: 'node-1', target: 'node-3' },
{ source: 'node-2', target: 'node-3' },
],
},
node: {
style: { fill: '#7e3feb' },
},
edge: {
stroke: '#8b9baf',
},
behaviors: [
{
type: 'brush-select',
key: 'brush-select',
trigger: [],
immediately: true,
style: {
width: 0,
height: 0,
lineWidth: 4,
lineDash: [2, 2], // 虚线外框
// rgb超级炫彩框框
fill: 'linear-gradient(217deg, rgba(255,0,0,.8), rgba(255,0,0,0) 70.71%),linear-gradient(127deg, rgba(0,255,0,.8), rgba(0,255,0,0) 70.71%),linear-gradient(336deg, rgba(0,0,255,.8), rgba(0,0,255,0) 70.71%)',
stroke: 'pink',
fillOpacity: 0.2,
zIndex: 2,
pointerEvents: 'none',
},
},
],
plugins: [{ type: 'grid-line', size: 30 }],
animation: true,
});
graph.render();
```
### 实际案例
```js | ob { inject: true }
import { Graph } from '@antv/g6';
const graph = new Graph({
container: 'container',
data: {
nodes: [
{ id: 'node-1', style: { x: 200, y: 250 } },
{ id: 'node-2', style: { x: 250, y: 200 } },
{ id: 'node-3', style: { x: 300, y: 250 } },
{ id: 'node-4', style: { x: 250, y: 300 } },
],
edges: [
{ source: 'node-1', target: 'node-2' },
{ source: 'node-2', target: 'node-3' },
{ source: 'node-3', target: 'node-4' },
{ source: 'node-4', target: 'node-1' },
],
},
behaviors: [
{
key: 'brush-select',
type: 'brush-select',
enable: true,
animation: false,
mode: 'default', // union intersect diff default
state: 'selected', // 'active', 'selected', 'inactive', ...
trigger: [], // ['Shift', 'Alt', 'Control', 'Drag', 'Meta', ...]
style: {
width: 0,
height: 0,
lineWidth: 4,
lineDash: [2, 2],
fill: 'linear-gradient(217deg, rgba(255,0,0,.8), rgba(255,0,0,0) 70.71%),linear-gradient(127deg, rgba(0,255,0,.8), rgba(0,255,0,0) 70.71%),linear-gradient(336deg, rgba(0,0,255,.8), rgba(0,0,255,0) 70.71%)',
stroke: 'pink',
fillOpacity: 0.2,
zIndex: 2,
pointerEvents: 'none',
},
},
],
});
graph.render();
```
Behavior Skill
packages/site/docs/manual/behavior/ClickSelect.en.md anthropic-skill ~3,303 tokens---
title: ClickSelect
order: 3
---
## Overview
When an element is clicked, it will be highlighted.
## Usage Scenarios
This behavior is mainly used for:
- Focusing on elements
- Viewing element details
- Viewing element relationships
## Online Experience
<embed src="@/common/api/behaviors/click-element.md"></embed>
## Basic Usage
Add this behavior in the graph configuration:
**1. Quick Configuration (Static)**
Declare directly using a string form. This method is simple but only supports default configuration and cannot be dynamically modified after configuration:
```javascript
const graph = new Graph({
// Other configurations...
behaviors: ['click-select'],
});
```
**2. Object Configuration (Recommended)**
Configure using an object form, supporting custom parameters, and can dynamically update the configuration at runtime:
```javascript
const graph = new Graph({
// Other configurations...
behaviors: [
{
type: 'click-select',
key: 'click-select-1',
degree: 2, // Selection spread range
state: 'active', // Selected state
neighborState: 'neighborActive', // Neighbor node attached state
unselectedState: 'inactive', // Unselected node state
},
],
});
```
## Configuration Options
| Option | Description | Type | Default | Required |
| --------------- | ------------------------------------------------------------------------------------------------------------------------------------------------------------------------------------------------------------------------------------------------------------------ | ------------------------------------------------------------------------------- | -------------- | -------- |
| type | Behavior type name. This behavior is built-in, and you can use it with `type: 'click-select'`. | `click-select` \| string | `click-select` | ✓ |
| animation | Whether to enable animation effects when switching element states | boolean | true | |
| degree | Controls the highlight spread range, [example](#degree) | number \| (event:[Event](/en/api/event#event-object-properties)) => number | 0 | |
| enable | Whether to enable the click element function, supports dynamic control through functions, [example](#enable) | boolean \| ((event: [Event](/en/api/event#event-object-properties)) => boolean) | true | |
| multiple | Whether to allow multiple selections | boolean | false | |
| state | The state applied when an element is selected | string \| `selected` \| `active`\| `inactive`\| `disabled`\| `highlight` | `selected` | |
| neighborState | The state applied to elements with n-degree relationships when an element is selected. The value of n is controlled by the degree attribute, for example, degree 1 means directly adjacent elements, [example](#neighborstate) | string \| `selected` \| `active`\| `inactive`\| `disabled`\| `highlight` | `selected` | |
| unselectedState | The state applied to all other elements except the selected element and its affected neighbor elements when an element is selected, [example](#unselectedState) | string \| `selected` \| `active`\| `inactive`\| `disabled`\| `highlight` | | |
| onClick | Callback when an element is clicked | (event: [Event](/en/api/event#event-object-properties)) => void | | |
| trigger | Press this shortcut key in combination with a mouse click to perform multi-selection, key reference: _<a href="https://developer.mozilla.org/en-US/docs/Web/API/UI_Events/Keyboard_event_key_values" target="_blank" rel="noopener noreferrer">MDN Key Values</a>_ | string[] \| (`Control` \| `Shift`\| `Alt` \| `......`)[] | `['shift']` | |
### degree
Controls the highlight spread range
- For nodes, `0` means only the current node is selected, `1` means the current node and its directly adjacent nodes and edges are selected, and so on.
- For edges, `0` means only the current edge is selected, `1` means the current edge and its directly adjacent nodes are selected, and so on.
> In the following example, when `degree: 0` only the <span style='color:#E4504D'>red</span> point is highlighted;
> When `degree: 1` the <span style='color:#E4504D'>red</span> and <span style='color:#FFC40C'>orange</span> points are highlighted.
<embed src="@/common/api/behaviors/click-element.md"></embed>
### enable
Whether to enable the click element function
It can be dynamically controlled through functions, for example, only enabled when a node is selected.
```js
{
//⚠️ Note, you need to set both the node and the canvas, otherwise the user will not listen to the event when clicking the canvas
enable: (event) => ['node', 'canvas'].includes(event.targetType);
}
```
```js | ob { pin: false, inject: true }
import { Graph } from '@antv/g6';
const graph = new Graph({
container: 'container',
width: 400,
height: 200,
data: {
nodes: [
{ id: 'node1', style: { x: 100, y: 60 } },
{ id: 'node2', style: { x: 200, y: 60 } },
{ id: 'node3', style: { x: 300, y: 60 } },
],
edges: [
{ source: 'node1', target: 'node2' },
{ source: 'node2', target: 'node3' },
],
},
node: {
style: {
fill: '#E4504D',
},
state: {
active: {
fill: '#0f0',
},
neighborActive: {
fill: '#FFC40C',
},
},
},
behaviors: [
{
type: 'click-select',
degree: 1,
state: 'active',
neighborState: 'neighborActive',
enable: (event) => ['node', 'canvas'].includes(event.targetType),
},
],
});
graph.render();
```
Similarly, if you only want edges to be selected:
```js
{
enable: (event) => ['edge', 'canvas'].includes(event.targetType);
}
```
### neighborState
The state applied to elements with n-degree relationships when an element is selected. The value of n is controlled by the degree attribute, for example, degree 1 means directly adjacent elements
```js
const graph = new Graph({
behaviors: [
{
type: 'click-select',
degree: 1,
// State attached to the directly clicked node
state: 'active',
// State attached to adjacent nodes
neighborState: 'neighborActive',
},
],
});
```
```js | ob { pin: false, inject: true }
import { Graph } from '@antv/g6';
const graph = new Graph({
container: 'container',
width: 400,
height: 200,
layout: {
type: 'grid',
},
data: {
nodes: [{ id: 'node1' }, { id: 'node2' }, { id: 'node3' }, { id: 'node4' }, { id: 'node5' }],
edges: [
{ source: 'node1', target: 'node2' },
{ source: 'node2', target: 'node3' },
{ source: 'node3', target: 'node4' },
{ source: 'node4', target: 'node5' },
],
},
node: {
style: {
fill: '#E4504D',
},
state: {
active: {
fill: '#0f0',
},
neighborActive: {
fill: '#FFC40C',
halo: true,
},
},
},
behaviors: [
{
type: 'click-select',
degree: 1,
state: 'active',
neighborState: 'neighborActive',
},
],
});
graph.render();
```
### unselectedState
When an element is selected, the state applied to all other elements except the selected element and the spread neighbor elements.
Built-in states: `selected` `active` `inactive` `disabled` `highlight`
```js
const graph = new Graph({
behaviors: [
{
type: 'click-select',
degree: 1,
unselectedState: 'inactive',
},
],
});
```
```js | ob { pin: false, inject: true }
import { Graph } from '@antv/g6';
const graph = new Graph({
container: 'container',
width: 400,
height: 200,
layout: {
type: 'grid',
},
data: {
nodes: [{ id: 'node1' }, { id: 'node2' }, { id: 'node3' }, { id: 'node4' }, { id: 'node5' }],
edges: [
{ source: 'node1', target: 'node2' },
{ source: 'node2', target: 'node3' },
{ source: 'node3', target: 'node4' },
{ source: 'node4', target: 'node5' },
],
},
node: {
style: {
fill: '#E4504D',
},
state: {
active: {
fill: '#0f0',
},
neighborActive: {
fill: '#FFC40C',
},
},
},
behaviors: [
{
type: 'click-select',
degree: 1,
state: 'active',
neighborState: 'neighborActive',
unselectedState: 'inactive',
},
],
});
graph.render();
```
## Example
### Click to select nodes and their directly connected nodes
**Clicking a node** will switch from <span style='color:#E4504D'>default state</span> to <span style='color:#0f0'>active</span>
<br>
**Adjacent nodes** will switch from <span style='color:#E4504D'>default state</span> to <span style='color:#FFC40C'>neighborActive</span>
```js
const graph = new Graph({
node: {
style: {
fill: '#E4504D',
},
state: {
// Selected node state
active: {
fill: '#0f0',
},
// Adjacent node state
neighborActive: {
fill: '#FFC40C',
},
},
},
behaviors: [
{
type: 'click-select',
degree: 1,
state: 'active',
// State attached to adjacent nodes
neighborState: 'neighborActive',
// Unselected node state
unselectedState: 'inactive',
},
],
});
```
```js | ob { pin: false, inject: true }
import { Graph } from '@antv/g6';
const graph = new Graph({
container: 'container',
width: 400,
height: 200,
layout: {
type: 'grid',
},
data: {
nodes: [{ id: 'node1' }, { id: 'node2' }, { id: 'node3' }, { id: 'node4' }, { id: 'node5' }],
edges: [
{ source: 'node1', target: 'node2' },
{ source: 'node2', target: 'node3' },
{ source: 'node3', target: 'node4' },
{ source: 'node4', target: 'node5' },
],
},
node: {
style: {
fill: '#E4504D',
},
state: {
active: {
fill: '#0f0',
},
neighborActive: {
fill: '#FFC40C',
},
},
},
behaviors: [
{
type: 'click-select',
degree: 1,
state: 'active',
neighborState: 'neighborActive',
unselectedState: 'inactive',
},
],
});
graph.render();
```
### Practical Example
```js | ob { inject: true }
import { Graph } from '@antv/g6';
const graph = new Graph({
container: 'container',
layout: {
type: 'grid',
},
data: {
nodes: [{ id: 'node1' }, { id: 'node2' }, { id: 'node3' }, { id: 'node4' }, { id: 'node5' }],
edges: [
{ source: 'node1', target: 'node2' },
{ source: 'node2', target: 'node3' },
{ source: 'node3', target: 'node4' },
{ source: 'node4', target: 'node5' },
],
},
node: {
style: {
fill: '#E4504D',
},
state: {
active: {
fill: '#0b0',
},
},
},
behaviors: [
{
type: 'click-select',
degree: 1,
state: 'active',
unselectedState: 'inactive',
multiple: true,
trigger: ['shift'],
},
'drag-element',
],
});
graph.render();
```
Behavior Skill
packages/site/docs/manual/behavior/ClickSelect.zh.md anthropic-skill ~2,654 tokens---
title: 点击选中 ClickSelect
order: 3
---
## 概述
当鼠标点击元素时,会使元素高亮。
## 使用场景
这一交互主要用于:
- 聚焦元素
- 查看元素详情
- 查看元素关系
## 在线体验
<embed src="@/common/api/behaviors/click-element.md"></embed>
## 基本用法
在图配置中添加这一交互:
**1. 快速配置(静态)**
使用字符串形式直接声明,这种方式简洁但仅支持默认配置,且配置后不可动态修改:
```javascript
const graph = new Graph({
// 其他配置...
behaviors: ['click-select'],
});
```
**2. 对象配置(推荐)**
使用对象形式进行配置,支持自定义参数,且可以在运行时动态更新配置:
```javascript
const graph = new Graph({
// 其他配置...
behaviors: [
{
type: 'click-select',
key: 'click-select-1',
degree: 2, // 选中扩散范围
state: 'active', // 选中的状态
neighborState: 'neighborActive', // 相邻节点附着状态
unselectedState: 'inactive', // 未选中节点状态
},
],
});
```
## 配置项
| 配置项 | 说明 | 类型 | 默认值 | 必选 |
| --------------- | ---------------------------------------------------------------------------------------------------------------------------------------------------------------------------------------------------------- | ------------------------------------------------------------------------ | -------------- | ---- |
| type | 交互类型名称。此交互已内置,你可以通过 `type: 'click-select'` 来使用它。 | `click-select` \| string | `click-select` | ✓ |
| animation | 是否在元素状态切换时启用动画效果 | boolean | true | |
| degree | 控制了高亮扩散范围,[示例](#degree) | number \| (event:[Event](/api/event#事件对象属性)) => number | 0 | |
| enable | 是否启用点击元素的功能,支持通过函数的方式动态控制是否启用,[示例](#enable) | boolean \| ((event: [Event](/api/event#事件对象属性)) => boolean) | true | |
| multiple | 是否允许多选 | boolean | false | |
| state | 当元素被选中时应用的状态 | string \| `selected` \| `active`\| `inactive`\| `disabled`\| `highlight` | `selected` | |
| neighborState | 当有元素选中时,其相邻 n 度关系的元素应用的状态。n 的值由属性 degree 控制,例如 degree 为 1 时表示直接相邻的元素,[示例](#neighborstate) | string \| `selected` \| `active`\| `inactive`\| `disabled`\| `highlight` | `selected` | |
| unselectedState | 当有元素被选中时,除了选中元素及其受影响的邻居元素外,其他所有元素应用的状态,[示例](#unselectedState) | string \| `selected` \| `active`\| `inactive`\| `disabled`\| `highlight` | | |
| onClick | 点击元素时的回调 | (event: [Event](/api/event#事件对象属性)) => void | | |
| trigger | 按下该快捷键配合鼠标点击进行多选,按键参考: _<a href="https://developer.mozilla.org/zh-CN/docs/Web/API/UI_Events/Keyboard_event_key_values" target="_blank" rel="noopener noreferrer">MDN Key Values</a>_ | string[] \| (`Control` \| `Shift`\| `Alt` \| `......`)[] | `['shift']` | |
### degree
控制了高亮扩散范围
- 对于节点来说,`0` 表示只选中当前节点,`1` 表示选中当前节点及其直接相邻的节点和边,以此类推。
- 对于边来说,`0` 表示只选中当前边,`1` 表示选中当前边及其直接相邻的节点,以此类推。
> 如下示例,当 `degree: 0` 仅高亮<span style='color:#E4504D'>红色</span>点;
> 当 `degree: 1` 高亮<span style='color:#E4504D'>红色</span>和<span style='color:#FFC40C'>橙色</span>点。
<embed src="@/common/api/behaviors/click-element.md"></embed>
### enable
是否启用点击元素的功能
可以通过函数的方式动态控制是否启用,例如只有节点被选中时才启用。
```js
{
//⚠️ 注意,这里需要同时设置节点和画布,否则用户点击画布时将不会监听到事件
enable: (event) => ['node', 'canvas'].includes(event.targetType);
}
```
```js | ob { pin: false, inject: true }
import { Graph } from '@antv/g6';
const graph = new Graph({
container: 'container',
width: 400,
height: 200,
data: {
nodes: [
{ id: 'node1', style: { x: 100, y: 60 } },
{ id: 'node2', style: { x: 200, y: 60 } },
{ id: 'node3', style: { x: 300, y: 60 } },
],
edges: [
{ source: 'node1', target: 'node2' },
{ source: 'node2', target: 'node3' },
],
},
node: {
style: {
fill: '#E4504D',
},
state: {
active: {
fill: '#0f0',
},
neighborActive: {
fill: '#FFC40C',
},
},
},
behaviors: [
{
type: 'click-select',
degree: 1,
state: 'active',
neighborState: 'neighborActive',
enable: (event) => ['node', 'canvas'].includes(event.targetType),
},
],
});
graph.render();
```
同理,如果只希望边能被选中:
```js
{
enable: (event) => ['edge', 'canvas'].includes(event.targetType);
}
```
### neighborState
当有元素选中时,其相邻 n 度关系的元素应用的状态。n 的值由属性 degree 控制,例如 degree 为 1 时表示直接相邻的元素
```js
const graph = new Graph({
behaviors: [
{
type: 'click-select',
degree: 1,
// 被直接点击的节点附着的状态
state: 'active',
// 相邻的节点附着的状态
neighborState: 'neighborActive',
},
],
});
```
```js | ob { pin: false, inject: true }
import { Graph } from '@antv/g6';
const graph = new Graph({
container: 'container',
width: 400,
height: 200,
layout: {
type: 'grid',
},
data: {
nodes: [{ id: 'node1' }, { id: 'node2' }, { id: 'node3' }, { id: 'node4' }, { id: 'node5' }],
edges: [
{ source: 'node1', target: 'node2' },
{ source: 'node2', target: 'node3' },
{ source: 'node3', target: 'node4' },
{ source: 'node4', target: 'node5' },
],
},
node: {
style: {
fill: '#E4504D',
},
state: {
active: {
fill: '#0f0',
},
neighborActive: {
fill: '#FFC40C',
halo: true,
},
},
},
behaviors: [
{
type: 'click-select',
degree: 1,
state: 'active',
neighborState: 'neighborActive',
},
],
});
graph.render();
```
### unselectedState
当有元素被选中时,除了被选中元素和扩散的邻居元素外,其他所有元素应用的状态。
内置状态: `selected` `active` `inactive` `disabled` `highlight`
```js
const graph = new Graph({
behaviors: [
{
type: 'click-select',
degree: 1,
unselectedState: 'inactive',
},
],
});
```
```js | ob { pin: false, inject: true }
import { Graph } from '@antv/g6';
const graph = new Graph({
container: 'container',
width: 400,
height: 200,
layout: {
type: 'grid',
},
data: {
nodes: [{ id: 'node1' }, { id: 'node2' }, { id: 'node3' }, { id: 'node4' }, { id: 'node5' }],
edges: [
{ source: 'node1', target: 'node2' },
{ source: 'node2', target: 'node3' },
{ source: 'node3', target: 'node4' },
{ source: 'node4', target: 'node5' },
],
},
node: {
style: {
fill: '#E4504D',
},
state: {
active: {
fill: '#0f0',
},
neighborActive: {
fill: '#FFC40C',
},
},
},
behaviors: [
{
type: 'click-select',
degree: 1,
state: 'active',
neighborState: 'neighborActive',
unselectedState: 'inactive',
},
],
});
graph.render();
```
## 示例
### 点击选中节点及其直接相连的节点
**点击节点** 会从 <span style='color:#E4504D'>默认状态</span> 切换为 <span style='color:#0f0'>active</span>
<br>
**相邻节点** 会从 <span style='color:#E4504D'>默认状态</span> 切换为 <span style='color:#FFC40C'>neighborActive</span>
```js
const graph = new Graph({
node: {
style: {
fill: '#E4504D',
},
state: {
// 选中节点状态
active: {
fill: '#0f0',
},
// 相邻节点状态
neighborActive: {
fill: '#FFC40C',
},
},
},
behaviors: [
{
type: 'click-select',
degree: 1,
state: 'active',
// 相邻节点附着状态
neighborState: 'neighborActive',
// 未选中节点状态
unselectedState: 'inactive',
},
],
});
```
```js | ob { pin: false, inject: true }
import { Graph } from '@antv/g6';
const graph = new Graph({
container: 'container',
width: 400,
height: 200,
layout: {
type: 'grid',
},
data: {
nodes: [{ id: 'node1' }, { id: 'node2' }, { id: 'node3' }, { id: 'node4' }, { id: 'node5' }],
edges: [
{ source: 'node1', target: 'node2' },
{ source: 'node2', target: 'node3' },
{ source: 'node3', target: 'node4' },
{ source: 'node4', target: 'node5' },
],
},
node: {
style: {
fill: '#E4504D',
},
state: {
active: {
fill: '#0f0',
},
neighborActive: {
fill: '#FFC40C',
},
},
},
behaviors: [
{
type: 'click-select',
degree: 1,
state: 'active',
neighborState: 'neighborActive',
unselectedState: 'inactive',
},
],
});
graph.render();
```
### 实际案例
```js | ob { inject: true }
import { Graph } from '@antv/g6';
const graph = new Graph({
container: 'container',
layout: {
type: 'grid',
},
data: {
nodes: [{ id: 'node1' }, { id: 'node2' }, { id: 'node3' }, { id: 'node4' }, { id: 'node5' }],
edges: [
{ source: 'node1', target: 'node2' },
{ source: 'node2', target: 'node3' },
{ source: 'node3', target: 'node4' },
{ source: 'node4', target: 'node5' },
],
},
node: {
style: {
fill: '#E4504D',
},
state: {
active: {
fill: '#0b0',
},
},
},
behaviors: [
{
type: 'click-select',
degree: 1,
state: 'active',
unselectedState: 'inactive',
multiple: true,
trigger: ['shift'],
},
'drag-element',
],
});
graph.render();
```
Behavior Skill
packages/site/docs/manual/behavior/CollapseExpand.en.md anthropic-skill ~1,652 tokens---
title: CollapseExpand
order: 4
---
## Overview
CollapseExpand is a built-in behavior in G6 used to implement the expand/collapse functionality for nodes or combos. Through double-click (default) or single-click actions, users can flexibly control the expand and collapse states of graph elements, effectively managing the visualization hierarchy of the graph structure and reducing visual complexity.
## Use Cases
This behavior is mainly used for:
- Managing large hierarchical graphs, enabling layered browsing of tree or network graphs
- Simplifying the display of complex graphs, expanding areas of interest as needed
- Hiding branch nodes that are temporarily not needed, focusing on important information
## Online Experience
<embed src="@/common/api/behaviors/collapse-expand.md"></embed>
## Basic Usage
Add this behavior in the graph configuration:
**1. Quick Configuration (Static)**
Declare directly using a string form. This method is simple but only supports default configurations and cannot be dynamically modified after configuration:
```javascript
const graph = new Graph({
// other configurations...
behaviors: ['collapse-expand'],
});
```
**2. Object Configuration (Recommended)**
Configure using an object form, supporting custom parameters, and allowing dynamic updates to the configuration at runtime:
```javascript
const graph = new Graph({
// other configurations...
behaviors: [
{
type: 'collapse-expand',
key: 'collapse-expand-1',
trigger: 'click', // Change the trigger method to single-click
animation: true, // Enable animation effects
},
],
});
```
## Configuration Options
| Option | Description | Type | Default Value | Required |
| ---------- | --------------------------------------------------- | ------------------------------------------------------------------------ | ----------------- | -------- |
| type | Behavior type name | `collapse-expand` \| string | `collapse-expand` | ✓ |
| animation | Enable expand/collapse animation effects | boolean | true | |
| enable | Enable expand/collapse functionality | boolean \| ((event: [/en/api/event#event-object-properties]) => boolean) | true | |
| trigger | Trigger method, can be single-click or double-click | `click` \| `dblclick` | `dblclick` | |
| onCollapse | Callback function when collapse is completed | (id: string) => void | - | |
| onExpand | Callback function when expand is completed | (id: string) => void | - | |
| align | Align with the target element to avoid view offset | boolean | true | |
## Code Examples
### Basic Expand/Collapse Functionality
```javascript
const graph = new Graph({
container: 'container',
width: 800,
height: 600,
behaviors: ['collapse-expand'],
// other configurations...
});
```
### Use Single-Click to Trigger Expand/Collapse
```javascript
const graph = new Graph({
// other configurations...
behaviors: [
{
type: 'collapse-expand',
trigger: 'click', // Change the default double-click trigger to single-click
},
],
});
```
### Custom Expand/Collapse Callback
```javascript
const graph = new Graph({
// other configurations...
behaviors: [
{
type: 'collapse-expand',
onCollapse: (id) => {
console.log(`Node ${id} has collapsed`);
// Execute custom logic
},
onExpand: (id) => {
console.log(`Node ${id} has expanded`);
// Execute custom logic
},
},
],
});
```
### Conditional Enablement of Expand/Collapse Functionality
```javascript
const graph = new Graph({
// other configurations...
behaviors: [
{
type: 'collapse-expand',
// Enable expand/collapse functionality only when the target is a node type
enable: (event) => event.targetType === 'node',
},
],
});
```
### Disable Animation Effects
```javascript
const graph = new Graph({
// other configurations...
behaviors: [
{
type: 'collapse-expand',
animation: false, // Disable expand/collapse animation effects
},
],
});
```
## FAQ
### 1. How to determine if a node is collapsed?
You can check the `collapsed` property in the node data:
```javascript
const isCollapsed = (nodeId) => {
const nodeData = graph.getNodeData(nodeId);
return nodeData?.style?.collapsed === true;
};
```
### 2. How to programmatically expand or collapse a node?
In addition to being triggered by user interaction, you can also directly control using [collapseElement](/en/api/element#graphcollapseelementid-options) or [expandElement](/en/api/element#graphexpandelementid-options):
```javascript
// Collapse node
graph.collapseElement('nodeId', { animation: true });
// Expand node
graph.expandElement('nodeId', { animation: true });
```
## Real Cases
```js | ob { inject: true }
import { Graph } from '@antv/g6';
const graph = new Graph({
container: 'container',
data: {
nodes: [
{ id: 'node1', combo: 'combo1', style: { x: 300, y: 100 } },
{ id: 'node2', combo: 'combo1', style: { x: 300, y: 150 } },
{ id: 'node3', combo: 'combo2', style: { x: 100, y: 100 } },
{ id: 'node4', combo: 'combo2', style: { x: 50, y: 150 } },
{ id: 'node5', combo: 'combo2', style: { x: 150, y: 150 } },
],
edges: [
{ source: 'node1', target: 'node2' },
{ source: 'node3', target: 'node4' },
{ source: 'node3', target: 'node5' },
],
combos: [
{ id: 'combo1', style: { labelText: '双击折叠', collapsed: true } },
{ id: 'combo2', style: { labelText: '单击折叠', collapsed: false } },
],
},
behaviors: [
{
type: 'collapse-expand',
trigger: 'dblclick',
enable: (event) => event.targetType === 'combo' && event.target.id === 'combo1',
},
{
type: 'collapse-expand',
trigger: 'click',
enable: (event) => event.targetType === 'combo' && event.target.id === 'combo2',
},
],
});
graph.render();
```
Behavior Skill
packages/site/docs/manual/behavior/CollapseExpand.zh.md anthropic-skill ~1,214 tokens---
title: 展开/收起元素 CollapseExpand
order: 4
---
## 概述
CollapseExpand 是 G6 中用于实现节点或组合(Combo)展开/收起功能的内置交互。通过双击(默认)或单击操作,用户可以灵活控制图元素的展开与收起状态,有效管理图结构的可视化层次,降低视觉复杂度。
## 使用场景
这一交互主要用于:
- 管理大型层次结构图,实现树状图或网络图的分层浏览
- 简化复杂图的展示,按需展开关注区域
- 隐藏暂时不需要查看的分支节点,聚焦于重要信息
## 在线体验
<embed src="@/common/api/behaviors/collapse-expand.md"></embed>
## 基本用法
在图配置中添加这一 behavior:
**1. 快速配置(静态)**
使用字符串形式直接声明,这种方式简洁但仅支持默认配置,且配置后不可动态修改:
```javascript
const graph = new Graph({
// 其他配置...
behaviors: ['collapse-expand'],
});
```
**2. 对象配置(推荐)**
使用对象形式进行配置,支持自定义参数,且可以在运行时动态更新配置:
```javascript
const graph = new Graph({
// 其他配置...
behaviors: [
{
type: 'collapse-expand',
key: 'collapse-expand-1',
trigger: 'click', // 修改触发方式为单击
animation: true, // 启用动画效果
},
],
});
```
## 配置项
| 配置项 | 说明 | 类型 | 默认值 | 必选 |
| ---------- | ------------------------------ | ------------------------------------------------------------------------- | ----------------- | ---- |
| type | 交互类型名称 | `collapse-expand` \| string | `collapse-expand` | ✓ |
| animation | 是否启用展开/收起动画效果 | boolean | true | |
| enable | 是否启用展开/收起功能 | boolean \| ((event: [IPointerEvent](/api/event#事件对象属性)) => boolean) | true | |
| trigger | 触发方式,可选单击或双击 | `click` \| `dblclick` | `dblclick` | |
| onCollapse | 完成收起时的回调函数 | (id: string) => void | - | |
| onExpand | 完成展开时的回调函数 | (id: string) => void | - | |
| align | 是否对准目标元素,避免视图偏移 | boolean | true | |
## 代码示例
### 基础展开/收起功能
```javascript
const graph = new Graph({
container: 'container',
width: 800,
height: 600,
behaviors: ['collapse-expand'],
// 其他配置...
});
```
### 使用单击触发展开/收起
```javascript
const graph = new Graph({
// 其他配置...
behaviors: [
{
type: 'collapse-expand',
trigger: 'click', // 将默认的双击触发改为单击触发
},
],
});
```
### 自定义展开/收起回调
```javascript
const graph = new Graph({
// 其他配置...
behaviors: [
{
type: 'collapse-expand',
onCollapse: (id) => {
console.log(`节点 ${id} 已收起`);
// 执行自定义逻辑
},
onExpand: (id) => {
console.log(`节点 ${id} 已展开`);
// 执行自定义逻辑
},
},
],
});
```
### 条件性启用展开/收起功能
```javascript
const graph = new Graph({
// 其他配置...
behaviors: [
{
type: 'collapse-expand',
// 只有当目标是节点类型时才启用展开/收起功能
enable: (event) => event.targetType === 'node',
},
],
});
```
### 关闭动画效果
```javascript
const graph = new Graph({
// 其他配置...
behaviors: [
{
type: 'collapse-expand',
animation: false, // 关闭展开/收起动画效果
},
],
});
```
## 常见问题
### 1. 如何判断一个节点是否处于收起状态?
可以通过检查节点数据中的 `collapsed` 属性:
```javascript
const isCollapsed = (nodeId) => {
const nodeData = graph.getNodeData(nodeId);
return nodeData?.style?.collapsed === true;
};
```
### 2. 如何以编程方式展开或收起节点?
除了通过用户交互触发,你还可以使用 [collapseElement](/api/element#graphcollapseelementid-options) 或 [expandElement](/api/element#graphexpandelementid-options) 直接控制:
```javascript
// 收起节点
graph.collapseElement('nodeId', { animation: true });
// 展开节点
graph.expandElement('nodeId', { animation: true });
```
## 实际案例
```js | ob { inject: true }
import { Graph } from '@antv/g6';
const graph = new Graph({
container: 'container',
data: {
nodes: [
{ id: 'node1', combo: 'combo1', style: { x: 300, y: 100 } },
{ id: 'node2', combo: 'combo1', style: { x: 300, y: 150 } },
{ id: 'node3', combo: 'combo2', style: { x: 100, y: 100 } },
{ id: 'node4', combo: 'combo2', style: { x: 50, y: 150 } },
{ id: 'node5', combo: 'combo2', style: { x: 150, y: 150 } },
],
edges: [
{ source: 'node1', target: 'node2' },
{ source: 'node3', target: 'node4' },
{ source: 'node3', target: 'node5' },
],
combos: [
{ id: 'combo1', style: { labelText: '双击折叠', collapsed: true } },
{ id: 'combo2', style: { labelText: '单击折叠', collapsed: false } },
],
},
behaviors: [
{
type: 'collapse-expand',
trigger: 'dblclick',
enable: (event) => event.targetType === 'combo' && event.target.id === 'combo1',
},
{
type: 'collapse-expand',
trigger: 'click',
enable: (event) => event.targetType === 'combo' && event.target.id === 'combo2',
},
],
});
graph.render();
```
Behavior Skill
packages/site/docs/manual/behavior/CreateEdge.en.md anthropic-skill ~1,265 tokens---
title: CreateEdge
order: 5
---
## Overview
CreateEdge is a built-in behavior in G6 for interactively creating edges on the canvas. After the user triggers the behavior (click or drag), the edge will follow the mouse movement and connect to the target node to complete the creation. If canceled, it will be automatically removed.
Additionally, this behavior supports customizing the style of the edge, such as color, line style, arrow, etc., to meet different visualization needs.
The elements that can be connected by this behavior are `node` and `combo`.
## Usage Scenarios
This behavior is mainly used for:
- Visualization scenarios that require interactive creation of connections between nodes, such as flowcharts, knowledge graphs, etc.
## Online Experience
<embed src="@/common/api/behaviors/create-edge.md"></embed>
## Basic Usage
Add this behavior in the graph configuration
```javascript
// Use default configuration
const graph = new Graph({
// Other configurations...
behaviors: ['create-edge'], // Directly add, use default configuration
});
// Or use custom configuration
const graph = new Graph({
// Other configurations
behaviors: [
{
type: 'create-edge',
trigger: 'click', // Behavior configuration, create edge by clicking
style: {}, // Custom edge style
},
],
});
```
## Configuration Options
| Option | Description | Type | Default | Required |
| -------- | ----------------------------------------------------------------------------------------------------------- | -------------------------------------------------------------------------------------------------------- | ------------- | -------- |
| type | Behavior type name | string | `create-edge` | √ |
| trigger | The way to trigger the creation of a new edge: `click` means click to trigger; `drag` means drag to trigger | `click` \| `drag` | `drag` | |
| enable | Whether to enable this behavior | boolean \| ((event: [Event](/en/api/event#event-object-properties)) => boolean) | true | |
| onCreate | Callback function for creating an edge, returns edge data | (edge: [EdgeData](/en/manual/data#edge-data-edgedata)) => [EdgeData](/en/manual/data#edge-data-edgedata) | - | |
| onFinish | Callback function for successfully creating an edge | (edge: [EdgeData](/en/manual/data#edge-data-edgedata)) => void | - | |
| style | Style of the newly created edge, [configuration options](#style) | See below | - | |
### style
Configure the style of the newly created edge, for detailed configuration options, please refer to [Element - Edge - General Edge Properties - Style](/en/manual/element/edge/base-edge#style)
```json
{
"style": {
"stroke": "red",
"lineWidth": 2
}
}
```
## Code Examples
### Basic Edge Creation Function
```javascript
const graph = new Graph({
container: 'container',
width: 800,
height: 600,
behaviors: ['create-edge'],
});
```
### Custom Edge Creation Function
```javascript
const graph = new Graph({
// Other configurations,
behaviors: [
{
type: 'create-edge',
style: {
stroke: 'red',
lineWidth: 3,
},
},
],
});
```
### Create Edge by Clicking
```javascript
const graph = new Graph({
// Other configurations
behaviors: [
{
type: 'create-edge',
trigger: 'click',
},
],
});
```
## Practical Example
```js | ob { inject: true }
import { Graph } from '@antv/g6';
const graph = new Graph({
container: 'container',
data: {
nodes: [{ id: 'node1' }, { id: 'node2' }, { id: 'node3' }, { id: 'node4' }, { id: 'node5' }],
edges: [
{ source: 'node1', target: 'node2' },
{ source: 'node1', target: 'node3' },
{ source: 'node1', target: 'node4' },
{ source: 'node2', target: 'node3' },
{ source: 'node3', target: 'node4' },
{ source: 'node4', target: 'node5' },
],
},
layout: {
type: 'grid',
},
behaviors: [
{
type: 'create-edge',
trigger: 'drag',
style: {
fill: 'red',
lineWidth: 2,
},
},
],
});
graph.render();
```
Behavior Skill
packages/site/docs/manual/behavior/CreateEdge.zh.md anthropic-skill ~876 tokens---
title: 创建边 CreateEdge
order: 5
---
## 概述
CreateEdge 是 G6 中用于实现画布中交互式创建边(Edge)的内置交互。用户触发交互(点击或拖拽)后,边会随鼠标移动,连接到目标节点即完成创建,若取消则自动移除。
此外,该交互支持自定义边的样式,如颜色、线条样式、箭头等,以适应不同的可视化需求。
该交互支持连接的元素为 `node` 和 `combo`。
## 使用场景
这一交互主要用于:
- 需要交互式创建节点间连接关系的可视化场景,如流程图、知识图谱等
## 在线体验
<embed src="@/common/api/behaviors/create-edge.md"></embed>
## 基本用法
在图配置中添加这一交互
```javascript
// 使用默认配置
const graph = new Graph({
// 其他配置...
behaviors: ['create-edge'], // 直接添加,使用默认配置
});
// 或使用自定义配置
const graph = new Graph({
// 其他配置
behaviors: [
{
type: 'create-edge',
trigger: 'click', // 交互配置,通过点击创建边
style: {}, // 边自定义样式
},
],
});
```
## 配置项
| 配置项 | 说明 | 类型 | 默认值 | 必选 |
| -------- | ----------------------------------------------------------- | ------------------------------------------------------------------------------------------ | ------------- | ---- |
| type | 交互类型名称 | string | `create-edge` | √ |
| trigger | 触发新建边的方式:`click` 表示点击触发;`drag` 表示拖拽触发 | `click` \| `drag` | `drag` | |
| enable | 是否启用该交互 | boolean \| ((event: [Event](/api/event#事件对象属性)) => boolean) | true | |
| onCreate | 创建边回调函数,返回边数据 | (edge: [EdgeData](/manual/data#边数据edgedata)) => [EdgeData](/manual/data#边数据edgedata) | - | |
| onFinish | 成功创建边回调函数 | (edge: [EdgeData](/manual/data#边数据edgedata)) => void | - | |
| style | 新建边的样式,[配置项](#style) | 见下面 | - | |
### style
配置新创建边的样式,详细配置项请参考 [元素 - 边 - 通用边属性 - 样式](/manual/element/edge/base-edge#style)
```json
{
"style": {
"stroke": "red",
"lineWidth": 2
}
}
```
## 代码示例
### 基础创建边功能
```javascript
const graph = new Graph({
container: 'container',
width: 800,
height: 600,
behaviors: ['create-edge'],
});
```
### 自定义创建边功能
```javascript
const graph = new Graph({
// 其他配置,
behaviors: [
{
type: 'create-edge',
style: {
stroke: red,
lineWidth: 3,
},
},
],
});
```
### 使用点击创建边
```javascript
const graph = new Graph({
// 其他配置
behaviors: [
{
type: 'create-edge',
trigger: 'click',
},
],
});
```
## 实际案例
```js | ob { inject: true }
import { Graph } from '@antv/g6';
const graph = new Graph({
container: 'container',
data: {
nodes: [{ id: 'node1' }, { id: 'node2' }, { id: 'node3' }, { id: 'node4' }, { id: 'node5' }],
edges: [
{ source: 'node1', target: 'node2' },
{ source: 'node1', target: 'node3' },
{ source: 'node1', target: 'node4' },
{ source: 'node2', target: 'node3' },
{ source: 'node3', target: 'node4' },
{ source: 'node4', target: 'node5' },
],
},
layout: {
type: 'grid',
},
behaviors: [
{
type: 'create-edge',
trigger: 'drag',
style: {
fill: 'red',
lineWidth: 2,
},
},
],
});
graph.render();
```
Behavior Skill
packages/site/docs/manual/behavior/custom-behavior.en.md anthropic-skill ~1,406 tokens---
title: Custom Behavior
order: 16
---
## Overview
Custom behavior allows users to define one or more related interaction behaviors as a complete interaction based on the comprehensive [event mechanism](/en/api/event) provided by G6, thereby achieving interaction logic that fits business scenarios.
### Execution Logic of Behavior
Typically:
1. Listen for user interaction events
2. Update the canvas or perform other operations based on the events
For example, the `DragCanvas` behavior listens for pointer drag events and updates the camera position based on the drag distance.
### Difference Between Behavior and Plugin
- Both behavior and plugin base classes are derived from the [BaseExtension](https://github.com/antvis/G6/blob/v5/packages/g6/src/registry/extension/index.ts) base class within G6, so the implementation methods for behavior and plugin are basically the same.
- However, based on the concept of visualization, behavior is usually used to handle user interaction events, while plugins are usually used to handle canvas rendering logic, additional component rendering, etc.
:::info{title=Tip}
Due to conceptual distinctions, behavior instances cannot be obtained, while plugin instances can be obtained ([getPluginInstance](/en/api/plugin#graphgetplugininstancekey)).
:::
## When to Use Custom Behavior?
- **Purpose**:
When users need to implement interaction logic that fits business scenarios, we usually need to cooperate with G6's event system to respond to related events and execute the required interaction logic.
- **Without Custom Behavior**:
If custom behavior is not used, users need to perform a series of event listening and response processing through `graph.on` after creating a Graph instance, making code logic processing and orchestration extremely difficult.
- **Advantages of Behavior**:
Each behavior is an independent code module, and the existence of the behavior system facilitates users to decouple business logic, avoid code bloat, and facilitate subsequent maintenance.
- **Conclusion**:
> 1. When users need to implement any interaction logic, they should first consider custom behavior.
> 2. When built-in behavior cannot fully meet business needs, users can also adjust and modify through custom behavior (inheriting built-in behavior).
>
> _(If the features supported by built-in behavior are more general, or if there are bugs in built-in behavior, you are welcome to submit issues or PRs on [Github](https://github.com/antvis/G6))_
## Implementing Behavior
The implementation of a behavior is quite flexible, and you can implement your behavior in your preferred style.
Below is a simple custom behavior implementation. When the user clicks on the canvas, a node is added to the canvas (the fill color of the added node can be defined through behavior configuration):
```typescript
import type { BaseBehaviorOptions, RuntimeContext, IPointerEvent } from '@antv/g6';
import { BaseBehavior, CanvasEvent } from '@antv/g6';
interface ClickAddNodeOptions extends BaseBehaviorOptions {
fill: string;
}
export class ClickAddNode extends BaseBehavior<ClickAddNodeOptions> {
static defaultOptions: Partial<ClickAddNodeOptions> = {
fill: 'red',
};
constructor(context: RuntimeContext, options: ClickAddNodeOptions) {
super(context, Object.assign({}, ClickAddNode.defaultOptions, options));
this.bindEvents();
}
private bindEvents() {
const { graph } = this.context;
graph.on(CanvasEvent.CLICK, this.addNode);
}
private addNode = (event: IPointerEvent) => {
const { graph } = this.context;
const { layerX, layerY } = event.nativeEvent as PointerEvent;
graph.addNodeData([
{
id: 'node-' + Date.now(),
style: { x: layerX, y: layerY, fill: this.options.fill },
},
]);
graph.draw();
};
private unbindEvents() {
const { graph } = this.context;
graph.off(CanvasEvent.CLICK, this.addNode);
}
public destroy() {
// Unbind events when destroyed
this.unbindEvents();
super.destroy();
}
}
```
- In the example code, we implemented a `ClickAddNode` behavior, which adds an event listener to the Graph in the constructor. When the user clicks on the canvas, a node is added at the click position, and the fill color of the added node can be configured.
- `BaseBehavior` is the base class for all behaviors, and each custom behavior needs to inherit this base class.
> Click on the blank area of the canvas below to add a node, and switch the right panel to configure the node color.
<embed src="@/common/manual/custom-extension/behavior/implement-behaviors.md"></embed>
:::info{title=Tip}
The above example is the simplest behavior implementation. In actual development, you may also need to handle logic such as enabling and disabling behaviors.
In addition, there may be event conflicts between multiple behaviors, and you need to handle these conflicts carefully.
:::
## Registering Behavior
Register through the register method provided by G6
```typescript
import { ExtensionCategory, register } from '@antv/g6';
import { ClickAddNode } from 'your-custom-behavior-path';
register(ExtensionCategory.BEHAVIOR, 'click-add-node', ClickAddNode);
```
## Configuring Behavior
You can pass in the behavior type name or configuration parameter object in `behaviors`, such as the above ClickAddNode. See [Configuring Behavior](/en/manual/behavior/overview#配置和使用) for details.
```typescript
const graph = new Graph({
// Other configurations
behaviors: [
{
type: 'click-add-node',
fill: 'blue',
},
],
});
```
Behavior Skill
packages/site/docs/manual/behavior/custom-behavior.zh.md anthropic-skill ~791 tokens---
title: 自定义交互
order: 16
---
## 概述
自定义交互允许用户基于 G6 提供的完善的[事件机制](/api/event),把一个或多个相关的交互行为定义为一个完整的交互,以此实现符合业务场景的交互逻辑。
### 交互的执行逻辑
通常为:
1. 监听用户交互事件
2. 根据事件更新画布或执行其他操作
例如 `DragCanvas` 交互监听指针拖拽事件,根据拖拽的距离更新相机的位置。
### 交互与插件的区别
- 交互和插件的基类都是由 G6 内部的 [BaseExtension](https://github.com/antvis/G6/blob/v5/packages/g6/src/registry/extension/index.ts) 基类派生而来,因此交互和插件的实现方式基本相同
- 但基于可视化的概念区分,交互通常用于处理用户交互事件,而插件通常用于处理画布的渲染逻辑、额外组件渲染等
:::info{title=提示}
因概念上的区分,交互实例不可获取,插件实例可获取( [getPluginInstance](/api/plugin#graphgetplugininstancekey) )
:::
## 什么时候需要自定义交互?
- **目的**:
当用户在实现符合业务场景的交互逻辑时,我们通常需要配合 G6 的事件系统,对相关事件作出响应,执行需要的交互逻辑。
- **不使用自定义交互**:
如果不使用自定义交互,用户需要在创建 Graph 实例后,通过 `graph.on` 进行一系列的事件监听和响应处理,代码逻辑处理和编排会显得异常艰难。
- **交互的优势**:
每个交互行为都是独立的代码模块,交互系统的存在方便用户解耦业务逻辑、避免代码臃肿以及方便用户后续维护等。
- **结论**:
> 1、当用户需要实现任何交互逻辑时,应当首先考虑自定义交互。
>
> 2、当内置交互无法完全满足业务需求时,用户也可以通过自定义交互(继承内置交互)进行调整和修改。
>
> _(如果需要内置交互支持的特性是较通用的,或者内置交互存在 Bug ,这种时候欢迎大家到 [Github](https://github.com/antvis/G6) 提 Issue 或者 PR )_
## 实现交互
一个交互的实现相当灵活,你可以以你喜欢的风格实现你的交互。
下面是一个简单的自定义交互实现,当用户点击画布时,会在画布上添加一个节点(可通过交互配置定义所添加节点的填充颜色):
```typescript
import type { BaseBehaviorOptions, RuntimeContext, IPointerEvent } from '@antv/g6';
import { BaseBehavior, CanvasEvent } from '@antv/g6';
interface ClickAddNodeOptions extends BaseBehaviorOptions {
fill: string;
}
export class ClickAddNode extends BaseBehavior<ClickAddNodeOptions> {
static defaultOptions: Partial<ClickAddNodeOptions> = {
fill: 'red',
};
constructor(context: RuntimeContext, options: ClickAddNodeOptions) {
super(context, Object.assign({}, ClickAddNode.defaultOptions, options));
this.bindEvents();
}
private bindEvents() {
const { graph } = this.context;
graph.on(CanvasEvent.CLICK, this.addNode);
}
private addNode = (event: IPointerEvent) => {
const { graph } = this.context;
const { layerX, layerY } = event.nativeEvent as PointerEvent;
graph.addNodeData([
{
id: 'node-' + Date.now(),
style: { x: layerX, y: layerY, fill: this.options.fill },
},
]);
graph.draw();
};
private unbindEvents() {
const { graph } = this.context;
graph.off(CanvasEvent.CLICK, this.addNode);
}
public destroy() {
// 销毁时解绑事件
this.unbindEvents();
super.destroy();
}
}
```
- 在示例代码中,我们实现了一个 `ClickAddNode` 交互,该交互在构造函数中添加了 Graph 的事件监听,当用户点击画布时,会在点击位置添加一个节点,并且支持配置所添加节点的填充颜色。
- `BaseBehavior` 是所有交互的基类,每个自定义交互都需要继承这个基类实现。
> 点击下面画布中的空白位置以添加一个节点,可切换右侧面板配置节点颜色
<embed src="@/common/manual/custom-extension/behavior/implement-behaviors.md"></embed>
:::info{title=提示}
上述示例是一个最简单的交互实现,实际开发过程中,你可能还需要处理交互的启用与禁用等逻辑。
此外,多个交互之间可能会有事件冲突,你需要小心处理这些冲突。
:::
## 注册交互
通过 G6 提供的 register 方法注册即可
```typescript
import { ExtensionCategory, register } from '@antv/g6';
import { ClickAddNode } from 'your-custom-behavior-path';
register(ExtensionCategory.BEHAVIOR, 'click-add-node', ClickAddNode);
```
## 配置交互
可在 `behaviors` 中传入交互类型名称或配置参数对象,比如上面的 ClickAddNode ,详见[配置交互](/manual/behavior/overview#配置和使用)
```typescript
const graph = new Graph({
// 其他配置
behaviors: [
{
type: 'click-add-node',
fill: 'blue',
},
],
});
```
Behavior Skill
packages/site/docs/manual/behavior/DragCanvas.en.md anthropic-skill ~2,514 tokens---
title: DragCanvas
order: 6
---
## Overview
DragCanvas is a built-in behavior in G6 for implementing canvas dragging functionality, supporting panning the entire canvas by dragging with a mouse or touching the screen. This is the most basic and commonly used navigation behavior in graph visualization, allowing users to freely explore graph content beyond the current viewport.
## Usage Scenarios
This behavior is mainly used for:
- Navigating and browsing large charts to view content outside the current viewport
- Adjusting the view focus to move areas of interest to the center of the viewport
- Combining with zoom interactions to achieve a complete canvas navigation experience
## Online Experience
<embed src="@/common/api/behaviors/drag-canvas.md"></embed>
## Basic Usage
Add this behavior in the graph configuration:
**1. Quick Configuration (Static)**
Declare directly using a string form. This method is simple but only supports default configuration and cannot be dynamically modified after configuration:
```javascript
const graph = new Graph({
// Other configurations...
behaviors: ['drag-canvas'],
});
```
**2. Object Configuration (Recommended)**
Configure using an object form, supporting custom parameters, and can dynamically update the configuration at runtime:
```javascript
const graph = new Graph({
// Other configurations...
behaviors: [
{
type: 'drag-canvas',
key: 'drag-canvas-1',
direction: 'x', // Only allow horizontal dragging
key: 'drag-behavior', // Specify an identifier for the behavior for dynamic updates
},
],
});
```
## Configuration Options
| Option | Description | Type | Default | Required |
| ----------- | -------------------------------------------------------------------------------------------------------------------------------------------------------------------------------------------------------------------- | ------------------------------------------------------------------------------------------------------------------------------------------------------------------ | ----------------------------------------------------------------------------------------------------------------- | -------- |
| type | Behavior type name | string | `drag-canvas` | ✓ |
| enable | Whether to enable this behavior | boolean \| ((event: [Event](/en/api/event#event-object-properties) \| [KeyboardEvent](https://developer.mozilla.org/en-US/docs/Web/API/KeyboardEvent)) => boolean) | `(event) => 'eventType' in event ? event.targetType === 'canvas': true`(Only enabled when clicking on the canvas) | |
| animation | Drag animation configuration, only effective when using keyboard movement | [ViewportAnimationEffectTiming](/en/api/graph#viewportanimationeffecttiming) | - | |
| direction | Allowed drag direction, optional values are: <br/>- Set to `'both'` (default): Allow dragging in any direction <br/>- Set to `'x'`: Only allow horizontal dragging <br/>- Set to `'y'`: Only allow vertical dragging | `'x'` \| `'y'` \| `'both'` | `'both'` (no direction restriction) | |
| range | Draggable viewport range (in viewport size units), [example](#range) | number \| number[] | Infinity | |
| sensitivity | Distance to trigger a single keyboard movement | number | 10 | |
| trigger | Keyboard keys to trigger dragging, [example](#trigger) | object | - | |
| onFinish | Callback function when dragging is completed | () => void | - | |
### range
`range` is used to control the draggable range of the canvas:
- Set as a single number: Use the same value for all four directions
- Set as an array: Specify the range for [top, right, bottom, left] directions respectively
For example:
```javascript
range: 2; // Can drag 2 viewport distances in any direction
range: [1, 2, 1, 2]; // Can drag 1 viewport up and down, 2 viewports left and right
```
The value range for each direction is [0, Infinity], 0 means no dragging, Infinity means unlimited dragging.
### trigger
`trigger` allows you to configure keyboard keys to control canvas movement:
```javascript
{
trigger: {
up: ['ArrowUp'], // Shortcut key for moving up
down: ['ArrowDown'], // Shortcut key for moving down
left: ['ArrowLeft'], // Shortcut key for moving left
right: ['ArrowRight'] // Shortcut key for moving right
}
}
```
You can also configure combination keys:
```javascript
{
trigger: {
up: ['Control', 'ArrowUp'], // Ctrl + Up Arrow
down: ['Control', 'ArrowDown'], // Ctrl + Down Arrow
left: ['Control', 'ArrowLeft'], // Ctrl + Left Arrow
right: ['Control', 'ArrowRight'] // Ctrl + Right Arrow
}
}
```
## Code Examples
### Basic Dragging Function
```javascript
const graph = new Graph({
container: 'container',
width: 800,
height: 600,
behaviors: ['drag-canvas'],
});
```
### Only Allow Horizontal Dragging
```javascript
const graph = new Graph({
// Other configurations...
behaviors: [
{
type: 'drag-canvas',
direction: 'x', // Only allow horizontal dragging
},
],
});
```
### Limit Dragging Range
```javascript
const graph = new Graph({
// Other configurations...
behaviors: [
{
type: 'drag-canvas',
range: 1.5, // Limit dragging range to 1.5 viewport sizes
},
],
});
```
### Control Movement with Keyboard Arrow Keys
```javascript
const graph = new Graph({
// Other configurations...
behaviors: [
{
type: 'drag-canvas',
trigger: {
up: ['ArrowUp'],
down: ['ArrowDown'],
left: ['ArrowLeft'],
right: ['ArrowRight'],
},
animation: {
duration: 100, // Add smooth animation effect
},
},
],
});
```
## FAQ
### 1. Difference between DragCanvas and other behaviors
- `DragCanvas` is used for dragging the entire canvas view
- `DragElement` is used for dragging individual graph elements (nodes/edges/combinations)
- `ScrollCanvas` is used for scrolling the canvas with the mouse wheel without changing the zoom ratio
## Practical Example
```js | ob { inject: true }
import { Graph } from '@antv/g6';
const graph = new Graph({
container: 'container',
layout: {
type: 'grid',
},
data: {
nodes: [{ id: 'node1' }, { id: 'node2' }, { id: 'node3' }, { id: 'node4' }, { id: 'node5' }],
edges: [
{ source: 'node1', target: 'node2' },
{ source: 'node1', target: 'node3' },
{ source: 'node1', target: 'node4' },
{ source: 'node2', target: 'node3' },
{ source: 'node3', target: 'node4' },
{ source: 'node4', target: 'node5' },
],
},
behaviors: ['drag-canvas'],
});
graph.render();
```
Behavior Skill
packages/site/docs/manual/behavior/DragCanvas.zh.md anthropic-skill ~1,780 tokens---
title: 拖拽画布 DragCanvas
order: 6
---
## 概述
DragCanvas 是 G6 中用于实现画布拖拽功能的内置交互,支持通过鼠标或触摸屏幕拖动来平移整个画布。这是图可视化中最基础且常用的导航交互,让用户能够自由探索超出当前视口的图内容。
## 使用场景
这一交互主要用于:
- 导航和浏览大型图表,查看当前视口外的内容
- 调整视图焦点,将感兴趣的区域移动到视口中心
- 与缩放交互结合,实现完整的画布导航体验
## 在线体验
<embed src="@/common/api/behaviors/drag-canvas.md"></embed>
## 基本用法
在图配置中添加这一交互:
**1. 快速配置(静态)**
使用字符串形式直接声明,这种方式简洁但仅支持默认配置,且配置后不可动态修改:
```javascript
const graph = new Graph({
// 其他配置...
behaviors: ['drag-canvas'],
});
```
**2. 对象配置(推荐)**
使用对象形式进行配置,支持自定义参数,且可以在运行时动态更新配置:
```javascript
const graph = new Graph({
// 其他配置...
behaviors: [
{
type: 'drag-canvas',
key: 'drag-canvas-1',
direction: 'x', // 只允许水平方向拖拽
key: 'drag-behavior', // 为交互指定标识符,方便动态更新
},
],
});
```
## 配置项
| 配置项 | 说明 | 类型 | 默认值 | 必选 |
| ----------- | ------------------------------------------------------------------------------------------------------------------------------------------------------ | ---------------------------------------------------------------------------------------------------------------------------------------------------- | ------------------------------------------------------------------------------------------- | ---- |
| type | 交互类型名称 | string | `drag-canvas` | ✓ |
| enable | 是否启用该交互 | boolean \| ((event: [Event](/api/event#事件对象属性) \| [KeyboardEvent](https://developer.mozilla.org/zh-CN/docs/Web/API/KeyboardEvent)) => boolean) | `(event) => 'eventType' in event ? event.targetType === 'canvas': true`(仅在点击画布时启用) | |
| animation | 拖拽动画配置,仅在使用按键移动时有效 | [ViewportAnimationEffectTiming](/api/graph#viewportanimationeffecttiming) | - | |
| direction | 允许的拖拽方向,可选值有:<br/>- 设为 `'both'`(默认):允许在任意方向拖拽 <br/>- 设为 `'x'`:只允许水平方向拖拽 <br/>- 设为 `'y'`:只允许垂直方向拖拽 | `'x'` \| `'y'` \| `'both'` | `'both'` (不限制方向) | |
| range | 可拖拽的视口范围(以视口大小为单位),[示例](#range) | number \| number[] | Infinity | |
| sensitivity | 触发一次按键移动的距离 | number | 10 | |
| trigger | 触发拖拽的键盘按键,[示例](#trigger) | object | - | |
| onFinish | 拖拽完成时的回调函数 | () => void | - | |
### range
`range` 用于控制画布可拖拽的范围:
- 设置为单个数字:四个方向使用相同的值
- 设置为数组:分别指定 [上, 右, 下, 左] 四个方向的范围
例如:
```javascript
range: 2; // 在任何方向上都可以拖拽2个视口的距离
range: [1, 2, 1, 2]; // 上下方向可拖拽1个视口,左右方向可拖拽2个视口
```
每个方向的取值范围是 [0, Infinity],0表示不能拖拽,Infinity表示无限拖拽。
### trigger
`trigger` 允许你配置键盘按键来控制画布移动:
```javascript
{
trigger: {
up: ['ArrowUp'], // 向上移动的快捷键
down: ['ArrowDown'], // 向下移动的快捷键
left: ['ArrowLeft'], // 向左移动的快捷键
right: ['ArrowRight'] // 向右移动的快捷键
}
}
```
你也可以配置组合键:
```javascript
{
trigger: {
up: ['Control', 'ArrowUp'], // Ctrl + 上箭头
down: ['Control', 'ArrowDown'], // Ctrl + 下箭头
left: ['Control', 'ArrowLeft'], // Ctrl + 左箭头
right: ['Control', 'ArrowRight'] // Ctrl + 右箭头
}
}
```
## 代码示例
### 基础拖拽功能
```javascript
const graph = new Graph({
container: 'container',
width: 800,
height: 600,
behaviors: ['drag-canvas'],
});
```
### 只允许水平拖拽
```javascript
const graph = new Graph({
// 其他配置...
behaviors: [
{
type: 'drag-canvas',
direction: 'x', // 只允许水平拖拽
},
],
});
```
### 限制拖拽范围
```javascript
const graph = new Graph({
// 其他配置...
behaviors: [
{
type: 'drag-canvas',
range: 1.5, // 限制拖拽范围为1.5个视口大小
},
],
});
```
### 使用键盘方向键控制移动
```javascript
const graph = new Graph({
// 其他配置...
behaviors: [
{
type: 'drag-canvas',
trigger: {
up: ['ArrowUp'],
down: ['ArrowDown'],
left: ['ArrowLeft'],
right: ['ArrowRight'],
},
animation: {
duration: 100, // 添加平滑动画效果
},
},
],
});
```
## 常见问题
### 1. DragCanvas与其他交互的区别
- `DragCanvas` 用于拖拽整个画布视图
- `DragElement` 用于拖拽单个图元素(节点/边/组合)
- `ScrollCanvas` 用于滚轮滚动画布,不改变缩放比例
## 实际案例
```js | ob { inject: true }
import { Graph } from '@antv/g6';
const graph = new Graph({
container: 'container',
layout: {
type: 'grid',
},
data: {
nodes: [{ id: 'node1' }, { id: 'node2' }, { id: 'node3' }, { id: 'node4' }, { id: 'node5' }],
edges: [
{ source: 'node1', target: 'node2' },
{ source: 'node1', target: 'node3' },
{ source: 'node1', target: 'node4' },
{ source: 'node2', target: 'node3' },
{ source: 'node3', target: 'node4' },
{ source: 'node4', target: 'node5' },
],
},
behaviors: ['drag-canvas'],
});
graph.render();
```
Behavior Skill
packages/site/docs/manual/behavior/DragElement.en.md anthropic-skill ~3,443 tokens---
title: DragElement
order: 7
---
## Overview
DragElement is a built-in behavior in G6 for implementing **element dragging** functionality. It has the following core features:
1. **Support for multiple element types**: Supports dragging of both nodes and combos simultaneously
2. **Intelligent multi-selection**: Supports dragging multiple selected elements at the same time
3. **Visual feedback**: Provides various visual feedback mechanisms such as ghost nodes, edge visibility, mouse styles, etc.
4. **Flexible drag effects**: Supports various drag operation effects such as move, link, free drag, etc.
5. **Parent-child relationship handling**: Automatically handles element hierarchy during dragging, especially when dealing with combo structures
## Online Experience
<embed src="@/common/api/behaviors/drag-element.md"></embed>
## Basic Usage
Add this behavior in the graph configuration:
**1. Quick Configuration (Static)**
Declare directly using a string form. This method is simple but only supports default configuration and cannot be dynamically modified after configuration:
```javascript
const graph = new Graph({
// Other configurations...
behaviors: ['drag-element'],
});
```
**2. Object Configuration (Recommended)**
Configure using an object form, supporting custom parameters, and can dynamically update the configuration at runtime:
```javascript
const graph = new Graph({
// Other configurations...
behaviors: [
{
type: 'drag-element',
key: 'drag-element-1',
enableAnimation: true,
dropEffect: 'move',
shadow: true, // Enable ghost node
},
],
});
```
## Configuration Options
| Option | Description | Type | Default | Required |
| ---------- | --------------------------------------------------------------------------------------------------------------------------------------------------------------------------------------------------------------------------------------------------------------------------------------------------------------------------------------------------------------------------------------------------------------------------------------------------------------------------------------------------------------- | -------------------------------------------------------- | ---------------------------------------------- | -------- |
| type | Behavior type name | string | `drag-element` | ✓ |
| key | Unique identifier for the behavior, used for subsequent operations | string | - | |
| enable | Whether to enable the drag function, by default nodes and combos can be dragged | boolean \| ((event: IElementDragEvent) => boolean) | `['node', 'combo'].includes(event.targetType)` | |
| animation | Whether to enable drag animation | boolean | true | |
| state | Identifier for the selected state of nodes, when multi-selection is enabled, it will find the selected nodes based on this state | string | `selected` | |
| dropEffect | Defines the operation effect after dragging ends, optional values are: <br/>- `link`: Set the dragged element as a child of the target element <br/>- `move`: Move the element and automatically update the size of the parent element (such as combo) <br/>- `none`: Only update the position of the drag target without performing other operations | `link` \| `move` \| `none` | `move` | |
| hideEdge | Controls the display state of edges during dragging, optional values are: <br/>- `none`: Do not hide any edges <br/>- `out`: Hide edges with the current node as the source node <br/>- `in`: Hide edges with the current node as the target node <br/>- `both`: Hide all edges related to the current node <br/>- `all`: Hide all edges in the graph <br/>⚠️ Note: When `shadow` (ghost node) is enabled, the `hideEdge` configuration will not take effect. | `none` \| `all` \| `in` \| `out` \| `both` | `none` | |
| shadow | Whether to enable ghost nodes, which use a shape to follow the mouse movement. [Customize ghost node style](#shadow-style-configuration) ⚠️Note: React nodes do not support enabling | boolean | false | |
| cursor | Customize the mouse style during dragging, [configuration options](#cursor) | { default?: Cursor; grab: Cursor; grabbing: Cursor } | - | |
| trigger | Press this shortcut key in combination with mouse perform drag element **Key reference:** _<a href="https://developer.mozilla.org/en-US/docs/Web/API/UI_Events/Keyboard_event_key_values" target="_blank" rel="noopener noreferrer">MDN Key Values</a>_. If set to an **empty array**, it means drag element can be performed with mouse without pressing other keys <br/> ⚠️ Note, setting `trigger` to `['drag']` will cause the `drag-canvas` behavior to fail. The two cannot be configured simultaneously. | string[] \| (`Control` \| `Shift`\| `Alt` \| `......`)[] | [`shift`] | |
### cursor
`cursor` is used to customize the mouse pointer style during dragging:
- `default`: Pointer style in default state
- `grab`: Pointer style when hovering over a draggable element
- `grabbing`: Pointer style when dragging
Optional values are: `auto` | `default` | `none` | `context-menu` | `help` | `pointer` | `progress` | `wait` | `cell` | `crosshair` | `text` | `vertical-text` | `alias` | `copy` | `move` | `no-drop` | `not-allowed` | `grab` | `grabbing` | `all-scroll` | `col-resize` | `row-resize` | `n-resize` | `e-resize` | `s-resize` | `w-resize` | `ne-resize` | `nw-resize` | `se-resize` | `sw-resize` | `ew-resize` | `ns-resize` | `nesw-resize` | `nwse-resize` | `zoom-in` | `zoom-out`
Example configuration:
```js
cursor: {
default: 'default', // Use normal pointer by default
grab: 'grab', // Show grab pointer when draggable
grabbing: 'grabbing' // Show grabbing pointer when dragging
}
```
### shadow Style Configuration
When `shadow: true` is enabled, you can customize the style of the ghost node with the following properties:
| Option | Description | Type | Default |
| -------------------- | --------------------------------- | ----------------------------------- | ------------------------------------------- |
| shadowFill | Ghost node fill color | string | `#F3F9FF` |
| shadowFillOpacity | Ghost node fill color opacity | number | 0.5 |
| shadowStroke | Ghost node stroke color | string | `#1890FF` |
| shadowStrokeOpacity | Ghost node stroke opacity | number | 0.9 |
| shadowLineDash | Ghost node dash configuration | number[] | [5, 5] |
| shadowZIndex | Ghost node rendering level | number | 100 |
| shadowWidth | Ghost node width | number | Width of the target element's bounding box |
| shadowHeight | Ghost node height | number | Height of the target element's bounding box |
| shadowOpacity | Overall opacity of the ghost node | number | |
| shadowLineWidth | Ghost node line width | number | |
| shadowLineCap | Ghost node line cap style | `'butt'` \| `'round'` \| `'square'` | |
| shadowLineJoin | Ghost node line join style | `'miter'` \| `'round'` \| `'bevel'` | |
| shadowLineDashOffset | Ghost node dash offset | number | |
| shadowCursor | Ghost node mouse style | string | |
| shadowVisibility | Ghost node visibility | `'visible'` \| `'hidden'` | |
Example configuration:
```javascript
{
type: 'drag-element',
shadow: true,
// Customize ghost node style
shadowFill: '#E8F3FF',
shadowFillOpacity: 0.4,
shadowStroke: '#1890FF',
shadowStrokeOpacity: 0.8,
shadowLineDash: [4, 4],
shadowZIndex: 99
}
```
> Note: The ghost node style inherits from [BaseStyleProps](/en/manual/element/shape/properties#baseshapestyle), the above configuration items are obtained by adding the `shadow` prefix to the property name.
## Code Examples
### Multi-selection Dragging
Need to cooperate with the `click-select` behavior to achieve multi-selection, and then associate the selected state through the `state` parameter:
```javascript
const graph = new Graph({
behaviors: [
{
type: 'click-select',
multiple: true,
state: 'selected',
},
{
type: 'drag-element',
state: 'selected', // All nodes in the selected state will be moved simultaneously during dragging
},
],
});
```
Behavior Skill
packages/site/docs/manual/behavior/DragElement.zh.md anthropic-skill ~2,341 tokens---
title: 拖拽元素 DragElement
order: 7
---
## 概述
DragElement 是 G6 中用于实现 **元素拖拽** 功能的内置交互。它具有以下核心特性:
1. **多元素类型支持**:可以同时支持节点(Node)和组合(Combo)的拖拽
2. **智能多选**:支持同时拖拽多个选中状态的元素
3. **视觉反馈**:提供幽灵节点、边的显隐、鼠标样式等多种视觉反馈机制
4. **灵活的拖拽效果**:支持移动、链接、自由拖拽等多种拖拽操作效果
5. **父子关系处理**:自动处理拖拽过程中的元素层级关系,特别是在处理 Combo 结构时
## 在线体验
<embed src="@/common/api/behaviors/drag-element.md"></embed>
## 基本用法
在图配置中添加这一交互:
**1. 快速配置(静态)**
使用字符串形式直接声明,这种方式简洁但仅支持默认配置,且配置后不可动态修改:
```javascript
const graph = new Graph({
// 其他配置...
behaviors: ['drag-element'],
});
```
**2. 对象配置(推荐)**
使用对象形式进行配置,支持自定义参数,且可以在运行时动态更新配置:
```javascript
const graph = new Graph({
// 其他配置...
behaviors: [
{
type: 'drag-element',
key: 'drag-element-1',
enableAnimation: true,
dropEffect: 'move',
shadow: true, // 启用拖拽幽灵节点
},
],
});
```
## 配置项
| 配置项 | 说明 | 类型 | 默认值 | 必选 |
| ---------- | ------------------------------------------------------------------------------------------------------------------------------------------------------------------------------------------------------------------------------------------------------------------------------------------------------------------------------------------------------- | -------------------------------------------------------- | ---------------------------------------------- | ---- |
| type | 交互类型名称 | string | `drag-element` | ✓ |
| key | 交互唯一标识符,用于后续操作交互 | string | - | |
| enable | 是否启用拖拽功能,默认可以拖拽节点和 Combo | boolean \| ((event: IElementDragEvent) => boolean) | `['node', 'combo'].includes(event.targetType)` | |
| animation | 是否启用拖拽动画 | boolean | true | |
| state | 节点选中状态的标识,启用多选时会基于该状态查找选中的节点 | string | `selected` | |
| dropEffect | 定义拖拽结束后的操作效果,可选值有:<br/>- `link`: 将拖拽元素设置为目标元素的子元素 <br/>- `move`: 移动元素并自动更新父元素(如 Combo)的尺寸 <br/>- `none`: 仅更新拖拽目标的位置,不执行其他操作 | `link` \| `move` \| `none` | `move` | |
| hideEdge | 控制拖拽过程中边的显示状态,可选值有: <br/>- `none`: 不隐藏任何边 <br/>- `out`: 隐藏以当前节点为源节点的边 <br/>- `in`: 隐藏以当前节点为目标节点的边 <br/>- `both`: 隐藏与当前节点相关的所有边 <br/>- `all`: 隐藏图中所有边 <br/>⚠️ 注意:当启用 `shadow`(幽灵节点)时,`hideEdge` 配置将不生效。 | `none` \| `all` \| `in` \| `out` \| `both` | `none` | |
| shadow | 是否启用幽灵节点,即用一个图形代替节点跟随鼠标移动。[自定义幽灵节点样式](#shadow-样式配置) ⚠️注意:React 节点不支持启用 | boolean | false | |
| cursor | 自定义鼠标样式,[配置项](#cursor) | { default?: Cursor; grab: Cursor; grabbing: Cursor } | - | |
| trigger | 同时按下快捷键才能拖拽元素 **按键参考:** _<a href="https://developer.mozilla.org/zh-CN/docs/Web/API/UI_Events/Keyboard_event_key_values" target="_blank" rel="noopener noreferrer">MDN Key Values</a>_ 。若设为**空数组**时则表示不需要按下其他按键配合 <br/> ⚠️ 注意,`trigger` 设置为 `['drag']` 时会导致 `drag-canvas` 行为失效。两者不可同时配置。 | string[] \| (`Control` \| `Shift`\| `Alt` \| `......`)[] | [] | |
### cursor
`cursor` 用于自定义拖拽过程中的鼠标指针样式:
- `default`: 默认状态下的指针样式
- `grab`: 鼠标悬停在可拖拽元素上时的指针样式
- `grabbing`: 正在拖拽时的指针样式
可选值有:`auto` | `default` | `none` | `context-menu` | `help` | `pointer` | `progress` | `wait` | `cell` | `crosshair` | `text` | `vertical-text` | `alias` | `copy` | `move` | `no-drop` | `not-allowed` | `grab` | `grabbing` | `all-scroll` | `col-resize` | `row-resize` | `n-resize` | `e-resize` | `s-resize` | `w-resize` | `ne-resize` | `nw-resize` | `se-resize` | `sw-resize` | `ew-resize` | `ns-resize` | `nesw-resize` | `nwse-resize` | `zoom-in` | `zoom-out`
示例配置:
```js
cursor: {
default: 'default', // 默认使用普通指针
grab: 'grab', // 可拖拽时显示抓取指针
grabbing: 'grabbing' // 拖拽中显示抓取中指针
}
```
### shadow 样式配置
当启用 `shadow: true` 时,可以通过以下属性自定义幽灵节点的样式:
| 配置项 | 说明 | 类型 | 默认值 |
| -------------------- | ---------------------- | ----------------------------------- | -------------------- |
| shadowFill | 幽灵节点填充色 | string | `#F3F9FF` |
| shadowFillOpacity | 幽灵节点填充色透明度 | number | 0.5 |
| shadowStroke | 幽灵节点描边颜色 | string | `#1890FF` |
| shadowStrokeOpacity | 幽灵节点描边透明度 | number | 0.9 |
| shadowLineDash | 幽灵节点虚线配置 | number[] | [5, 5] |
| shadowZIndex | 幽灵节点渲染层级 | number | 100 |
| shadowWidth | 幽灵节点宽度 | number | 目标元素的包围盒宽度 |
| shadowHeight | 幽灵节点高度 | number | 目标元素的包围盒高度 |
| shadowOpacity | 幽灵节点整体透明度 | number | |
| shadowLineWidth | 幽灵节点线宽度 | number | |
| shadowLineCap | 幽灵节点线段端点样式 | `'butt'` \| `'round'` \| `'square'` | |
| shadowLineJoin | 幽灵节点线段连接处样式 | `'miter'` \| `'round'` \| `'bevel'` | |
| shadowLineDashOffset | 幽灵节点虚线偏移量 | number | |
| shadowCursor | 幽灵节点鼠标样式 | string | |
| shadowVisibility | 幽灵节点可见性 | `'visible'` \| `'hidden'` | |
示例配置:
```javascript
{
type: 'drag-element',
shadow: true,
// 自定义幽灵节点样式
shadowFill: '#E8F3FF',
shadowFillOpacity: 0.4,
shadowStroke: '#1890FF',
shadowStrokeOpacity: 0.8,
shadowLineDash: [4, 4],
shadowZIndex: 99
}
```
> 注意:幽灵节点样式继承自 [BaseStyleProps](/manual/element/shape/properties#baseshapestyle),上述配置项是在属性名前添加 `shadow` 前缀得到的。
## 代码示例
### 多选推拽
需要配合 `click-select` 行为实现多选,然后通过 `state` 参数关联选中状态:
```javascript
const graph = new Graph({
behaviors: [
{
type: 'click-select',
multiple: true,
state: 'selected',
},
{
type: 'drag-element',
state: 'selected', // 拖拽时会同时移动所有 selected 状态的节点
},
],
});
```
Behavior Skill
packages/site/docs/manual/behavior/DragElementForce.en.md anthropic-skill ~3,072 tokens---
title: DragElementForce
order: 8
---
## Overview
DragElementForce is a built-in behavior in G6 for implementing node dragging under `d3-force` and `d3-force-3d` layouts. During dragging, the layout is **recalculated in real-time**, allowing the graph layout to dynamically adjust to accommodate the new position of the nodes.
<img alt="Effect of DragElementForce" src="https://mdn.alipayobjects.com/huamei_qa8qxu/afts/img/A*I5uDQZWTzMsAAAAAAAAAAAAADmJ7AQ/original" />
## Basic Usage
Add this behavior in the graph configuration:
**1. Quick Configuration (Static)**
Declare directly using a string form. This method is simple but only supports default configuration and cannot be dynamically modified after configuration:
```javascript
const graph = new Graph({
// Other configurations...
behaviors: ['drag-element-force'],
});
```
**2. Object Configuration (Recommended)**
Configure using an object form, supporting custom parameters, and can dynamically update the configuration at runtime:
```javascript
const graph = new Graph({
// Other configurations...
behaviors: [
{
type: 'drag-element-force',
key: 'drag-element-force-1',
fixed: true, // Fix node position after dragging
},
],
});
```
## Configuration Options
| Option | Description | Type | Default | Required |
| ------------------------------------------ | --------------------------------------------------------------------------------------------------------------------------------------------------------------------------------------------------------------------------------------------------------------------------------------------------------------------------------------------------------------------------------------------------------------------------------------------------------------------------------------------------------------- | -------------------------------------------------------- | ---------------------------------------------- | -------- |
| type | Behavior type name, set `type: 'drag-element-force'` to enable this behavior | string | `drag-element-force` | ✓ |
| key | Unique identifier for the behavior, used for subsequent operations | string | - | |
| fixed | Whether to keep the node position fixed after dragging ends, boolean values represent: <br/>- true: After dragging ends, the node's position will remain fixed and not be affected by the layout algorithm <br/>- false: After dragging ends, the node's position will continue to be affected by the layout algorithm | boolean | false | |
| enable | Whether to enable the drag function, by default nodes and combos can be dragged | boolean \| ((event: IElementDragEvent) => boolean) | `['node', 'combo'].includes(event.targetType)` | |
| state | Identifier for the selected state of nodes, when multi-selection is enabled, it will find the selected nodes based on this state | string | `selected` | |
| hideEdge | Controls the display state of edges during dragging, optional values are: <br/>- `none`: Do not hide any edges <br/>- `out`: Hide edges with the current node as the source node <br/>- `in`: Hide edges with the current node as the target node <br/>- `both`: Hide all edges related to the current node <br/>- `all`: Hide all edges in the graph <br/>⚠️ Note: When `shadow` (ghost node) is enabled, the `hideEdge` configuration will not take effect. | `none` \| `all` \| `in` \| `out` \| `both` | `none` | |
| cursor | Customize the mouse style during dragging, [example](#cursor) | { default?: Cursor; grab: Cursor; grabbing: Cursor } | - | |
| trigger | Press this shortcut key in combination with mouse perform drag element **Key reference:** _<a href="https://developer.mozilla.org/en-US/docs/Web/API/UI_Events/Keyboard_event_key_values" target="_blank" rel="noopener noreferrer">MDN Key Values</a>_. If set to an **empty array**, it means drag element can be performed with mouse without pressing other keys <br/> ⚠️ Note, setting `trigger` to `['drag']` will cause the `drag-canvas` behavior to fail. The two cannot be configured simultaneously. | string[] \| (`Control` \| `Shift`\| `Alt` \| `......`)[] | [`shift`] | |
### cursor
`cursor` is used to customize the mouse pointer style during dragging:
- `default`: Pointer style in default state
- `grab`: Pointer style when hovering over a draggable element
- `grabbing`: Pointer style when dragging
Optional values are: `auto` | `default` | `none` | `context-menu` | `help` | `pointer` | `progress` | `wait` | `cell` | `crosshair` | `text` | `vertical-text` | `alias` | `copy` | `move` | `no-drop` | `not-allowed` | `grab` | `grabbing` | `all-scroll` | `col-resize` | `row-resize` | `n-resize` | `e-resize` | `s-resize` | `w-resize` | `ne-resize` | `nw-resize` | `se-resize` | `sw-resize` | `ew-resize` | `ns-resize` | `nesw-resize` | `nwse-resize` | `zoom-in` | `zoom-out`
Example configuration:
```js
cursor: {
default: 'default', // Use normal pointer by default
grab: 'grab', // Show grab pointer when draggable
grabbing: 'grabbing' // Show grabbing pointer when dragging
}
```
## FAQ
### 1. What is the difference between DragElementForce and DragElement?
- `DragElementForce` is specifically used for `d3-force` or `d3-force-3d` layouts, and recalculates the layout in real-time during dragging
- `DragElement` is a general drag interaction and does not trigger layout recalculation
## Practical Example
### Mesh Effect
```js | ob { inject: true }
import { Graph } from '@antv/g6';
function getData(size = 10) {
const nodes = Array.from({ length: size * size }, (_, i) => ({ id: `${i}` }));
const edges = [];
for (let y = 0; y < size; ++y) {
for (let x = 0; x < size; ++x) {
if (y > 0) edges.push({ source: `${(y - 1) * size + x}`, target: `${y * size + x}` });
if (x > 0) edges.push({ source: `${y * size + (x - 1)}`, target: `${y * size + x}` });
}
}
return { nodes, edges };
}
const graph = new Graph({
data: getData(),
layout: {
type: 'd3-force',
manyBody: {
strength: -30,
},
link: {
strength: 1,
distance: 20,
iterations: 10,
},
},
node: {
style: {
size: 10,
fill: '#000',
},
},
edge: {
style: {
stroke: '#000',
},
},
behaviors: [{ type: 'drag-element-force' }, 'zoom-canvas'],
});
graph.render();
window.addPanel((gui) => {
gui.add({ msg: 'Try to drag nodes' }, 'msg').name('Tips').disable();
});
```
### Fix Dragged Nodes
```js | ob { inject: true }
import { Graph } from '@antv/g6';
const data = {
nodes: new Array(10).fill(0).map((_, i) => ({ id: `${i}`, label: `${i}` })),
edges: [
{ source: '0', target: '1' },
{ source: '0', target: '2' },
{ source: '0', target: '3' },
{ source: '0', target: '4' },
{ source: '0', target: '5' },
{ source: '0', target: '7' },
{ source: '0', target: '8' },
{ source: '0', target: '9' },
{ source: '2', target: '3' },
{ source: '4', target: '5' },
{ source: '4', target: '6' },
{ source: '5', target: '6' },
],
};
const graph = new Graph({
container: 'container',
data,
node: {
style: {
labelText: (d) => d.label,
labelPlacement: 'middle',
labelFill: '#fff',
},
},
layout: {
type: 'd3-force',
link: {
distance: 100,
strength: 2,
},
collide: {
radius: 40,
},
},
behaviors: [
{
type: 'drag-element-force',
fixed: true,
},
],
});
graph.render();
```
## Shadow Style
### shadow{[BaseStyleProps](https://g.antv.antgroup.com/api/basic/display-object#%E7%BB%98%E5%9B%BE%E5%B1%9E%E6%80%A7)}
<details><summary>An expression like icon{TextStyleProps} indicates that properties of the TextStyleProps type are prefixed with icon in camelCase format.</summary>
TextStyleProps includes the following properties:
- fill
- fontSize
- fontWeight
- ...
icon{TextStyleProps} means you need to use the following property names:
- iconFill
- iconFontSize
- iconFontWeight
- ...
</details>
Behavior Skill
packages/site/docs/manual/behavior/DragElementForce.zh.md anthropic-skill ~2,202 tokens---
title: 力导向拖拽元素 DragElementForce
order: 8
---
## 概述
DragElementForce 是 G6 中用于实现 `d3-force` 和 `d3-force-3d` 布局下节点拖拽的内置交互。在拖拽过程中会 **实时重新计算布局**,使得图的布局能够动态调整以适应节点的新位置。
<img alt="力导向拖拽元素效果图" src="https://mdn.alipayobjects.com/huamei_qa8qxu/afts/img/A*I5uDQZWTzMsAAAAAAAAAAAAADmJ7AQ/original" />
## 基本用法
在图配置中添加这一交互:
**1. 快速配置(静态)**
使用字符串形式直接声明,这种方式简洁但仅支持默认配置,且配置后不可动态修改:
```javascript
const graph = new Graph({
// 其他配置...
behaviors: ['drag-element-force'],
});
```
**2. 对象配置(推荐)**
使用对象形式进行配置,支持自定义参数,且可以在运行时动态更新配置:
```javascript
const graph = new Graph({
// 其他配置...
behaviors: [
{
type: 'drag-element-force',
key: 'drag-element-force-1',
fixed: true, // 拖拽后固定节点位置
},
],
});
```
## 配置项
| 配置项 | 说明 | 类型 | 默认值 | 必选 |
| ------------------------------------------ | ------------------------------------------------------------------------------------------------------------------------------------------------------------------------------------------------------------------------------------------------------------------------------------------------------------------------------------------------------- | -------------------------------------------------------- | ---------------------------------------------- | ---- |
| type | 交互类型名称,这里设置 `type: 'drag-element-force'` 启用此交互 | string | `drag-element-force` | ✓ |
| key | 交互唯一标识符,用于后续操作交互 | string | - | |
| fixed | 在拖拽结束后,节点是否保持固定位置,布尔值代表:<br/>- true: 在拖拽结束后,节点的位置将保持固定,不受布局算法的影响 <br/>- false: 在拖拽结束后,节点的位置将继续受到布局算法的影响 | boolean | false | |
| enable | 是否启用拖拽功能,默认可以拖拽节点和 Combo | boolean \| ((event: IElementDragEvent) => boolean) | `['node', 'combo'].includes(event.targetType)` | |
| state | 节点选中状态的标识,启用多选时会基于该状态查找选中的节点 | string | `selected` | |
| hideEdge | 控制拖拽过程中边的显示状态,可选值有:<br/>- `none`: 不隐藏任何边 <br/>- `out`: 隐藏以当前节点为源节点的边 <br/>- `in`: 隐藏以当前节点为目标节点的边 <br/>- `both`: 隐藏与当前节点相关的所有边 <br/>- `all`: 隐藏图中所有边 <br/>⚠️ 注意:当启用 `shadow`(幽灵节点)时,`hideEdge` 配置将不生效。 | `none` \| `all` \| `in` \| `out` \| `both` | `none` | |
| cursor | 自定义鼠标样式,[示例](#cursor) | { default?: Cursor; grab: Cursor; grabbing: Cursor } | - | |
| trigger | 同时按下快捷键才能拖拽元素 **按键参考:** _<a href="https://developer.mozilla.org/zh-CN/docs/Web/API/UI_Events/Keyboard_event_key_values" target="_blank" rel="noopener noreferrer">MDN Key Values</a>_ 。若设为**空数组**时则表示不需要按下其他按键配合 <br/> ⚠️ 注意,`trigger` 设置为 `['drag']` 时会导致 `drag-canvas` 行为失效。两者不可同时配置。 | string[] \| (`Control` \| `Shift`\| `Alt` \| `......`)[] | [] | |
### cursor
`cursor` 用于自定义拖拽过程中的鼠标指针样式:
- `default`: 默认状态下的指针样式
- `grab`: 鼠标悬停在可拖拽元素上时的指针样式
- `grabbing`: 正在拖拽时的指针样式
可选值有:`auto` | `default` | `none` | `context-menu` | `help` | `pointer` | `progress` | `wait` | `cell` | `crosshair` | `text` | `vertical-text` | `alias` | `copy` | `move` | `no-drop` | `not-allowed` | `grab` | `grabbing` | `all-scroll` | `col-resize` | `row-resize` | `n-resize` | `e-resize` | `s-resize` | `w-resize` | `ne-resize` | `nw-resize` | `se-resize` | `sw-resize` | `ew-resize` | `ns-resize` | `nesw-resize` | `nwse-resize` | `zoom-in` | `zoom-out`
示例配置:
```js
cursor: {
default: 'default', // 默认使用普通指针
grab: 'grab', // 可拖拽时显示抓取指针
grabbing: 'grabbing' // 拖拽中显示抓取中指针
}
```
## 常见问题
### 1. DragElementForce 和 DragElement 有什么区别?
- `DragElementForce` 专门用于 `d3-force` 或 `d3-force-3d` 布局,拖拽时会实时重新计算布局
- `DragElement` 是通用的拖拽交互,不会触发布局重新计算
## 实际案例
### 网格效果
```js | ob { inject: true }
import { Graph } from '@antv/g6';
function getData(size = 10) {
const nodes = Array.from({ length: size * size }, (_, i) => ({ id: `${i}` }));
const edges = [];
for (let y = 0; y < size; ++y) {
for (let x = 0; x < size; ++x) {
if (y > 0) edges.push({ source: `${(y - 1) * size + x}`, target: `${y * size + x}` });
if (x > 0) edges.push({ source: `${y * size + (x - 1)}`, target: `${y * size + x}` });
}
}
return { nodes, edges };
}
const graph = new Graph({
data: getData(),
layout: {
type: 'd3-force',
manyBody: {
strength: -30,
},
link: {
strength: 1,
distance: 20,
iterations: 10,
},
},
node: {
style: {
size: 10,
fill: '#000',
},
},
edge: {
style: {
stroke: '#000',
},
},
behaviors: [{ type: 'drag-element-force' }, 'zoom-canvas'],
});
graph.render();
window.addPanel((gui) => {
gui.add({ msg: 'Try to drag nodes' }, 'msg').name('Tips').disable();
});
```
### 固定被拖拽的节点
```js | ob { inject: true }
import { Graph } from '@antv/g6';
const data = {
nodes: new Array(10).fill(0).map((_, i) => ({ id: `${i}`, label: `${i}` })),
edges: [
{ source: '0', target: '1' },
{ source: '0', target: '2' },
{ source: '0', target: '3' },
{ source: '0', target: '4' },
{ source: '0', target: '5' },
{ source: '0', target: '7' },
{ source: '0', target: '8' },
{ source: '0', target: '9' },
{ source: '2', target: '3' },
{ source: '4', target: '5' },
{ source: '4', target: '6' },
{ source: '5', target: '6' },
],
};
const graph = new Graph({
container: 'container',
data,
node: {
style: {
labelText: (d) => d.label,
labelPlacement: 'middle',
labelFill: '#fff',
},
},
layout: {
type: 'd3-force',
link: {
distance: 100,
strength: 2,
},
collide: {
radius: 40,
},
},
behaviors: [
{
type: 'drag-element-force',
fixed: true,
},
],
});
graph.render();
```
Behavior Skill
packages/site/docs/manual/behavior/FixElementSize.en.md anthropic-skill ~2,872 tokens---
title: FixElementSize
order: 9
---
## Overview
FixElementSize is a built-in interaction provided by G6, used to **maintain the size of certain elements within nodes unchanged during the zooming process.** It enhances visual consistency and operability during zooming.
By listening to viewport changes, it automatically scales elements marked as "fixed size" to ensure they maintain a relatively constant display size at different zoom levels. It supports global enablement and also allows control over specific elements or nodes as needed.
## Use Cases
This interaction is mainly used for:
- Graphical elements or embedded components (buttons, labels, etc.) that need to maintain a fixed visual size
## Online Experience
<embed src="@/common/api/behaviors/fix-element-size.md"></embed>
## Basic Usage
Add this interaction in the graph configuration
**1. Quick Configuration (Static)**
Declare directly using a string form. This method is simple but only supports default configuration and cannot be dynamically modified after configuration:
```javascript
const graph = new Graph({
// Other configurations...
behaviors: ['fix-element-size'],
});
```
**2. Object Configuration (Recommended)**
Configure using an object form, supporting custom parameters, and can dynamically update the configuration at runtime:
```javascript
const graph = new Graph({
// Other configurations...
behaviors: [
{
type: 'fix-element-size',
enable: true, // Enable this interaction
state: 'selected', // State of elements to fix size
reset: true, // Restore style when elements are redrawn
},
],
});
```
## Configuration Options
| Option | Description | Type | Default | Required |
| ----------- | -------------------------------------------------------------------------------------------------------------------------------------------------------------------------------------------------------------- | ---------------------------------------------------------------------------- | --------------------------------------------------------------------------------------------------- | -------- |
| type | Interaction type name | string | `fix-element-size` | ✓ |
| enable | Whether to enable this interaction, [example](#enable) | boolean \| ((event: [Event](/api/event#event-object-properties)) => boolean) | true | |
| reset | Whether to restore style when elements are redrawn | boolean | `false` | |
| state | Specify the state of elements to fix size | string | "" | |
| node | Node configuration item, used to define which attributes maintain a fixed visual size. If not specified (i.e., undefined), the entire node will be fixed, [example](#node) | [FixShapeConfig](#fixshapeconfig) \| FixShapeConfig[] | | |
| nodeFilter | Node filter, used to filter which nodes maintain a fixed size during zooming | (datum: [NodeData](/manual/data#nodedata)) => boolean | `() => true` | |
| edge | Edge configuration item, used to define which attributes maintain a fixed visual size. By default, the lineWidth and labelFontSize attributes are fixed, usage is the same as [node configuration item](#node) | [FixShapeConfig](#fixshapeconfig) \| FixShapeConfig[] | `[ shape: 'key', fields: ['lineWidth'] , shape: 'halo', fields: ['lineWidth'] , shape: 'label' ]` | |
| edgeFilter | Edge filter, used to filter which edges maintain a fixed size during zooming | (datum: [EdgeData](/manual/data#edgedata)) => boolean | `() => true` | |
| combo | Combo configuration item, used to define which attributes maintain a fixed visual size. By default, the entire Combo will be fixed, usage is the same as [node configuration item](#node) | [FixShapeConfig](#fixshapeconfig) \| FixShapeConfig[] | | |
| comboFilter | Combo filter, used to filter which Combos maintain a fixed size during zooming | (datum: [ComboData](/manual/data#combodata)) => boolean | `() => true` | |
### enable
Whether to enable the fixed element size interaction. By default, it is enabled when zooming out the canvas
By default, it is enabled when zooming out the canvas, set `enable: (event) => event.data.scale < 1`; if you want to enable it when zooming in, set `enable: (event) => event.data.scale > 1`; if you want to enable it when both zooming in and out, set `enable: true`
### node
Node configuration item, used to define which attributes maintain a fixed visual size. If not specified (i.e., undefined), the entire node will be fixed
**Example**
If you want to fix the lineWidth of the main shape of the node during zooming, you can configure it like this:
```ts
{
node: [{ shape: 'key', fields: ['lineWidth'] }];
}
```
If you want to keep the size of the element label unchanged during zooming, you can configure it like this:
```ts
{
shape: 'label';
}
```
### FixShapeConfig
| Parameter | Description | Type | Default | Required |
| --------- | ------------------------------------------------------------------------------------------------------------------------------------------------------------------ | ------------------------------------------------------ | ------- | -------- |
| shape | Specify the shape to fix size, it can be the class name of the shape, or a function that receives all shapes constituting the element and returns the target shape | string \| ((shapes: DisplayObject[]) => DisplayObject) | - | ✓ |
| fields | Specify the fields of the shape to fix size. If not specified, the entire shape size is fixed by default | string[] | - | ✘ |
## Practical Example
```js | ob { inject: true }
import { Graph } from '@antv/g6';
const data = {
nodes: [
{ id: 'node0', size: 50, label: '0', style: { x: 326, y: 268 }, states: ['selected'] },
{ id: 'node1', size: 30, label: '1', style: { x: 280, y: 384 }, states: ['selected'] },
{ id: 'node2', size: 30, label: '2', style: { x: 234, y: 167 } },
{ id: 'node3', size: 30, label: '3', style: { x: 391, y: 368 } },
{ id: 'node4', size: 30, label: '4', style: { x: 444, y: 209 } },
{ id: 'node5', size: 30, label: '5', style: { x: 378, y: 157 } },
{ id: 'node6', size: 15, label: '6', style: { x: 229, y: 400 } },
{ id: 'node7', size: 15, label: '7', style: { x: 281, y: 440 } },
{ id: 'node8', size: 15, label: '8', style: { x: 188, y: 119 } },
{ id: 'node9', size: 15, label: '9', style: { x: 287, y: 157 } },
{ id: 'node10', size: 15, label: '10', style: { x: 185, y: 200 } },
{ id: 'node11', size: 15, label: '11', style: { x: 238, y: 110 } },
{ id: 'node12', size: 15, label: '12', style: { x: 239, y: 221 } },
{ id: 'node13', size: 15, label: '13', style: { x: 176, y: 160 } },
{ id: 'node14', size: 15, label: '14', style: { x: 389, y: 423 } },
{ id: 'node15', size: 15, label: '15', style: { x: 441, y: 341 } },
{ id: 'node16', size: 15, label: '16', style: { x: 442, y: 398 } },
],
edges: [
{ source: 'node0', target: 'node1', label: '0-1', states: ['selected'] },
{ source: 'node0', target: 'node2', label: '0-2' },
{ source: 'node0', target: 'node3', label: '0-3' },
{ source: 'node0', target: 'node4', label: '0-4' },
{ source: 'node0', target: 'node5', label: '0-5' },
{ source: 'node1', target: 'node6', label: '1-6' },
{ source: 'node1', target: 'node7', label: '1-7' },
{ source: 'node2', target: 'node8', label: '2-8' },
{ source: 'node2', target: 'node9', label: '2-9' },
{ source: 'node2', target: 'node10', label: '2-10' },
{ source: 'node2', target: 'node11', label: '2-11' },
{ source: 'node2', target: 'node12', label: '2-12' },
{ source: 'node2', target: 'node13', label: '2-13' },
{ source: 'node3', target: 'node14', label: '3-14' },
{ source: 'node3', target: 'node15', label: '3-15' },
{ source: 'node3', target: 'node16', label: '3-16' },
],
};
const graph = new Graph({
container: 'container',
data,
node: {
style: {
labelText: (d) => d.label,
size: (d) => d.size,
lineWidth: 1,
},
},
edge: { style: { labelText: (d) => d.label } },
behaviors: [
'zoom-canvas',
'drag-canvas',
{
key: 'fix-element-size',
type: 'fix-element-size',
enable: (event) => event.data.scale < 1,
state: 'selected',
reset: true,
},
{ type: 'click-select', key: 'click-select', multiple: true },
],
autoFit: 'center',
});
graph.render();
```
Behavior Skill
packages/site/docs/manual/behavior/FixElementSize.zh.md anthropic-skill ~2,058 tokens---
title: 缩放画布时固定元素大小 FixElementSize
order: 9
---
## 概述
FixElementSize 是 G6 提供的一种内置交互,用于在视图缩放过程中,**保持节点中某些元素的尺寸不随缩放变化。** 提升缩放过程中的视觉一致性与可操作性。
通过监听视口变化,自动对标记为“固定尺寸”的元素进行缩放补偿,确保它们在不同缩放级别下保持相对恒定的显示尺寸。支持全局启用,也支持按需控制具体元素或节点的适配行为。
## 使用场景
这一交互主要用于:
- 需要固定视觉大小的图形元素或嵌入式组件(按钮、标签等)
## 在线体验
<embed src="@/common/api/behaviors/fix-element-size.md"></embed>
## 基本用法
在图配置中添加这一交互
**1. 快速配置(静态)**
使用字符串形式直接声明,这种方式简洁但仅支持默认配置,且配置后不可动态修改:
```javascript
const graph = new Graph({
// 其他配置...
behaviors: ['fix-element-size'],
});
```
**2. 对象配置(推荐)**
使用对象形式进行配置,支持自定义参数,且可以在运行时动态更新配置:
```javascript
const graph = new Graph({
// 其他配置...
behaviors: [
{
type: 'fix-element-size',
enable: true, // 开启该交互
state: 'selected', // 要固定大小的元素状态
reset: true, // 元素重绘时还原样式
},
],
});
```
## 配置项
| 配置项 | 说明 | 类型 | 默认值 | 必选 |
| ----------- | ----------------------------------------------------------------------------------------------------------------- | ----------------------------------------------------------------- | --------------------------------------------------------------------------------------------------- | ---- |
| type | 交互类型名称 | string | `fix-element-size` | √ |
| enable | 是否启用该交互,[示例](#enable) | boolean \| ((event: [Event](/api/event#事件对象属性)) => boolean) | true | |
| reset | 元素重绘时是否还原样式 | boolean | `false` | |
| state | 指定要固定大小的元素状态 | string | "" | |
| node | 节点配置项,用于定义哪些属性在视觉上保持固定大小。若未指定(即为 undefined),则整个节点将被固定,[示例](#node) | [FixShapeConfig](#fixshapeconfig) \| FixShapeConfig[] | | |
| nodeFilter | 节点过滤器,用于过滤哪些节点在缩放过程中保持固定大小 | (datum: [NodeData](/manual/data#节点数据nodedata)) => boolean | `() => true` | |
| edge | 边配置项,用于定义哪些属性在视觉上保持固定大小。默认固定 lineWidth、labelFontSize 属性,用法同[node配置项](#node) | [FixShapeConfig](#fixshapeconfig) \| FixShapeConfig[] | `[ shape: 'key', fields: ['lineWidth'] , shape: 'halo', fields: ['lineWidth'] , shape: 'label' ]` | |
| edgeFilter | 边过滤器,用于过滤哪些边在缩放过程中保持固定大小 | (datum: [EdgeData](/manual/data#边数据edgedata)) => boolean | `() => true` | |
| combo | Combo 配置项,用于定义哪些属性在视觉上保持固定大小。默认整个 Combo 将被固定,用法同[node配置项](#node) | [FixShapeConfig](#fixshapeconfig) \| FixShapeConfig[] | | |
| comboFilter | Combo 过滤器,用于过滤哪些 Combo 在缩放过程中保持固定大小 | (datum: [ComboData](/manual/data#组合数据combodata)) => boolean | `() => true` | |
### enable
是否启用固定元素大小交互。默认在缩小画布时启用
默认在缩小画布时启用,设置 `enable: (event) => event.data.scale < 1`;如果希望在放大画布时启用,设置 `enable: (event) => event.data.scale > 1`;如果希望在放大缩小画布时都启用,设置 `enable: true`
### node
节点配置项,用于定义哪些属性在视觉上保持固定大小。若未指定(即为 undefined),则整个节点将被固定
**示例**
如果在缩放过程中希望固定节点主图形的 lineWidth,可以这样配置:
```ts
{
node: [{ shape: 'key', fields: ['lineWidth'] }];
}
```
如果在缩放过程中想保持元素标签大小不变,可以这样配置:
```ts
{
shape: 'label';
}
```
### FixShapeConfig
| 参数 | 描述 | 类型 | 默认值 | 必选 |
| ------ | ---------------------------------------------------------------------------------------------------- | ------------------------------------------------------ | ------ | ---- |
| shape | 指定要固定大小的图形,可以是图形的类名字,或者是一个函数,该函数接收构成元素的所有图形并返回目标图形 | string \| ((shapes: DisplayObject[]) => DisplayObject) | - | ✓ |
| fields | 指定要固定大小的图形属性字段。如果未指定,则默认固定整个图形的大小 | string[] | - | ✘ |
## 实际案例
```js | ob { inject: true }
import { Graph } from '@antv/g6';
const data = {
nodes: [
{ id: 'node0', size: 50, label: '0', style: { x: 326, y: 268 }, states: ['selected'] },
{ id: 'node1', size: 30, label: '1', style: { x: 280, y: 384 }, states: ['selected'] },
{ id: 'node2', size: 30, label: '2', style: { x: 234, y: 167 } },
{ id: 'node3', size: 30, label: '3', style: { x: 391, y: 368 } },
{ id: 'node4', size: 30, label: '4', style: { x: 444, y: 209 } },
{ id: 'node5', size: 30, label: '5', style: { x: 378, y: 157 } },
{ id: 'node6', size: 15, label: '6', style: { x: 229, y: 400 } },
{ id: 'node7', size: 15, label: '7', style: { x: 281, y: 440 } },
{ id: 'node8', size: 15, label: '8', style: { x: 188, y: 119 } },
{ id: 'node9', size: 15, label: '9', style: { x: 287, y: 157 } },
{ id: 'node10', size: 15, label: '10', style: { x: 185, y: 200 } },
{ id: 'node11', size: 15, label: '11', style: { x: 238, y: 110 } },
{ id: 'node12', size: 15, label: '12', style: { x: 239, y: 221 } },
{ id: 'node13', size: 15, label: '13', style: { x: 176, y: 160 } },
{ id: 'node14', size: 15, label: '14', style: { x: 389, y: 423 } },
{ id: 'node15', size: 15, label: '15', style: { x: 441, y: 341 } },
{ id: 'node16', size: 15, label: '16', style: { x: 442, y: 398 } },
],
edges: [
{ source: 'node0', target: 'node1', label: '0-1', states: ['selected'] },
{ source: 'node0', target: 'node2', label: '0-2' },
{ source: 'node0', target: 'node3', label: '0-3' },
{ source: 'node0', target: 'node4', label: '0-4' },
{ source: 'node0', target: 'node5', label: '0-5' },
{ source: 'node1', target: 'node6', label: '1-6' },
{ source: 'node1', target: 'node7', label: '1-7' },
{ source: 'node2', target: 'node8', label: '2-8' },
{ source: 'node2', target: 'node9', label: '2-9' },
{ source: 'node2', target: 'node10', label: '2-10' },
{ source: 'node2', target: 'node11', label: '2-11' },
{ source: 'node2', target: 'node12', label: '2-12' },
{ source: 'node2', target: 'node13', label: '2-13' },
{ source: 'node3', target: 'node14', label: '3-14' },
{ source: 'node3', target: 'node15', label: '3-15' },
{ source: 'node3', target: 'node16', label: '3-16' },
],
};
const graph = new Graph({
container: 'container',
data,
node: {
style: {
labelText: (d) => d.label,
size: (d) => d.size,
lineWidth: 1,
},
},
edge: { style: { labelText: (d) => d.label } },
behaviors: [
'zoom-canvas',
'drag-canvas',
{
key: 'fix-element-size',
type: 'fix-element-size',
enable: (event) => event.data.scale < 1,
state: 'selected',
reset: true,
},
{ type: 'click-select', key: 'click-select', multiple: true },
],
autoFit: 'center',
});
graph.render();
```
Behavior Skill
packages/site/docs/manual/behavior/FocusElement.en.md anthropic-skill ~1,437 tokens---
title: FocusElement
order: 10
---
## Overview
FocusElement is a built-in behavior in G6 used to implement the element focusing feature, allowing elements to be focused to the center of the view by clicking on them. This behavior helps users quickly locate and focus on specific graph elements.
## Use Cases
- Quickly center the focused nodes or edges in the display
## Online Experience
<embed src="@/common/api/behaviors/focus-element.md"></embed>
## Basic Usage
Add this behavior in the graph configuration:
**1. Quick Configuration (Static)**
Declare directly using a string form:
```javascript
const graph = new Graph({
// Other configurations...
behaviors: ['focus-element'],
});
```
**2. Object Configuration (Recommended)**
Configure using an object form, supporting custom parameters:
```javascript
const graph = new Graph({
// Other configurations...
behaviors: [
{
type: 'focus-element',
animation: {
duration: 500,
easing: 'ease-in',
},
},
],
});
```
## Configuration Options
| Option | Description | Type | Default | Required |
| --------- | --------------------------------------------------------------------------------------------------------------------------------------------------------------------------------------------------------------------------------------------------------------------------------------------------------------------------------------------------------------------------- | --------------------------------------------------------------- | -------------------------------------- | -------- |
| type | Behavior type name | string | `focus-element` | ✓ |
| animation | Focus animation settings | [ViewportAnimationEffectTiming](#viewportanimationeffecttiming) | `{ duration: 500, easing: 'ease-in' }` | |
| enable | Whether to enable the focus feature | boolean \| ((event: IElementEvent) => boolean) | true | |
| trigger | Press this shortcut key in combination with mouse perform foucs element **Key reference:** _<a href="https://developer.mozilla.org/en-US/docs/Web/API/UI_Events/Keyboard_event_key_values" target="_blank" rel="noopener noreferrer">MDN Key Values</a>_. If set to an **empty array**, it means drag element can be performed with mouse without pressing other keys <br/> | string[] \| (`Control` \| `Shift`\| `Alt` \| `......`)[] | [`shift`] | |
### ViewportAnimationEffectTiming
```typescript
type ViewportAnimationEffectTiming =
| boolean // true to enable default animation, false to disable animation
| {
easing?: string; // Animation easing function: 'ease-in-out', 'ease-in', 'ease-out', 'linear'
duration?: number; // Animation duration (milliseconds)
};
```
## Code Examples
### Basic Focus Feature
```javascript
const graph = new Graph({
container: 'container',
width: 800,
height: 600,
behaviors: ['focus-element'],
});
```
### Custom Animation Effects
```javascript
const graph = new Graph({
// Other configurations...
behaviors: [
{
type: 'focus-element',
animation: {
duration: 800,
easing: 'ease-in-out',
},
},
],
});
```
### Conditional Focus Enablement
```javascript
const graph = new Graph({
// Other configurations...
behaviors: [
{
type: 'focus-element',
enable: (event) => {
// Enable focus only for nodes, not edges
return event.target.type === 'node';
},
},
],
});
```
## Practical Example
```js | ob { inject: true }
import { Graph } from '@antv/g6';
const data = {
nodes: [
{ id: 'node1', combo: 'combo1', style: { x: 110, y: 150 } },
{ id: 'node2', combo: 'combo1', style: { x: 190, y: 150 } },
{ id: 'node3', combo: 'combo2', style: { x: 150, y: 260 } },
],
edges: [{ source: 'node1', target: 'node2' }],
combos: [{ id: 'combo1', combo: 'combo2' }, { id: 'combo2' }],
};
const graph = new Graph({
container: 'container',
node: {
style: { labelText: (d) => d.id },
},
data,
behaviors: ['collapse-expand', 'focus-element'],
});
graph.render();
```
Behavior Skill
packages/site/docs/manual/behavior/FocusElement.zh.md anthropic-skill ~1,087 tokens---
title: 聚焦元素 FocusElement
order: 10
---
## 概述
FocusElement 是 G6 中用于实现元素聚焦功能的内置交互,支持通过点击元素将其聚焦到视图中心。这个交互可以帮助用户快速定位和关注特定的图元素。
## 使用场景
- 快速将关注的节点或边居中显示
## 在线体验
<embed src="@/common/api/behaviors/focus-element.md"></embed>
## 基本用法
在图配置中添加这一交互:
**1. 快速配置(静态)**
使用字符串形式直接声明:
```javascript
const graph = new Graph({
// 其他配置...
behaviors: ['focus-element'],
});
```
**2. 对象配置(推荐)**
使用对象形式进行配置,支持自定义参数:
```javascript
const graph = new Graph({
// 其他配置...
behaviors: [
{
type: 'focus-element',
animation: {
duration: 500,
easing: 'ease-in',
},
},
],
});
```
## 配置项
| 配置项 | 说明 | 类型 | 默认值 | 必选 |
| --------- | -------------------------------------------------------------------------------------------------------------------------------------------------------------------------------------------------------------------------------------------------------------- | --------------------------------------------------------------- | -------------------------------------- | ---- |
| type | 交互类型名称 | string | `focus-element` | ✓ |
| animation | 聚焦动画效果设置 | [ViewportAnimationEffectTiming](#viewportanimationeffecttiming) | `{ duration: 500, easing: 'ease-in' }` | |
| enable | 是否启用聚焦功能 | boolean \| ((event: IElementEvent) => boolean) | true | |
| trigger | 同时按下快捷键才能聚焦元素 **按键参考:** _<a href="https://developer.mozilla.org/zh-CN/docs/Web/API/UI_Events/Keyboard_event_key_values" target="_blank" rel="noopener noreferrer">MDN Key Values</a>_ 。若设为**空数组**时则表示不需要按下其他按键配合 <br/> | string[] \| (`Control` \| `Shift`\| `Alt` \| `......`)[] | [] | |
### ViewportAnimationEffectTiming
```typescript
type ViewportAnimationEffectTiming =
| boolean // true 启用默认动画,false 禁用动画
| {
easing?: string; // 动画缓动函数:'ease-in-out'、'ease-in'、'ease-out'、'linear'
duration?: number; // 动画持续时间(毫秒)
};
```
## 代码示例
### 基础聚焦功能
```javascript
const graph = new Graph({
container: 'container',
width: 800,
height: 600,
behaviors: ['focus-element'],
});
```
### 自定义动画效果
```javascript
const graph = new Graph({
// 其他配置...
behaviors: [
{
type: 'focus-element',
animation: {
duration: 800,
easing: 'ease-in-out',
},
},
],
});
```
### 条件性启用聚焦
```javascript
const graph = new Graph({
// 其他配置...
behaviors: [
{
type: 'focus-element',
enable: (event) => {
// 只对节点启用聚焦,边不聚焦
return event.target.type === 'node';
},
},
],
});
```
## 实际案例
```js | ob { inject: true }
import { Graph } from '@antv/g6';
const data = {
nodes: [
{ id: 'node1', combo: 'combo1', style: { x: 110, y: 150 } },
{ id: 'node2', combo: 'combo1', style: { x: 190, y: 150 } },
{ id: 'node3', combo: 'combo2', style: { x: 150, y: 260 } },
],
edges: [{ source: 'node1', target: 'node2' }],
combos: [{ id: 'combo1', combo: 'combo2' }, { id: 'combo2' }],
};
const graph = new Graph({
container: 'container',
node: {
style: { labelText: (d) => d.id },
},
data,
behaviors: ['collapse-expand', 'focus-element'],
});
graph.render();
```
Behavior Skill
packages/site/docs/manual/behavior/HoverActivate.en.md anthropic-skill ~1,299 tokens---
title: HoverActivate
order: 11
---
## Overview
HoverActivate is a built-in behavior in G6 used to implement the hover activation effect on elements. When the mouse hovers over nodes or edges, it automatically triggers visual feedback such as highlighting and displaying. This behavior is an important means of enhancing data exploration in graph visualization, helping users quickly focus on target elements and obtain related information.
## Use Cases
This behavior is mainly used for:
- Quickly locating elements of interest in complex relationship graphs
- Displaying additional information of nodes through hover
- Highlighting connection paths by activating edges when analyzing relationships between nodes
## Online Experience
<embed src="@/common/api/behaviors/hover-activate.md"></embed>
## Basic Usage
Add this behavior in the graph configuration:
**1. Quick Configuration (Static)**
Declare directly using a string form. This method is simple but only supports default configuration and cannot be dynamically modified after configuration:
```javascript
const graph = new Graph({
// Other configurations...
behaviors: ['hover-activate'],
});
```
**2. Object Configuration (Recommended)**
Configure using an object form, supporting custom parameters, and can dynamically update the configuration at runtime:
```javascript
const graph = new Graph({
// Other configurations...
behaviors: [
{
type: 'hover-activate',
key: 'hover-activate-1', // Specify an identifier for the behavior for dynamic updates
},
],
});
```
## Configuration Options
| Option | Description | Type | Default | Required |
| ------------- | ------------------------------------------- | ---------------------------------------------- | ---------------- | -------- |
| type | Behavior type name | string | `hover-activate` | ✓ |
| animation | Whether to enable animation | boolean | true | |
| enable | Whether to enable hover feature | boolean \| ((event: IPointerEvent) => boolean) | true | |
| degree | Degree of relationship to activate elements | number \| ((event: IPointerEvent) => number); | 0 | |
| direction | Specify edge direction | `both` \| `in` \| `out` | `both` | |
| state | State of activated elements | string | `active` | |
| inactiveState | State of inactive elements | string | - | |
| onHover | Callback when element is hovered | (event: IPointerEvent) => void | - | |
| onHoverEnd | Callback when hover ends | (event: IPointerEvent) => void | - | |
### enable
`enable` is used to control whether to enable hover highlighting of elements, and can receive a function for dynamic control
For example: Enable hover highlighting only for nodes
```typescript
const graph = new Graph({
// Other configurations...
behaviors: [
{
type: 'hover-activate',
enable: (e) => {
if (e.targetType === 'node') {
return true;
}
return false;
},
},
],
});
```
## Code Examples
### Basic Hover Usage
```typescript
const graph = new Graph({
// Other configurations...
behaviors: ['hover-activate'],
});
```
### Node Trigger Highlight
```typescript
const graph = new Graph({
// Other configurations...
behaviors: [
{
type: 'hover-activate',
enable: (e) => {
if (e.targetType === 'node') {
return true;
}
return false;
},
},
],
});
```
### Flowchart Node Hover Next Node Highlight
```typescript
const graph = new Graph({
// Other configurations...
behaviors: [
{
type: 'hover-activate',
degree: 1,
direction: 'out',
enable: (e) => {
if (e.targetType === 'node') {
return true;
}
return false;
},
},
],
});
```
## Practical Example
```js | ob { inject: true }
import { Graph } from '@antv/g6';
const format = (data) => {
const { nodes, edges } = data;
return {
nodes: nodes.map(({ id, ...node }) => ({ id, data: node })),
edges: edges.map(({ id, source, target, ...edge }) => ({ id, source, target, data: edge })),
};
};
fetch('https://gw.alipayobjects.com/os/antvdemo/assets/data/xiaomi.json')
.then((res) => res.json())
.then((data) => {
const graph = new Graph({
container: 'container',
autoFit: 'view',
data: format(data),
behaviors: ['hover-activate'],
layout: {
type: 'force',
preventOverlap: true,
nodeSize: 24,
},
animation: false,
});
graph.render();
});
```
Behavior Skill
packages/site/docs/manual/behavior/HoverActivate.zh.md anthropic-skill ~919 tokens---
title: 悬停激活 HoverActivate
order: 11
---
## 概述
HoverActivate 是 G6 中用于实现元素悬停激活效果的内置交互,当鼠标悬停在节点或边上时,会自动触发高亮、显示等视觉反馈。该交互是图可视化中增强数据探索的重要手段,有助于用户快速聚焦目标元素并获取相关信息。
## 使用场景
这一交互主要用于:
- 在复杂关系图中快速定位关注元素
- 通过悬停信息展示节点额外信息
- 分析节点间关联关系时,通过激活边凸显连接路径
## 在线体验
<embed src="@/common/api/behaviors/hover-activate.md"></embed>
## 基本用法
在图配置中添加这一交互:
**1. 快速配置(静态)**
使用字符串形式直接声明,这种方式简洁但仅支持默认配置,且配置后不可动态修改:
```javascript
const graph = new Graph({
// 其他配置...
behaviors: ['hover-activate'],
});
```
**2. 对象配置(推荐)**
使用对象形式进行配置,支持自定义参数,且可以在运行时动态更新配置:
```javascript
const graph = new Graph({
// 其他配置...
behaviors: [
{
type: 'hover-activate',
key: 'hover-activate-1', // 为交互指定标识符,方便动态更新
},
],
});
```
## 配置项
| 配置项 | 说明 | 类型 | 默认值 | 必选 |
| ------------- | -------------------- | ---------------------------------------------- | ---------------- | ---- |
| type | 交互类型名称 | string | `hover-activate` | ✓ |
| animation | 是否开启动画效果 | boolean | true | |
| enable | 是否开启悬浮元素功能 | boolean \| ((event: IPointerEvent) => boolean) | true | |
| degree | 激活元素的n度关系 | number \| ((event: IPointerEvent) => number); | 0 | |
| direction | 指定边方向 | `both` \| `in` \| `out` | `both` | |
| state | 激活元素的状态 | string | `active` | |
| inactiveState | 不激活元素的状态 | string | - | |
| onHover | 当元素被悬停时的回调 | (event: IPointerEvent) => void | - | |
| onHoverEnd | 当悬停结束时的回调 | (event: IPointerEvent) => void | - | |
### enable
`enable` 用于控制是否开启元素的悬浮高亮,可接收一个函数来动态控制
例如:只有节点开启悬浮高亮
```typescript
const graph = new Graph({
// 其他配置...
behaviors: [
{
type: 'hover-activate',
enable: (e) => {
if (e.targetType === 'node') {
return true;
}
return false;
},
},
],
});
```
## 代码示例
### 基础悬浮用法
```typescript
const graph = new Graph({
// 其他配置...
behaviors: ['hover-activate'],
});
```
### 节点触发高亮
```typescript
const graph = new Graph({
// 其他配置...
behaviors: [
{
type: 'hover-activate',
enable: (e) => {
if (e.targetType === 'node') {
return true;
}
return false;
},
},
],
});
```
### 流程图移入节点 下一步节点高亮
```typescript
const graph = new Graph({
// 其他配置...
behaviors: [
{
type: 'hover-activate',
degree: 1,
direction: 'out',
enable: (e) => {
if (e.targetType === 'node') {
return true;
}
return false;
},
},
],
});
```
## 实际案例
```js | ob { inject: true }
import { Graph } from '@antv/g6';
const format = (data) => {
const { nodes, edges } = data;
return {
nodes: nodes.map(({ id, ...node }) => ({ id, data: node })),
edges: edges.map(({ id, source, target, ...edge }) => ({ id, source, target, data: edge })),
};
};
fetch('https://gw.alipayobjects.com/os/antvdemo/assets/data/xiaomi.json')
.then((res) => res.json())
.then((data) => {
const graph = new Graph({
container: 'container',
autoFit: 'view',
data: format(data),
behaviors: ['hover-activate'],
layout: {
type: 'force',
preventOverlap: true,
nodeSize: 24,
},
animation: false,
});
graph.render();
});
```
Behavior Skill
packages/site/docs/manual/behavior/LassoSelect.en.md anthropic-skill ~3,986 tokens---
title: LassoSelect
order: 12
---
## Overview
Click and drag the mouse to draw an **irregular** box to enclose elements, and the elements within the selected range will be selected.
## Use Cases
This behavior is mainly used for:
- Quickly selecting a batch of elements, making it easier to avoid elements you don't want to select
- Quickly deselecting a batch of elements, making it easier to avoid elements you want to keep
## Online Experience
<embed src="@/common/api/behaviors/lasso-select.md"></embed>
## Basic Usage
Add this behavior in the graph configuration:
**1. Quick Configuration (Static)**
Declare directly using a string form. This method is simple but only supports default configuration and cannot be dynamically modified after configuration:
```javascript
const graph = new Graph({
// Other configurations...
behaviors: ['lasso-select'],
});
```
**2. Object Configuration (Recommended)**
Configure using an object form, supporting custom parameters, and can dynamically update the configuration at runtime:
```javascript
const graph = new Graph({
// Other configurations...
behaviors: [
{
type: 'lasso-select',
key: 'lasso-select',
immediately: true, // Elements are immediately selected when the box encloses them
trigger: ['shift', 'alt', 'control'], // Use multiple keys for selection
},
],
});
```
## Configuration Options
| Option | Description | Type | Default | Required |
| --------------------------- | ----------------------------------------------------------------------------------------------------------------------------------------------------------------------------------------------------------------------------------------- | ------------------------------------------------------------------------------------------------------------------------------ | ------------------------- | -------- |
| type | Behavior type name. This plugin is built-in, you can use it by `type: 'lasso-select'`. | `lasso-select` \| string | `lasso-select` | ✓ |
| animation | Whether to enable animation | boolean | false | |
| enable | Whether to enable lasso selection | boolean \| ((event: [Event](/api/event#event-object-properties)) => boolean) | true | |
| enableElements | Types of elements that can be selected | ( `node` \| `edge` \| `combo` )[] | [`node`, `combo`, `edge`] | |
| [immediately](#immediately) | Whether to select immediately, only effective when [selection mode](#mode) is `default` | boolean | false | |
| [mode](#mode) | Selection mode | `union` \| `intersect` \| `diff` \| `default` | `default` | |
| onSelect | Callback for selected element state | (states:Record<string,string\|string[]>) =>Record<string,string\|string[]> | | |
| state | State to switch to when selected | string \| `selected` \| `active` \| `inactive` \| `disabled` \| `highlight` | `selected` | |
| [style](#style) | Style of the box during selection | <a href="/manual/element/shape/properties" target="_blank" rel="noopener noreferrer">RectStyleProps extends BaseStyleProps</a> | [Default](#style) | |
| trigger | Press this shortcut key along with mouse click to select **Key reference:** _<a href="https://developer.mozilla.org/en-US/docs/Web/API/UI_Events/Keyboard_event_key_values" target="_blank" rel="noopener noreferrer">MDN Key Values</a>_ | string[] \| (`Control` \| `Shift`\| `Alt` \| `......`)[] | [`shift`] | |
### immediately
Whether to select immediately, only effective when selection mode is `default`
```js
const graph = new Graph({
behaviors: [
{
type: 'lasso-select',
key: 'lasso-select',
immediately: true, // Elements are immediately selected when the box encloses them
trigger: [], // No need for other keys, just click and drag the mouse to select
},
],
});
```
```js | ob { pin: false, inject: true }
import { Graph } from '@antv/g6';
const graph = new Graph({
container: 'container',
width: 400,
height: 200,
data: {
nodes: [
{ id: 'node-1', style: { x: 100, y: 50 } },
{ id: 'node-2', style: { x: 260, y: 50 } },
{ id: 'node-3', style: { x: 280, y: 100 } },
],
edges: [
{ source: 'node-1', target: 'node-2' },
{ source: 'node-1', target: 'node-3' },
{ source: 'node-2', target: 'node-3' },
],
},
node: {
style: { fill: '#7e3feb' },
},
edge: {
stroke: '#8b9baf',
},
behaviors: [
{
type: 'lasso-select',
key: 'lasso-select',
immediately: true, // Immediate selection
trigger: [],
},
],
plugins: [{ type: 'grid-line', size: 30 }],
});
graph.render();
```
### mode
Selection mode
- `union`: Keep the current state of selected elements and add the specified state.
- `intersect`: Retain the specified state if the selected elements already have it; otherwise, clear the state.
- `diff`: Toggle the specified state of the selected elements.
- `default`: Clear the current state of selected elements and add the specified state.
```js
const graph = new Graph({
behaviors: [
{
type: 'lasso-select',
key: 'lasso-select',
mode: 'default', // Selection mode, default selection mode
},
],
});
```
```js | ob { pin: false }
createGraph(
{
data: {
nodes: [
{ id: 'node-1', style: { x: 200, y: 100 } },
{ id: 'node-2', style: { x: 360, y: 100 } },
{ id: 'node-3', style: { x: 280, y: 220 } },
],
edges: [
{ source: 'node-1', target: 'node-2' },
{ source: 'node-1', target: 'node-3' },
{ source: 'node-2', target: 'node-3' },
],
},
node: {
style: { fill: '#7e3feb' },
state: {
custom: { fill: '#ffa940' },
},
},
edge: {
stroke: '#8b9baf',
state: {
custom: { stroke: '#ffa940' },
},
},
behaviors: [
{
type: 'lasso-select',
key: 'lasso-select',
trigger: [],
immediately: true,
},
],
plugins: [{ type: 'grid-line', size: 30 }],
animation: true,
},
{ width: 600, height: 300 },
(gui, graph) => {
const options = {
key: 'lasso-select',
type: 'lasso-select',
animation: false,
enable: true,
enableElements: ['node', 'edge', 'combo'],
mode: 'default',
state: 'selected',
};
const optionFolder = gui.addFolder('lassoSelect Options');
optionFolder.add(options, 'type').disable(true);
optionFolder.add(options, 'state', ['active', 'selected', 'custom']);
optionFolder.add(options, 'mode', ['union', 'intersect', 'diff', 'default']);
// .onChange((e) => {
// immediately.show(e === 'default');
// });
optionFolder.onChange(({ property, value }) => {
graph.updateBehavior({
key: 'lasso-select',
[property]: value,
});
graph.render();
});
},
);
```
### style
| Property | Description | Type | Default |
| ----------------- | ----------------------- | ---------------------------------------- | --------- |
| cursor | Mouse style | string | |
| fill | Fill color | string \| Pattern \| null | `#1677FF` |
| fillOpacity | Fill opacity | number \| string | 0.1 |
| isBillboard | Billboard mode | boolean | |
| isSizeAttenuation | Size attenuation | boolean | |
| lineCap | Line cap style | `butt` \| `round` \| `square` | |
| lineDash | Dash line config | number \| string \| (string \| number)[] | |
| lineDashOffset | Dash line offset | number | |
| lineJoin | Line join style | `miter` \| `round` \| `bevel` | |
| lineWidth | Line width | number \| string | 1 |
| opacity | Overall opacity | number \| string | |
| radius | Rectangle corner radius | number \| string \| number[] | |
| shadowBlur | Shadow blur level | number | |
| shadowColor | Shadow color | string | |
| shadowOffsetX | Shadow X offset | number | |
| shadowOffsetY | Shadow Y offset | number | |
| stroke | Stroke color | string \| Pattern \| null | `#1677FF` |
| strokeOpacity | Stroke opacity | number \| string | |
| visibility | Visibility | `visible` \| `hidden` | |
| zIndex | Rendering level | number | 2 |
**Example**:
```js
const graph = new Graph({
behaviors: [
{
type: 'lasso-select',
key: 'lasso-select',
style: {
width: 0,
height: 0,
lineWidth: 4,
lineDash: [2, 2], // Dashed outline
// RGB super colorful box
fill: 'linear-gradient(217deg, rgba(255,0,0,.8), rgba(255,0,0,0) 70.71%),linear-gradient(127deg, rgba(0,255,0,.8), rgba(0,255,0,0) 70.71%),linear-gradient(336deg, rgba(0,0,255,.8), rgba(0,0,255,0) 70.71%)',
stroke: 'pink',
fillOpacity: 0.2,
zIndex: 2,
pointerEvents: 'none',
},
},
],
});
```
```js | ob { pin: false, inject: true }
import { Graph } from '@antv/g6';
const graph = new Graph({
container: 'container',
width: 600,
height: 300,
data: {
nodes: [
{ id: 'node-1', style: { x: 200, y: 100 } },
{ id: 'node-2', style: { x: 360, y: 100 } },
{ id: 'node-3', style: { x: 280, y: 220 } },
],
edges: [
{ source: 'node-1', target: 'node-2' },
{ source: 'node-1', target: 'node-3' },
{ source: 'node-2', target: 'node-3' },
],
},
node: {
style: { fill: '#7e3feb' },
},
edge: {
stroke: '#8b9baf',
},
behaviors: [
{
type: 'lasso-select',
key: 'lasso-select',
trigger: [],
immediately: true,
style: {
width: 0,
height: 0,
lineWidth: 4,
lineDash: [2, 2], // Dashed outline
// RGB super colorful box
fill: 'linear-gradient(217deg, rgba(255,0,0,.8), rgba(255,0,0,0) 70.71%),linear-gradient(127deg, rgba(0,255,0,.8), rgba(0,255,0,0) 70.71%),linear-gradient(336deg, rgba(0,0,255,.8), rgba(0,0,255,0) 70.71%)',
stroke: 'pink',
fillOpacity: 0.2,
zIndex: 2,
pointerEvents: 'none',
},
},
],
plugins: [{ type: 'grid-line', size: 30 }],
animation: true,
});
graph.render();
```
### trigger
Press this shortcut key along with mouse click to select, if set to an **empty array**, it means mouse click to select without needing to press other keys.
Note that setting `trigger` to `['drag']` will cause the `drag-canvas` behavior to be disabled. They cannot be configured simultaneously.
### Practical Example
```js | ob { inject: true }
import { Graph } from '@antv/g6';
const graph = new Graph({
container: 'container',
data: {
nodes: [
{ id: 'node-1', style: { x: 200, y: 250 } },
{ id: 'node-2', style: { x: 250, y: 200 } },
{ id: 'node-3', style: { x: 300, y: 250 } },
{ id: 'node-4', style: { x: 250, y: 300 } },
],
edges: [
{ source: 'node-1', target: 'node-2' },
{ source: 'node-2', target: 'node-3' },
{ source: 'node-3', target: 'node-4' },
{ source: 'node-4', target: 'node-1' },
],
},
behaviors: [
{
key: 'lasso-select',
type: 'lasso-select',
enable: true,
animation: false,
mode: 'default', // union intersect diff default
state: 'selected', // 'active', 'selected', 'inactive', ...
trigger: [], // ['Shift', 'Alt', 'Control', 'Drag', 'Meta', ...]
style: {
width: 0,
height: 0,
lineWidth: 4,
lineDash: [2, 2],
fill: 'linear-gradient(217deg, rgba(255,0,0,.8), rgba(255,0,0,0) 70.71%),linear-gradient(127deg, rgba(0,255,0,.8), rgba(0,255,0,0) 70.71%),linear-gradient(336deg, rgba(0,0,255,.8), rgba(0,0,255,0) 70.71%)',
stroke: 'pink',
fillOpacity: 0.2,
zIndex: 2,
pointerEvents: 'none',
},
},
],
});
graph.render();
```
Behavior Skill
packages/site/docs/manual/behavior/LassoSelect.zh.md anthropic-skill ~3,479 tokens---
title: 套索选择 LassoSelect
order: 12
---
## 概述
鼠标点击拖出一个 **不规则的** 框框笼罩元素,精准框选范围内的元素会被选中。
## 使用场景
这一交互主要用于:
- 快速选中一批元素,并且更容易的避开不想选的元素
- 快速取消选中一批元素,并且更容易的避开想保留的元素
## 在线体验
<embed src="@/common/api/behaviors/lasso-select.md"></embed>
## 基本用法
在图配置中添加这一交互:
**1. 快速配置(静态)**
使用字符串形式直接声明,这种方式简洁但仅支持默认配置,且配置后不可动态修改:
```javascript
const graph = new Graph({
// 其他配置...
behaviors: ['lasso-select'],
});
```
**2. 对象配置(推荐)**
使用对象形式进行配置,支持自定义参数,且可以在运行时动态更新配置:
```javascript
const graph = new Graph({
// 其他配置...
behaviors: [
{
type: 'lasso-select',
key: 'lasso-select',
immediately: true, // 可以看到框框笼罩过去时,元素立即被框选了
trigger: ['shift', 'alt', 'control'], // 配合多种按键进行框选
},
],
});
```
## 配置项
| 配置项 | 说明 | 类型 | 默认值 | 必选 |
| --------------------------- | ------------------------------------------------------------------------------------------------------------------------------------------------------------------------------------------------------------- | ------------------------------------------------------------------------------------------------------------------------------ | ------------------------- | ---- |
| type | 交互类型名称。此插件已内置,你可以通过 `type: 'lasso-select'` 来使用它。 | `lasso-select` \| string | `lasso-select` | ✓ |
| animation | 是否启用动画 | boolean | false | |
| enable | 是否启用框选功能 | boolean \| ((event: [Event](/api/event#事件对象属性)) => boolean) | true | |
| enableElements | 可框选的元素类型 | ( `node` \| `edge` \| `combo` )[] | [`node`, `combo`, `edge`] | |
| [immediately](#immediately) | 是否及时框选, 仅在[框选模式 mode](#mode)为 `default` 时生效 | boolean | false | |
| [mode](#mode) | 框选的选择模式 | `union` \| `intersect` \| `diff` \| `default` | `default` | |
| onSelect | 框选元素状态回调 | (states:Record<string,string\|string[]>) =>Record<string,string\|string[]> | | |
| state | 被选中时切换到该状态 | string \| `selected` \| `active` \| `inactive` \| `disabled` \| `highlight` | `selected` | |
| [style](#style) | 框选时的 框样式 | <a href="/manual/element/shape/properties" target="_blank" rel="noopener noreferrer">RectStyleProps extends BaseStyleProps</a> | [默认值](#style) | |
| trigger | 按下该快捷键配合鼠标点击进行框选 **按键参考:** _<a href="https://developer.mozilla.org/zh-CN/docs/Web/API/UI_Events/Keyboard_event_key_values" target="_blank" rel="noopener noreferrer">MDN Key Values</a>_ | string[] \| (`Control` \| `Shift`\| `Alt` \| `......`)[] | [`shift`] | |
### immediately
是否及时框选, 仅在框选模式为 `default` 时生效
```js
const graph = new Graph({
behaviors: [
{
type: 'lasso-select',
key: 'lasso-select',
immediately: true, // 可以看到框框笼罩过去时,元素立即被框选了
trigger: [], // 不需要配合其他按键,点击鼠标拖动即可框选
},
],
});
```
```js | ob { pin: false, inject: true }
import { Graph } from '@antv/g6';
const graph = new Graph({
container: 'container',
width: 400,
height: 200,
data: {
nodes: [
{ id: 'node-1', style: { x: 100, y: 50 } },
{ id: 'node-2', style: { x: 260, y: 50 } },
{ id: 'node-3', style: { x: 280, y: 100 } },
],
edges: [
{ source: 'node-1', target: 'node-2' },
{ source: 'node-1', target: 'node-3' },
{ source: 'node-2', target: 'node-3' },
],
},
node: {
style: { fill: '#7e3feb' },
},
edge: {
stroke: '#8b9baf',
},
behaviors: [
{
type: 'lasso-select',
key: 'lasso-select',
immediately: true, // 立即框选
trigger: [],
},
],
plugins: [{ type: 'grid-line', size: 30 }],
});
graph.render();
```
### mode
框选的选择模式
- `union`:保持已选元素的当前状态,并添加指定的 state 状态。
- `intersect`:如果已选元素已有指定的 state 状态,则保留;否则清除该状态。
- `diff`:对已选元素的指定 state 状态进行取反操作。
- `default`:清除已选元素的当前状态,并添加指定的 state 状态。
```js
const graph = new Graph({
behaviors: [
{
type: 'lasso-select',
key: 'lasso-select',
mode: 'default', // 框选模式, 默认框选模式
},
],
});
```
```js | ob { pin: false }
createGraph(
{
data: {
nodes: [
{ id: 'node-1', style: { x: 200, y: 100 } },
{ id: 'node-2', style: { x: 360, y: 100 } },
{ id: 'node-3', style: { x: 280, y: 220 } },
],
edges: [
{ source: 'node-1', target: 'node-2' },
{ source: 'node-1', target: 'node-3' },
{ source: 'node-2', target: 'node-3' },
],
},
node: {
style: { fill: '#7e3feb' },
state: {
custom: { fill: '#ffa940' },
},
},
edge: {
stroke: '#8b9baf',
state: {
custom: { stroke: '#ffa940' },
},
},
behaviors: [
{
type: 'lasso-select',
key: 'lasso-select',
trigger: [],
immediately: true,
},
],
plugins: [{ type: 'grid-line', size: 30 }],
animation: true,
},
{ width: 600, height: 300 },
(gui, graph) => {
const options = {
key: 'lasso-select',
type: 'lasso-select',
animation: false,
enable: true,
enableElements: ['node', 'edge', 'combo'],
mode: 'default',
state: 'selected',
};
const optionFolder = gui.addFolder('lassoSelect Options');
optionFolder.add(options, 'type').disable(true);
optionFolder.add(options, 'state', ['active', 'selected', 'custom']);
optionFolder.add(options, 'mode', ['union', 'intersect', 'diff', 'default']);
// .onChange((e) => {
// immediately.show(e === 'default');
// });
optionFolder.onChange(({ property, value }) => {
graph.updateBehavior({
key: 'lasso-select',
[property]: value,
});
graph.render();
});
},
);
```
### style
| 属性 | 描述 | 类型 | 默认值 |
| ----------------- | ------------------ | ---------------------------------------- | --------- |
| cursor | 鼠标样式 | string | |
| fill | 填充颜色 | string \| Pattern \| null | `#1677FF` |
| fillOpacity | 填充透明度 | number \| string | 0.1 |
| isBillboard | 是否启用公告牌模式 | boolean | |
| isSizeAttenuation | 是否启用大小衰减 | boolean | |
| lineCap | 线段端点样式 | `butt` \| `round` \| `square` | |
| lineDash | 虚线配置 | number \| string \| (string \| number)[] | |
| lineDashOffset | 虚线偏移量 | number | |
| lineJoin | 线段连接处样式 | `miter` \| `round` \| `bevel` | |
| lineWidth | 线宽度 | number \| string | 1 |
| opacity | 整体透明度 | number \| string | |
| radius | 矩形圆角半径 | number \| string \| number[] | |
| shadowBlur | 阴影模糊程度 | number | |
| shadowColor | 阴影颜色 | string | |
| shadowOffsetX | 阴影 X 方向偏移 | number | |
| shadowOffsetY | 阴影 Y 方向偏移 | number | |
| stroke | 描边颜色 | string \| Pattern \| null | `#1677FF` |
| strokeOpacity | 描边透明度 | number \| string | |
| visibility | 可见性 | `visible` \| `hidden` | |
| zIndex | 渲染层级 | number | 2 |
**示例**:
```js
const graph = new Graph({
behaviors: [
{
type: 'lasso-select',
key: 'lasso-select',
style: {
width: 0,
height: 0,
lineWidth: 4,
lineDash: [2, 2], // 虚线外框
// rgb超级炫彩框框
fill: 'linear-gradient(217deg, rgba(255,0,0,.8), rgba(255,0,0,0) 70.71%),linear-gradient(127deg, rgba(0,255,0,.8), rgba(0,255,0,0) 70.71%),linear-gradient(336deg, rgba(0,0,255,.8), rgba(0,0,255,0) 70.71%)',
stroke: 'pink',
fillOpacity: 0.2,
zIndex: 2,
pointerEvents: 'none',
},
},
],
});
```
```js | ob { pin: false, inject: true }
import { Graph } from '@antv/g6';
const graph = new Graph({
container: 'container',
width: 600,
height: 300,
data: {
nodes: [
{ id: 'node-1', style: { x: 200, y: 100 } },
{ id: 'node-2', style: { x: 360, y: 100 } },
{ id: 'node-3', style: { x: 280, y: 220 } },
],
edges: [
{ source: 'node-1', target: 'node-2' },
{ source: 'node-1', target: 'node-3' },
{ source: 'node-2', target: 'node-3' },
],
},
node: {
style: { fill: '#7e3feb' },
},
edge: {
stroke: '#8b9baf',
},
behaviors: [
{
type: 'lasso-select',
key: 'lasso-select',
trigger: [],
immediately: true,
style: {
width: 0,
height: 0,
lineWidth: 4,
lineDash: [2, 2], // 虚线外框
// rgb超级炫彩框框
fill: 'linear-gradient(217deg, rgba(255,0,0,.8), rgba(255,0,0,0) 70.71%),linear-gradient(127deg, rgba(0,255,0,.8), rgba(0,255,0,0) 70.71%),linear-gradient(336deg, rgba(0,0,255,.8), rgba(0,0,255,0) 70.71%)',
stroke: 'pink',
fillOpacity: 0.2,
zIndex: 2,
pointerEvents: 'none',
},
},
],
plugins: [{ type: 'grid-line', size: 30 }],
animation: true,
});
graph.render();
```
### trigger
按下该快捷键配合鼠标点击进行框选,若设为**空数组**时则表示鼠标点击进行框选,不需要按下其他按键配合。
注意,`trigger` 设置为 `['drag']` 时会导致 `drag-canvas` 行为失效。两者不可同时配置。
### 实际案例
```js | ob { inject: true }
import { Graph } from '@antv/g6';
const graph = new Graph({
container: 'container',
data: {
nodes: [
{ id: 'node-1', style: { x: 200, y: 250 } },
{ id: 'node-2', style: { x: 250, y: 200 } },
{ id: 'node-3', style: { x: 300, y: 250 } },
{ id: 'node-4', style: { x: 250, y: 300 } },
],
edges: [
{ source: 'node-1', target: 'node-2' },
{ source: 'node-2', target: 'node-3' },
{ source: 'node-3', target: 'node-4' },
{ source: 'node-4', target: 'node-1' },
],
},
behaviors: [
{
key: 'lasso-select',
type: 'lasso-select',
enable: true,
animation: false,
mode: 'default', // union intersect diff default
state: 'selected', // 'active', 'selected', 'inactive', ...
trigger: [], // ['Shift', 'Alt', 'Control', 'Drag', 'Meta', ...]
style: {
width: 0,
height: 0,
lineWidth: 4,
lineDash: [2, 2],
fill: 'linear-gradient(217deg, rgba(255,0,0,.8), rgba(255,0,0,0) 70.71%),linear-gradient(127deg, rgba(0,255,0,.8), rgba(0,255,0,0) 70.71%),linear-gradient(336deg, rgba(0,0,255,.8), rgba(0,0,255,0) 70.71%)',
stroke: 'pink',
fillOpacity: 0.2,
zIndex: 2,
pointerEvents: 'none',
},
},
],
});
graph.render();
```
Behavior Skill
packages/site/docs/manual/behavior/OptimizeViewportTransform.en.md anthropic-skill ~1,841 tokens---
title: OptimizeViewportTransform
order: 13
---
## Overview
OptimizeViewportTransform is a built-in behavior in G6 used to enhance the performance of large-scale graph behaviors.
This behavior implements a **selective rendering strategy**, temporarily hiding non-critical visual elements during viewport transformations (such as dragging, zooming, scrolling, etc.) to significantly reduce rendering computation load, improve frame rate, and response speed. After the viewport transformation operation ends, the system automatically restores the visibility of all elements after a set delay to ensure complete visual presentation.
This behavior is implemented based on the [event system](/en/api/event) by listening to the `GraphEvent.BEFORE_TRANSFORM` and `GraphEvent.AFTER_TRANSFORM` events, precisely capturing the start and end timing of viewport transformations, and dynamically controlling element visibility. Therefore, it must be used in conjunction with viewport operation behaviors (such as `drag-canvas`, `zoom-canvas`, or `scroll-canvas`) to be effective.
## Use Cases
This behavior is mainly used for:
- Smooth behavior of large-scale graphs (thousands of nodes/edges)
- Performance-sensitive application scenarios
## Basic Usage
Add this behavior in the graph configuration:
**1. Quick Configuration (Static)**
Declare directly using a string form. This method is simple but only supports default configuration and cannot be dynamically modified after configuration:
```javascript
const graph = new Graph({
// Other configurations...
behaviors: ['optimize-viewport-transform'],
});
```
**2. Object Configuration (Recommended)**
Configure using an object form, supporting custom parameters, and can dynamically update the configuration at runtime:
```javascript
const graph = new Graph({
// Other configurations...
behaviors: [
{
type: 'optimize-viewport-transform',
key: 'optimize-viewport-transform-1', // Specify an identifier for the behavior for dynamic updates
debounce: 300, // Set a longer debounce time
},
],
});
```
## Configuration Options
| Option | Description | Type | Default | Required |
| -------- | -------------------------------------------------------------------------------------------------------------------- | -------------------------------------- | ----------------------------- | -------- |
| type | Behavior type name | string | `optimize-viewport-transform` | ✓ |
| enable | Whether to enable this behavior | boolean \| ((event: Event) => boolean) | true | |
| debounce | How long after the operation ends to restore the visibility of all elements (milliseconds) | number | 200 | |
| shapes | Specify the graphical elements that should remain visible during canvas operations, [configuration options](#shapes) | function | `(type) => type === 'node'` | |
### Shapes
`shapes` is used to specify the graphical elements that need to remain visible during canvas operations. By default, nodes are always visible, while edges and combos are temporarily hidden during canvas operations to improve performance.
```javascript
{
shapes: (type, shape) => {
// Dynamically decide whether to remain visible based on element type and graphical object
if (type === 'node') return true; // All nodes remain visible
if (type === 'edge' && shape.get('importante')) return true; // Important edges remain visible
return false; // Other graphics are hidden
};
}
```
[Example](#keep-specific-elements-visible)
## Code Examples
### Basic Optimization Functionality
```javascript
const graph = new Graph({
container: 'container',
width: 800,
height: 600,
behaviors: ['drag-canvas', 'zoom-canvas', 'optimize-viewport-transform'],
});
```
### Custom Debounce Time
```javascript
const graph = new Graph({
// Other configurations...
behaviors: [
'drag-canvas',
'zoom-canvas',
{
type: 'optimize-viewport-transform',
debounce: 500, // Set a longer debounce time, restoring visibility of all elements 0.5 seconds after the operation stops
},
],
});
```
### Keep Specific Elements Visible
```javascript
const graph = new Graph({
// Other configurations...
node: {
style: {
labelText: 'Drag Canvas!',
},
},
behaviors: [
'drag-canvas',
'zoom-canvas',
{
type: 'optimize-viewport-transform',
shapes: (type, shape) => {
if (type === 'node' && shape.className === 'key') return true;
return false;
},
},
],
});
```
> 👇 Try dragging the canvas to see the effect
```js | ob { pin: false, inject: true }
import { Graph } from '@antv/g6';
const graph = new Graph({
container: 'container',
width: 200,
height: 200,
data: {
nodes: [{ id: 'node-1', style: { x: 100, y: 100 } }],
},
node: {
style: {
labelText: 'Drag Canvas!',
},
},
behaviors: [
'drag-canvas',
{
type: 'optimize-viewport-transform',
shapes: (type, shape) => {
if (type === 'node' && shape.className === 'key') return true;
return false;
},
},
],
});
graph.render();
```
### Dynamically Enable/Disable Optimization Based on Graph Element Count
You can dynamically decide whether to enable optimization based on the number of graph elements:
```javascript
const graph = new Graph({
// Other configurations...
behaviors: [
'drag-canvas',
'zoom-canvas',
function () {
// Enable optimization when exceeding 500 elements
const enable = graph.getNodeData().length + graph.getEdgeData().length > 500;
return {
type: 'optimize-viewport-transform',
key: 'optimize-behavior',
enable,
};
},
],
});
```
## FAQ
### 1. When should this behavior be used?
When the graph contains a large number of nodes and edges (usually more than 500 elements), using this behavior can significantly improve operational smoothness. It is especially useful in environments with high performance requirements or limited hardware performance.
## Practical Example
```js | ob { inject: true }
import { Graph } from '@antv/g6';
const graph = new Graph({
container: 'container',
layout: {
type: 'grid',
},
data: {
nodes: [{ id: 'node1' }, { id: 'node2' }, { id: 'node3' }, { id: 'node4' }, { id: 'node5' }],
edges: [
{ source: 'node1', target: 'node2' },
{ source: 'node1', target: 'node3' },
{ source: 'node1', target: 'node4' },
{ source: 'node2', target: 'node3' },
{ source: 'node3', target: 'node4' },
{ source: 'node4', target: 'node5' },
],
},
node: {
style: {
labelText: (datum) => datum.id,
},
},
behaviors: ['zoom-canvas', 'drag-canvas', 'scroll-canvas', 'optimize-viewport-transform'],
});
graph.render();
```
Behavior Skill
packages/site/docs/manual/behavior/OptimizeViewportTransform.zh.md anthropic-skill ~1,219 tokens---
title: 优化视口变换 OptimizeViewportTransform
order: 13
---
## 概述
OptimizeViewportTransform 是 G6 中用于提升大规模图表交互性能的内置交互。
该交互通过实现**选择性渲染策略**,在视口变换过程中(即用户进行拖拽、缩放、滚动等操作时)临时隐藏非关键视觉元素,从而显著降低渲染计算负载,提高帧率和响应速度。当视口变换操作结束后,系统会在设定的延迟时间后自动恢复所有元素的可见性,确保完整的视觉呈现。
此交互基于 [事件系统](/api/event) 实现,通过监听 `GraphEvent.BEFORE_TRANSFORM` 和 `GraphEvent.AFTER_TRANSFORM` 事件,精确捕捉视口变换的开始和结束时机,进而执行元素可见性的动态控制。因此,必须与视口操作类交互(如 `drag-canvas`、`zoom-canvas` 或 `scroll-canvas`)配合使用才能发挥作用。
## 使用场景
这一交互主要用于:
- 大规模图表(上千节点/边)的流畅交互
- 性能敏感的应用场景
## 基本用法
在图配置中添加这一交互:
**1. 快速配置(静态)**
使用字符串形式直接声明,这种方式简洁但仅支持默认配置,且配置后不可动态修改:
```javascript
const graph = new Graph({
// 其他配置...
behaviors: ['optimize-viewport-transform'],
});
```
**2. 对象配置(推荐)**
使用对象形式进行配置,支持自定义参数,且可以在运行时动态更新配置:
```javascript
const graph = new Graph({
// 其他配置...
behaviors: [
{
type: 'optimize-viewport-transform',
key: 'optimize-viewport-transform-1', // 为交互指定标识符,方便动态更新
debounce: 300, // 设置更长的防抖时间
},
],
});
```
## 配置项
| 配置项 | 说明 | 类型 | 默认值 | 必选 |
| -------- | ------------------------------------------------------------- | -------------------------------------- | ----------------------------- | ---- |
| type | 交互类型名称 | string | `optimize-viewport-transform` | ✓ |
| enable | 是否启用该交互 | boolean \| ((event: Event) => boolean) | true | |
| debounce | 操作结束后多长时间恢复显示所有元素(毫秒) | number | 200 | |
| shapes | 指定在操作画布过程中始终保持可见的图形元素,[配置项](#shapes) | function | `(type) => type === 'node'` | |
### Shapes
`shapes` 用于指定在画布操作过程中需要保持可见的图形元素。默认情况下,节点始终可见,而边和组合在操作画布时会被临时隐藏以提升性能。
```javascript
{
shapes: (type, shape) => {
// 根据元素类型和图形对象动态决定是否保持可见
if (type === 'node') return true; // 所有节点保持可见
if (type === 'edge' && shape.get('importante')) return true; // 重要的边保持可见
return false; // 其他图形隐藏
};
}
```
[示例](#保持特定元素可见)
## 代码示例
### 基础优化功能
```javascript
const graph = new Graph({
container: 'container',
width: 800,
height: 600,
behaviors: ['drag-canvas', 'zoom-canvas', 'optimize-viewport-transform'],
});
```
### 自定义防抖时间
```javascript
const graph = new Graph({
// 其他配置...
behaviors: [
'drag-canvas',
'zoom-canvas',
{
type: 'optimize-viewport-transform',
debounce: 500, // 设置更长的防抖时间,在操作停止后0.5秒才恢复显示所有元素
},
],
});
```
### 保持特定元素可见
```javascript
const graph = new Graph({
// 其他配置...
node: {
style: {
labelText: 'Drag Canvas!',
},
},
behaviors: [
'drag-canvas',
'zoom-canvas',
{
type: 'optimize-viewport-transform',
shapes: (type, shape) => {
if (type === 'node' && shape.className === 'key') return true;
return false;
},
},
],
});
```
> 👇 试试拖拽一下画布,看看效果吧
```js | ob { pin: false, inject: true }
import { Graph } from '@antv/g6';
const graph = new Graph({
container: 'container',
width: 200,
height: 200,
data: {
nodes: [{ id: 'node-1', style: { x: 100, y: 100 } }],
},
node: {
style: {
labelText: 'Drag Canvas!',
},
},
behaviors: [
'drag-canvas',
{
type: 'optimize-viewport-transform',
shapes: (type, shape) => {
if (type === 'node' && shape.className === 'key') return true;
return false;
},
},
],
});
graph.render();
```
### 根据图表元素数量动态启用/禁用优化
可以根据图表元素数量动态决定是否启用优化:
```javascript
const graph = new Graph({
// 其他配置...
behaviors: [
'drag-canvas',
'zoom-canvas',
function () {
// 超出500个元素时启用优化
const enable = graph.getNodeData().length + graph.getEdgeData().length > 500;
return {
type: 'optimize-viewport-transform',
key: 'optimize-behavior',
enable,
};
},
],
});
```
## 常见问题
### 1. 什么情况下应该使用此交互?
当图表包含大量节点和边(通常超过500个元素)时,使用此交互可以显著提升操作流畅度。在性能要求高或硬件性能有限的环境中尤其有用。
## 实际案例
```js | ob { inject: true }
import { Graph } from '@antv/g6';
const graph = new Graph({
container: 'container',
layout: {
type: 'grid',
},
data: {
nodes: [{ id: 'node1' }, { id: 'node2' }, { id: 'node3' }, { id: 'node4' }, { id: 'node5' }],
edges: [
{ source: 'node1', target: 'node2' },
{ source: 'node1', target: 'node3' },
{ source: 'node1', target: 'node4' },
{ source: 'node2', target: 'node3' },
{ source: 'node3', target: 'node4' },
{ source: 'node4', target: 'node5' },
],
},
node: {
style: {
labelText: (datum) => datum.id,
},
},
behaviors: ['zoom-canvas', 'drag-canvas', 'scroll-canvas', 'optimize-viewport-transform'],
});
graph.render();
```
Behavior Skill
packages/site/docs/manual/behavior/overview.en.md anthropic-skill ~2,289 tokens---
title: Behavior Overview
order: 0
---
## What is Behavior
<image width="200px" src="https://mdn.alipayobjects.com/huamei_qa8qxu/afts/img/A*sa3jRqp83K4AAAAAAAAAAAAADmJ7AQ/original" />
Behavior refers to the interactive operations between users and chart elements, such as dragging the canvas, selecting nodes, zooming the view, etc. Good behavior design allows users to explore and understand graph data more intuitively. **Proper configuration of behaviors is a key step in building efficient and usable charts**.
### Changes in G6 5.0 Behavior System
G6 5.0 removed the concept of "Behavior Mode" (Mode), and directly lists the required behavior behaviors in `behaviors`, simplifying the configuration. This makes behavior configuration more intuitive and easier to get started with.
```javascript {4}
import { Graph } from '@antv/g6';
const graph = new Graph({
behaviors: ['drag-canvas', 'zoom-canvas', 'click-select'],
});
```
## Built-in Behaviors
G6 provides a variety of built-in behaviors that are **ready to use without registration**:
| Category | Behavior Name | Registration Type | Function Description |
| ------------------- | ------------------------------------------------------------------------------ | ----------------------------- | ------------------------------------------------------------ |
| Navigation | | | |
| | [Drag Canvas](/en/manual/behavior/drag-canvas) | `drag-canvas` | Drag the entire canvas view |
| | [Zoom Canvas](/en/manual/behavior/zoom-canvas) | `zoom-canvas` | Zoom the canvas view |
| | [Scroll Canvas](/en/manual/behavior/scroll-canvas) | `scroll-canvas` | Scroll the canvas using the wheel |
| | [Optimize Viewport Transform](/en/manual/behavior/optimize-viewport-transform) | `optimize-viewport-transform` | Optimize view transform performance |
| Selection | | | |
| | [Click Select](/en/manual/behavior/click-select) | `click-select` | Click to select graph elements |
| | [Brush Select](/en/manual/behavior/brush-select) | `brush-select` | Select elements by dragging a rectangular area |
| | [Lasso Select](/en/manual/behavior/lasso-select) | `lasso-select` | Freely draw an area to select elements |
| Editing | | | |
| | [Create Edge](/en/manual/behavior/create-edge) | `create-edge` | Interactively create new edges |
| | [Drag Element](/en/manual/behavior/drag-element) | `drag-element` | Drag nodes or combos |
| | [Force-directed Drag](/en/manual/behavior/drag-element-force) | `drag-element-force` | Drag nodes in force-directed layout |
| Data Exploration | | | |
| | [Collapse/Expand](/en/manual/behavior/collapse-expand) | `collapse-expand` | Expand or collapse subtree nodes |
| | [Focus Element](/en/manual/behavior/focus-element) | `focus-element` | Focus on specific elements and automatically adjust the view |
| | [Hover Activate](/en/manual/behavior/hover-activate) | `hover-activate` | Highlight elements when hovering |
| Visual Optimization | | | |
| | [Fix Element Size](/en/manual/behavior/fix-element-size) | `fix-element-size` | Fix the element size to a specified value |
| | [Auto-adapt Label](/en/manual/behavior/auto-adapt-label) | `auto-adapt-label` | Automatically adjust label position |
For detailed configuration of each behavior, refer to the [Built-in Behavior Documentation](/en/manual/behavior/drag-canvas).
:::warning{title=Behavior Compatibility}
Some behaviors may overlap in triggering mechanisms, such as `brush-select` and `drag-canvas` both using mouse dragging. In such cases, you can avoid conflicts by modifying the trigger key (e.g., hold `Shift` to drag and select).
:::
## Custom Behaviors
When built-in behaviors cannot meet the requirements, G6 provides powerful customization capabilities:
- Extend by inheriting built-in behaviors
- Create entirely new behavior behaviors
Unlike built-in behaviors, **custom behaviors need to be registered before use**. For detailed tutorials, refer to the [Custom Behavior](/en/manual/behavior/custom-behavior) documentation.
## Configuration and Usage
### Basic Configuration
The simplest way is to directly specify the required behaviors through the `behaviors` array when initializing the graph instance:
```javascript
const graph = new Graph({
// Other configurations...
behaviors: ['drag-canvas', 'zoom-canvas', 'click-select'],
});
```
### Configure Behavior Parameters
For behaviors that require custom parameters, you can configure properties using the `object` form:
```javascript
const graph = new Graph({
// Other configurations...
behaviors: [
'drag-canvas',
{
type: 'zoom-canvas',
sensitivity: 1.5, // Configure sensitivity
key: 'zoom-behavior', // Specify a key for the behavior for subsequent updates
},
],
});
```
### Dynamically Update Behaviors
G6 supports dynamically managing behavior behaviors during the runtime of the graph instance to meet complex behavior needs:
You can adjust behaviors using the [setBehaviors](/en/api/behavior#graphsetbehaviorsbehaviors) method:
```javascript
// Add new behavior
graph.setBehaviors((behaviors) => [...behaviors, 'lasso-select']);
// Remove behavior
graph.setBehaviors((behaviors) => behaviors.filter((b) => b !== 'click-select'));
```
You can update the configuration of behaviors using the [updateBehavior](/en/api/behavior#graphupdatebehaviorbehavior) method:
```javascript
// Update a single behavior
graph.updateBehavior({
key: 'zoom-behavior',
sensitivity: 2,
enable: false, // Disable the behavior
});
```
:::warning{title=Note}
When using the `updateBehavior` method, you need to specify a unique `key` for the behavior during initialization.
:::
### Uninstall Behaviors
You can also uninstall behaviors using the [setBehaviors](/en/api/behavior#graphsetbehaviorsbehaviors) method by setting the behavior configuration list to empty:
```javascript
graph.setBehaviors([]);
```
For more behavior-related APIs, refer to the [Behavior API Documentation](/en/api/behavior).
## Behavior and Events
Behaviors are essentially implemented through event listening and response. Although built-in behaviors have encapsulated common behavior behaviors, you can also directly implement custom behavior logic through the event API.
### Event Listening Example
```javascript
// Use event constants (recommended)
import { NodeEvent, EdgeEvent } from '@antv/g6';
// Listen for node clicks
graph.on(NodeEvent.CLICK, (evt) => {
const { target } = evt;
graph.setElementState(target.id, 'selected');
});
// Listen for edge hover
graph.on(EdgeEvent.POINTER_OVER, (evt) => {
const { target } = evt;
graph.setElementState(target.id, 'highlight');
});
```
The event system is the foundation for implementing behaviors. Mastering the event API is crucial for understanding and extending behavior behaviors. For more event-related information, refer to the [Event Documentation](/en/api/event).
Behavior Skill
packages/site/docs/manual/behavior/overview.zh.md anthropic-skill ~1,349 tokens---
title: 交互总览
order: 0
---
## 什么是交互
<image width="200px" src="https://mdn.alipayobjects.com/huamei_qa8qxu/afts/img/A*sa3jRqp83K4AAAAAAAAAAAAADmJ7AQ/original" />
交互(Behavior)是指用户与图表元素之间的互动操作,如拖拽画布、选择节点、缩放视图等。良好的交互设计能让用户更直观地探索和理解图数据。**合理配置交互是构建高效可用图表的关键环节**。
### G6 5.0 交互系统变化
G6 5.0 移除了 "交互模式"(Mode) 概念,直接在 `behaviors` 中列出需要的交互行为,简化了配置方式。这使得交互配置更加直观,上手更加简单。
```javascript {4}
import { Graph } from '@antv/g6';
const graph = new Graph({
behaviors: ['drag-canvas', 'zoom-canvas', 'click-select'],
});
```
## 内置交互
G6 提供了多种开箱即用的内置交互,**无需注册,直接配置即可使用**:
| 分类 | 交互名称 | 注册类型 | 功能描述 |
| -------- | ------------------------------------------------------------ | ----------------------------- | -------------------------- |
| 导航 | | | |
| | [拖拽画布](/manual/behavior/drag-canvas) | `drag-canvas` | 拖动整个画布视图 |
| | [缩放画布](/manual/behavior/zoom-canvas) | `zoom-canvas` | 缩放画布视图 |
| | [滚动画布](/manual/behavior/scroll-canvas) | `scroll-canvas` | 使用滚轮滚动画布 |
| | [优化视口变换](/manual/behavior/optimize-viewport-transform) | `optimize-viewport-transform` | 优化视图变换性能 |
| 选择 | | | |
| | [点击选择](/manual/behavior/click-select) | `click-select` | 点击选择图元素 |
| | [框选](/manual/behavior/brush-select) | `brush-select` | 通过拖拽矩形区域选择元素 |
| | [套索选择](/manual/behavior/lasso-select) | `lasso-select` | 自由绘制区域选择元素 |
| 编辑 | | | |
| | [创建边](/manual/behavior/create-edge) | `create-edge` | 交互式创建新的边 |
| | [拖拽元素](/manual/behavior/drag-element) | `drag-element` | 拖动节点或组合 |
| | [力导向拖拽](/manual/behavior/drag-element-force) | `drag-element-force` | 力导向布局中拖动节点 |
| 数据探索 | | | |
| | [折叠/展开](/manual/behavior/collapse-expand) | `collapse-expand` | 展开或收起子树节点 |
| | [聚焦元素](/manual/behavior/focus-element) | `focus-element` | 聚焦特定元素,自动调整视图 |
| | [悬停激活](/manual/behavior/hover-activate) | `hover-activate` | 鼠标悬停时高亮元素 |
| 视觉优化 | | | |
| | [固定元素大小](/manual/behavior/fix-element-size) | `fix-element-size` | 将元素大小固定为指定值 |
| | [自适应标签](/manual/behavior/auto-adapt-label) | `auto-adapt-label` | 自动调整标签位置 |
各交互的详细配置可参考 [内置交互文档](/manual/behavior/drag-canvas)。
:::warning{title=交互兼容性}
某些交互在触发机制上可能存在重叠,如 `brush-select` 和 `drag-canvas` 都使用鼠标拖拽。这种情况下可以通过修改触发按键(如按住 `Shift` 拖拽选择)来避免冲突。
:::
## 自定义交互
当内置交互无法满足需求时,G6 提供了强大的自定义能力:
- 继承内置交互进行扩展
- 创建全新的交互行为
与内置交互不同,**自定义交互需要先注册后使用**。详细教程请参考 [自定义交互](/manual/behavior/custom-behavior) 文档。
## 配置和使用
### 基本配置
最简单的方式是在图实例初始化时,通过 `behaviors` 数组直接指定需要的交互:
```javascript
const graph = new Graph({
// 其他配置...
behaviors: ['drag-canvas', 'zoom-canvas', 'click-select'],
});
```
### 配置交互参数
对于需要自定义参数的交互,可以使用 `object` 的形式配置属性:
```javascript
const graph = new Graph({
// 其他配置...
behaviors: [
'drag-canvas',
{
type: 'zoom-canvas',
sensitivity: 1.5, // 配置灵敏度
key: 'zoom-behavior', // 为交互指定key,便于后续更新
},
],
});
```
### 动态更新交互
G6 支持在图实例运行期间动态管理交互行为,满足复杂交互需求:
可以通过 [setBehaviors](/api/behavior#graphsetbehaviorsbehaviors) 方法调整交互:
```javascript
// 添加新交互
graph.setBehaviors((behaviors) => [...behaviors, 'lasso-select']);
// 移除交互
graph.setBehaviors((behaviors) => behaviors.filter((b) => b !== 'click-select'));
```
可以使用 [updateBehavior](/api/behavior#graphupdatebehaviorbehavior) 方法更新交互的配置:
```javascript
// 更新单个交互
graph.updateBehavior({
key: 'zoom-behavior',
sensitivity: 2,
enable: false, // 禁用该交互
});
```
:::warning{title=注意}
使用`updateBehavior`方法时,需要在初始化时为交互指定唯一的`key`。
:::
### 卸载交互
使用 [setBehaviors](/api/behavior#graphsetbehaviorsbehaviors) 方法同样可以卸载交互,将交互配置列表置为空即可:
```javascript
graph.setBehaviors([]);
```
更多与交互相关的 API 请参考 [交互 API 文档](/api/behavior)。
## 交互与事件
交互本质上是通过事件监听和响应来实现的。虽然内置交互已经封装了常见的交互行为,但你也可以通过事件 API 直接实现自定义交互逻辑。
### 事件监听示例
```javascript
// 使用事件常量(推荐)
import { NodeEvent, EdgeEvent } from '@antv/g6';
// 监听节点点击
graph.on(NodeEvent.CLICK, (evt) => {
const { target } = evt;
graph.setElementState(target.id, 'selected');
});
// 监听边悬停
graph.on(EdgeEvent.POINTER_OVER, (evt) => {
const { target } = evt;
graph.setElementState(target.id, 'highlight');
});
```
事件系统是实现交互的基础,掌握事件 API 对于理解和扩展交互行为至关重要。更多事件相关信息,请参考 [事件文档](/api/event)。
Behavior Skill
packages/site/docs/manual/behavior/ScrollCanvas.en.md anthropic-skill ~2,208 tokens---
title: ScrollCanvas
order: 14
---
## Overview
ScrollCanvas is a built-in behavior in G6 used to implement the canvas scrolling feature, supporting panning the canvas using the mouse wheel or keyboard arrow keys. This interaction is particularly useful for browsing larger charts, allowing users to explore different areas of the chart without changing the zoom level.
## Use Cases
This behavior is mainly used for:
- Browsing large chart content that exceeds the visible area
- Exploring different parts of the graph while maintaining the current zoom level
- Precisely adjusting the view position, especially when precise scrolling is needed in one-dimensional directions
## Online Experience
<embed src="@/common/api/behaviors/scroll-canvas.md"></embed>
## Basic Usage
Add this behavior in the graph configuration:
**1. Quick Configuration (Static)**
Declare directly using a string form. This method is simple but only supports default configuration and cannot be dynamically modified after configuration:
```javascript
const graph = new Graph({
// Other configurations...
behaviors: ['scroll-canvas'],
});
```
**2. Object Configuration (Recommended)**
Configure using an object form, supporting custom parameters, and can dynamically update the configuration at runtime:
```javascript
const graph = new Graph({
// Other configurations...
behaviors: [
{
type: 'scroll-canvas',
key: 'scroll-canvas-1', // Specify an identifier for the behavior for dynamic updates
sensitivity: 1.5, // Set sensitivity
direction: 'y', // Allow only vertical scrolling
},
],
});
```
## Configuration Options
| Option | Description | Type | Default | Required |
| -------------- | ----------------------------------------------------------------------------------- | --------------------------------------------------------------------------------------------------------------------------------------------------------------------------------------------- | -------------------------------- | -------- |
| type | Behavior type name | string | `scroll-canvas` | ✓ |
| enable | Whether to enable this behavior | boolean \| ((event: [WheelEvent](https://developer.mozilla.org/en-US/docs/Web/API/WheelEvent) \| [KeyboardEvent](https://developer.mozilla.org/en-US/docs/Web/API/KeyboardEvent)) => boolean) | true | |
| direction | Allowed scrolling direction, [configuration options](#direction) | `'x'` \| `'y'` \| `undefined` | `undefined` (no direction limit) | |
| range | Scrollable viewport range (in viewport size units), [configuration options](#range) | number \| number[] | 1 | |
| sensitivity | Scrolling sensitivity, the larger the value, the faster the scrolling | number | 1 | |
| trigger | Keyboard shortcuts to trigger scrolling, [configuration options](#trigger) | object | - | |
| onFinish | Callback function when scrolling is finished | () => void | - | |
| preventDefault | Whether to prevent the browser's default event | boolean | true | |
### Direction
`direction` is used to limit the scrolling direction:
- Not set or set to `undefined`: Allow scrolling in any direction
- Set to `'x'`: Allow only horizontal scrolling
- Set to `'y'`: Allow only vertical scrolling
This is useful in specific visualization scenarios, such as in timeline charts where only horizontal scrolling may be needed.
### Range
`range` is used to control the scrollable range of the canvas:
- Set to a single number: Use the same value for all four directions
- Set to an array: Specify the range for [top, right, bottom, left] directions respectively
For example:
```javascript
range: 2; // Can scroll 2 viewport distances in any direction
range: [1, 2, 1, 2]; // Can scroll 1 viewport up and down, 2 viewports left and right
```
The value range for each direction is [0, Infinity], where 0 means no scrolling, and Infinity means unlimited scrolling.
### Trigger
`trigger` allows you to configure keyboard arrow keys to control canvas scrolling:
```javascript
{
trigger: {
up: ['ArrowUp'], // Shortcut key for scrolling up
down: ['ArrowDown'], // Shortcut key for scrolling down
left: ['ArrowLeft'], // Shortcut key for scrolling left
right: ['ArrowRight'] // Shortcut key for scrolling right
}
}
```
You can also configure combination keys:
```javascript
{
trigger: {
up: ['Control', 'ArrowUp'], // Ctrl + Up Arrow
down: ['Control', 'ArrowDown'], // Ctrl + Down Arrow
left: ['Control', 'ArrowLeft'], // Ctrl + Left Arrow
right: ['Control', 'ArrowRight'] // Ctrl + Right Arrow
}
}
```
## Code Examples
### Basic Scrolling Functionality
```javascript
const graph = new Graph({
container: 'container',
width: 800,
height: 600,
behaviors: ['scroll-canvas'],
});
```
### Allow Only Horizontal Scrolling
```javascript
const graph = new Graph({
// Other configurations...
behaviors: [
{
type: 'scroll-canvas',
direction: 'x', // Allow only horizontal scrolling
},
],
});
```
### Custom Scrolling Sensitivity and Range
```javascript
const graph = new Graph({
// Other configurations...
behaviors: [
{
type: 'scroll-canvas',
sensitivity: 1.8, // Increase scrolling sensitivity
range: [0.5, 2, 0.5, 2], // Smaller limits up and down, larger limits left and right
},
],
});
```
### Control Scrolling with Keyboard Arrow Keys
```javascript
const graph = new Graph({
// Other configurations...
behaviors: [
{
type: 'scroll-canvas',
trigger: {
up: ['ArrowUp'],
down: ['ArrowDown'],
left: ['ArrowLeft'],
right: ['ArrowRight'],
},
},
],
});
```
## FAQ
### 1. What is the difference between ScrollCanvas and ZoomCanvas?
- `ScrollCanvas` is used to pan the canvas without changing the zoom level
- `ZoomCanvas` is used to zoom the canvas, changing the view's zoom level
They are often used together to provide complete canvas navigation functionality:
```javascript
const graph = new Graph({
// Other configurations...
behaviors: ['drag-canvas', 'zoom-canvas', 'scroll-canvas'],
});
```
### Practical Example
```js | ob { inject: true }
import { Graph } from '@antv/g6';
const graph = new Graph({
container: 'container',
layout: {
type: 'grid',
},
data: {
nodes: [{ id: 'node1' }, { id: 'node2' }, { id: 'node3' }, { id: 'node4' }, { id: 'node5' }],
edges: [
{ source: 'node1', target: 'node2' },
{ source: 'node1', target: 'node3' },
{ source: 'node1', target: 'node4' },
{ source: 'node2', target: 'node3' },
{ source: 'node3', target: 'node4' },
{ source: 'node4', target: 'node5' },
],
},
behaviors: ['scroll-canvas'],
});
graph.render();
```
Behavior Skill
packages/site/docs/manual/behavior/ScrollCanvas.zh.md anthropic-skill ~1,568 tokens---
title: 滚动画布 ScrollCanvas
order: 14
---
## 概述
ScrollCanvas 是 G6 中用于实现画布滚动功能的内置交互,支持通过鼠标滚轮或键盘方向键平移画布。这种交互方式对于浏览较大的图表特别有用,能让用户在不改变缩放比例的情况下探索图表的不同区域。
## 使用场景
这一交互主要用于:
- 浏览超出可视区域的大型图表内容
- 在保持当前缩放比例的情况下探索图的不同部分
- 精确调整查看位置,尤其是在一维方向上需要精确滚动时
## 在线体验
<embed src="@/common/api/behaviors/scroll-canvas.md"></embed>
## 基本用法
在图配置中添加这一交互:
**1. 快速配置(静态)**
使用字符串形式直接声明,这种方式简洁但仅支持默认配置,且配置后不可动态修改:
```javascript
const graph = new Graph({
// 其他配置...
behaviors: ['scroll-canvas'],
});
```
**2. 对象配置(推荐)**
使用对象形式进行配置,支持自定义参数,且可以在运行时动态更新配置:
```javascript
const graph = new Graph({
// 其他配置...
behaviors: [
{
type: 'scroll-canvas',
key: 'scroll-canvas-1', // 为交互指定标识符,方便动态更新
sensitivity: 1.5, // 设置灵敏度
direction: 'y', // 只允许垂直方向滚动
},
],
});
```
## 配置项
| 配置项 | 说明 | 类型 | 默认值 | 必选 |
| -------------- | ---------------------------------------------------- | --------------------------------------------------------------------------------------------------------------------------------------------------------------------------------------------- | ------------------------ | ---- |
| type | 交互类型名称 | string | `scroll-canvas` | ✓ |
| enable | 是否启用该交互 | boolean \| ((event: [WheelEvent](https://developer.mozilla.org/en-US/docs/Web/API/WheelEvent) \| [KeyboardEvent](https://developer.mozilla.org/en-US/docs/Web/API/KeyboardEvent)) => boolean) | true | |
| direction | 允许的滚动方向,[配置项](#direction) | `'x'` \| `'y'` \| `undefined` | `undefined` (不限制方向) | |
| range | 可滚动的视口范围(以视口大小为单位),[配置项](#range) | number \| number[] | 1 | |
| sensitivity | 滚动灵敏度,值越大滚动速度越快 | number | 1 | |
| trigger | 触发滚动的键盘快捷键,[配置项](#trigger) | object | - | |
| onFinish | 滚动完成时的回调函数 | () => void | - | |
| preventDefault | 是否阻止浏览器默认事件 | boolean | true | |
### Direction
`direction` 用于限制滚动的方向:
- 不设置或设为 `undefined`:允许在任意方向滚动
- 设为 `'x'`:只允许水平方向滚动
- 设为 `'y'`:只允许垂直方向滚动
这在特定的可视化场景下很有用,例如在时间轴图表中可能只需要水平滚动。
### Range
`range` 用于控制画布可滚动的范围:
- 设置为单个数字:四个方向使用相同的值
- 设置为数组:分别指定 [上, 右, 下, 左] 四个方向的范围
例如:
```javascript
range: 2; // 在任何方向上都可以滚动2个视口的距离
range: [1, 2, 1, 2]; // 上下方向可滚动1个视口,左右方向可滚动2个视口
```
每个方向的取值范围是 [0, Infinity],0表示不能滚动,Infinity表示无限滚动。
### Trigger
`trigger` 允许你配置键盘方向键来控制画布滚动:
```javascript
{
trigger: {
up: ['ArrowUp'], // 向上滚动的快捷键
down: ['ArrowDown'], // 向下滚动的快捷键
left: ['ArrowLeft'], // 向左滚动的快捷键
right: ['ArrowRight'] // 向右滚动的快捷键
}
}
```
你也可以配置组合键:
```javascript
{
trigger: {
up: ['Control', 'ArrowUp'], // Ctrl + 上箭头
down: ['Control', 'ArrowDown'], // Ctrl + 下箭头
left: ['Control', 'ArrowLeft'], // Ctrl + 左箭头
right: ['Control', 'ArrowRight'] // Ctrl + 右箭头
}
}
```
## 代码示例
### 基础滚动功能
```javascript
const graph = new Graph({
container: 'container',
width: 800,
height: 600,
behaviors: ['scroll-canvas'],
});
```
### 只允许水平滚动
```javascript
const graph = new Graph({
// 其他配置...
behaviors: [
{
type: 'scroll-canvas',
direction: 'x', // 只允许水平滚动
},
],
});
```
### 自定义滚动灵敏度和范围
```javascript
const graph = new Graph({
// 其他配置...
behaviors: [
{
type: 'scroll-canvas',
sensitivity: 1.8, // 提高滚动灵敏度
range: [0.5, 2, 0.5, 2], // 上下方向限制较小,左右方向限制较大
},
],
});
```
### 使用键盘方向键控制滚动
```javascript
const graph = new Graph({
// 其他配置...
behaviors: [
{
type: 'scroll-canvas',
trigger: {
up: ['ArrowUp'],
down: ['ArrowDown'],
left: ['ArrowLeft'],
right: ['ArrowRight'],
},
},
],
});
```
## 常见问题
### 1. ScrollCanvas 和 ZoomCanvas 有什么区别?
- `ScrollCanvas` 用于平移画布,不改变缩放比例
- `ZoomCanvas` 用于缩放画布,改变视图的缩放比例
两者常结合使用,提供完整的画布导航功能:
```javascript
const graph = new Graph({
// 其他配置...
behaviors: ['drag-canvas', 'zoom-canvas', 'scroll-canvas'],
});
```
### 实际案例
```js | ob { inject: true }
import { Graph } from '@antv/g6';
const graph = new Graph({
container: 'container',
layout: {
type: 'grid',
},
data: {
nodes: [{ id: 'node1' }, { id: 'node2' }, { id: 'node3' }, { id: 'node4' }, { id: 'node5' }],
edges: [
{ source: 'node1', target: 'node2' },
{ source: 'node1', target: 'node3' },
{ source: 'node1', target: 'node4' },
{ source: 'node2', target: 'node3' },
{ source: 'node3', target: 'node4' },
{ source: 'node4', target: 'node5' },
],
},
behaviors: ['scroll-canvas'],
});
graph.render();
```
Behavior Skill
packages/site/docs/manual/behavior/ZoomCanvas.en.md anthropic-skill ~2,265 tokens---
title: ZoomCanvas
ordeR: 15
---
## Overview
ZoomCanvas is a built-in behavior in G6 used to implement the canvas zooming feature, supporting zooming in and out of the canvas using the mouse wheel or keyboard shortcuts. This is one of the most commonly used interactions in graph visualization, helping users view both the overall structure and local details of the graph.
## Use Cases
This behavior is mainly used for:
- Browsing large-scale graph data, freely switching between the whole and details
- Focusing on specific areas for detailed analysis
## Online Experience
<embed src="@/common/api/behaviors/zoom-canvas.md"></embed>
## Basic Usage
Add this behavior in the graph configuration:
**1. Quick Configuration (Static)**
Declare directly using a string form. This method is simple but only supports default configuration and cannot be dynamically modified after configuration:
```javascript
const graph = new Graph({
// Other configurations...
behaviors: ['zoom-canvas'],
});
```
**2. Object Configuration (Recommended)**
Configure using an object form, supporting custom parameters, and can dynamically update the configuration at runtime:
```javascript
const graph = new Graph({
// Other configurations...
behaviors: [
{
type: 'zoom-canvas',
key: 'zoom-canvas-1', // Specify an identifier for the behavior for dynamic updates
sensitivity: 1.5, // Set sensitivity
},
],
});
```
## Configuration Options
| Option | Description | Type | Default | Required |
| -------------- | ------------------------------------------------------------------------------------------------------ | ----------------------------------------------------------------------------------- | ------------------- | -------- |
| type | Behavior type name | string | `zoom-canvas` | ✓ |
| animation | Zoom animation effect settings | [ViewportAnimationEffectTiming](/manual/graph/option#viewportanimationeffecttiming) | `{ duration: 200 }` | |
| enable | Whether to enable this behavior | boolean \| ((event: Event) => boolean) | true | |
| origin | Zoom center point (viewport coordinates) | [Point](/api/viewport#point) | - | |
| onFinish | Callback function when zooming is finished | () => void | - | |
| preventDefault | Whether to prevent the browser's default event | boolean | true | |
| sensitivity | Zoom sensitivity, the larger the value, the faster the zoom | number | 1 | |
| trigger | How to trigger zooming, supports mouse wheel and keyboard shortcuts, [configuration options](#trigger) | string[] \| object | - | |
### Trigger
`trigger` has two usage methods, suitable for different scenarios:
#### Method 1: Modifier keys combined with the mouse wheel
If you want to trigger zooming only when certain keys are pressed while scrolling the mouse wheel, you can configure it like this:
```javascript
{
trigger: ['Control']; // Hold down the Control key and scroll the mouse wheel to zoom
}
```
Common modifier keys include:
- `Control`
- `Shift`
- `Alt`
> Not sure what value corresponds to a keyboard key? Refer to [MDN Key Values](https://developer.mozilla.org/en-US/docs/Web/API/UI_Events/Keyboard_event_key_values).
#### Method 2: Pure keyboard shortcuts
If you want to control zooming entirely using the keyboard, you can set up key combinations:
```javascript
{
trigger: {
zoomIn: ['Control', '+'], // Zoom in shortcut
zoomOut: ['Control', '-'], // Zoom out shortcut
reset: ['Control', '0'] // Reset zoom ratio shortcut
}
}
```
## Code Examples
### Basic Zoom Functionality
```javascript
const graph = new Graph({
container: 'container',
width: 800,
height: 600,
behaviors: ['zoom-canvas'],
});
```
### Custom Zoom Center
```javascript
const graph = new Graph({
// Other configurations...
behaviors: [
function () {
return {
type: 'zoom-canvas',
origin: this.getCanvasCenter(), // Zoom with the viewport center as the origin
};
},
],
});
```
### Custom Zoom Sensitivity
```javascript
const graph = new Graph({
// Other configurations...
behaviors: [
{
type: 'zoom-canvas',
sensitivity: 0.8, // Lower sensitivity for smoother zoom changes
},
],
});
```
### Zoom with Shift + Mouse Wheel
```javascript
const graph = new Graph({
// Other configurations...
behaviors: [
{
type: 'zoom-canvas',
trigger: ['Shift'], // Hold down the Shift key and scroll to zoom
},
],
});
```
### Control Zoom with Keyboard Shortcuts
```javascript
const graph = new Graph({
// Other configurations...
behaviors: [
{
type: 'zoom-canvas',
trigger: {
zoomIn: ['Control', '='], // Ctrl + = to zoom in
zoomOut: ['Control', '-'], // Ctrl + - to zoom out
reset: ['Control', '0'], // Ctrl + 0 to reset
},
},
],
});
```
### Supports pinch-to-zoom on mobile devices
```javascript
const graph = new Graph({
// 其他配置...
behaviors: [
{
type: 'zoom-canvas',
// Other configurations for the PC side...
},
function () {
return {
type: 'zoom-canvas',
trigger: ['pinch'],
sensitivity: 0.8, // Lower sensitivity for smoother zoom changes
origin: this.getCanvasCenter(), // Zoom with the viewport center as the origin
};
},
],
});
```
## FAQ
### 1. What if the canvas zoom exceeds the expected range?
To avoid excessive zooming in or out, you can set zoom limits:
```javascript
const graph = new Graph({
// Other configurations...
zoomRange: [0.5, 3], // Allow zooming out to 50% and zooming in to 300%
behaviors: ['zoom-canvas'],
});
```
### 2. How to use it with other interactions?
Zooming and dragging are common combinations for a complete navigation experience:
```javascript
const graph = new Graph({
// Other configurations...
behaviors: ['drag-canvas', 'zoom-canvas'],
});
```
### 3. Conflicts when using two-finger touchpad input and scroll-canvas simultaneously
On a touchpad, both two-finger swipe (for scrolling) and pinch (for zooming) gestures are often interpreted as `wheel` events.
Because both `zoom-canvas` and `scroll-canvas` respond to `wheel` events by default, using them together can cause conflicts, such as a single gesture triggering both scrolling and zooming.
You can resolve this by checking the `event.ctrlKey` property. On most platforms, a pinch gesture sets `event.ctrlKey` to `true`, while a swipe does not. This allows you to conditionally enable `zoom-canvas` only for pinch gestures.
```js | ob { inject: true }
import { Graph } from '@antv/g6';
const graph = new Graph({
container: 'container',
layout: {
type: 'grid',
},
data: {
nodes: [{ id: 'node1' }, { id: 'node2' }, { id: 'node3' }],
},
behaviors: [
'scroll-canvas',
{
key: 'custom-zoom-canvas',
type: 'zoom-canvas',
enable: (event) => {
return event.ctrlKey; // When ctrlKey is true, it performs a two-finger pinch or spread operation; when false, it performs a two-finger swipe operation.
},
},
],
});
graph.render();
```
## Practical Example
```js | ob { inject: true }
import { Graph } from '@antv/g6';
const graph = new Graph({
container: 'container',
layout: {
type: 'grid',
},
data: {
nodes: [{ id: 'node1' }, { id: 'node2' }, { id: 'node3' }, { id: 'node4' }, { id: 'node5' }],
edges: [
{ source: 'node1', target: 'node2' },
{ source: 'node1', target: 'node3' },
{ source: 'node1', target: 'node4' },
{ source: 'node2', target: 'node3' },
{ source: 'node3', target: 'node4' },
{ source: 'node4', target: 'node5' },
],
},
behaviors: ['zoom-canvas'],
});
graph.render();
```
Behavior Skill
packages/site/docs/manual/behavior/ZoomCanvas.zh.md anthropic-skill ~1,559 tokens---
title: 缩放画布 ZoomCanvas
ordeR: 15
---
## 概述
ZoomCanvas 是 G6 中用于实现画布缩放功能的内置交互,支持通过鼠标滚轮或键盘快捷键调整画布缩放比例。这是图可视化中最常用的交互之一,能帮助用户查看图的整体结构和局部细节。
## 使用场景
这一交互主要用于:
- 浏览大规模图数据,在整体与细节之间自由切换
- 聚焦到特定区域进行详细分析
## 在线体验
<embed src="@/common/api/behaviors/zoom-canvas.md"></embed>
## 基本用法
在图配置中添加这一交互:
**1. 快速配置(静态)**
使用字符串形式直接声明,这种方式简洁但仅支持默认配置,且配置后不可动态修改:
```javascript
const graph = new Graph({
// 其他配置...
behaviors: ['zoom-canvas'],
});
```
**2. 对象配置(推荐)**
使用对象形式进行配置,支持自定义参数,且可以在运行时动态更新配置:
```javascript
const graph = new Graph({
// 其他配置...
behaviors: [
{
type: 'zoom-canvas',
key: 'zoom-canvas-1', // 为交互指定标识符,方便动态更新
sensitivity: 1.5, // 设置灵敏度
},
],
});
```
## 配置项
| 配置项 | 说明 | 类型 | 默认值 | 必选 |
| -------------- | -------------------------------------------------------- | ----------------------------------------------------------------------------------- | ------------------- | ---- |
| type | 交互类型名称 | string | `zoom-canvas` | ✓ |
| animation | 缩放动画效果设置 | [ViewportAnimationEffectTiming](/manual/graph/option#viewportanimationeffecttiming) | `{ duration: 200 }` | |
| enable | 是否启用该交互 | boolean \| ((event: Event) => boolean) | true | |
| origin | 缩放中心点(视口坐标) | [Point](/api/viewport#point) | - | |
| onFinish | 缩放完成时的回调函数 | () => void | - | |
| preventDefault | 是否阻止浏览器默认事件 | boolean | true | |
| sensitivity | 缩放灵敏度,值越大缩放速度越快 | number | 1 | |
| trigger | 触发缩放的方式,支持滚轮和键盘快捷键,[配置项](#trigger) | string[] \| object | - | |
### Trigger
`trigger`有两种使用方式,分别适用于不同场景:
#### 方式一:与滚轮结合的修饰键
当你希望只有在按下某些键的同时滚动滚轮才触发缩放时,可以这样配置:
```javascript
{
trigger: ['Control']; // 按住 Control 键同时滚动鼠标滚轮才能缩放
}
```
常见的修饰键有:
- `Control`
- `Shift`
- `Alt`
> 不知道键盘按键对应什么值?请参考 [MDN Key Values](https://developer.mozilla.org/zh-CN/docs/Web/API/UI_Events/Keyboard_event_key_values)。
#### 方式二:纯键盘快捷键
当你希望完全使用键盘控制缩放操作时,可以设置组合键:
```javascript
{
trigger: {
zoomIn: ['Control', '+'], // 放大快捷键
zoomOut: ['Control', '-'], // 缩小快捷键
reset: ['Control', '0'] // 重置缩放比例快捷键
}
}
```
## 代码示例
### 基础缩放功能
```javascript
const graph = new Graph({
container: 'container',
width: 800,
height: 600,
behaviors: ['zoom-canvas'],
});
```
### 自定义缩放中心
```javascript
const graph = new Graph({
// 其他配置...
behaviors: [
function () {
return {
type: 'zoom-canvas',
origin: this.getCanvasCenter(), // 以视口中心为原点进行缩放
};
},
],
});
```
### 自定义缩放灵敏度
```javascript
const graph = new Graph({
// 其他配置...
behaviors: [
{
type: 'zoom-canvas',
sensitivity: 0.8, // 降低灵敏度,缩放变化更平缓
},
],
});
```
### 使用Shift+滚轮进行缩放
```javascript
const graph = new Graph({
// 其他配置...
behaviors: [
{
type: 'zoom-canvas',
trigger: ['Shift'], // 按住 Shift 键同时滚动才能缩放
},
],
});
```
### 使用键盘快捷键控制缩放
```javascript
const graph = new Graph({
// 其他配置...
behaviors: [
{
type: 'zoom-canvas',
trigger: {
zoomIn: ['Control', '='], // Ctrl + = 放大
zoomOut: ['Control', '-'], // Ctrl + - 缩小
reset: ['Control', '0'], // Ctrl + 0 重置
},
},
],
});
```
### 支持移动端双指缩放
```javascript
const graph = new Graph({
// 其他配置...
behaviors: [
{
type: 'zoom-canvas',
// PC 端其他配置...
},
function () {
return {
type: 'zoom-canvas',
trigger: ['pinch'],
sensitivity: 0.8, // 降低灵敏度,缩放变化更平缓
origin: this.getCanvasCenter(), // 以视口中心为原点进行缩放
};
},
],
});
```
## 常见问题
### 1. 画布缩放超出了预期范围怎么办?
为避免缩放过大或过小,可以设置缩放限制:
```javascript
const graph = new Graph({
// 其他配置...
zoomRange: [0.5, 3], // 允许缩小到50%和放大到300%
behaviors: ['zoom-canvas'],
});
```
### 2. 如何与其他交互结合使用?
缩放与拖拽是常见的组合,实现完整的导航体验:
```javascript
const graph = new Graph({
// 其他配置...
behaviors: ['drag-canvas', 'zoom-canvas'],
});
```
### 3. 触控板双指操作下,与 scroll-canvas 同时使用时的冲突
在触控板上,双指滑动(用于滚动)和双指捏合(用于缩放)手势通常都会被解析为 `wheel` 事件。
由于 `zoom-canvas` 和 `scroll-canvas` 默认都会响应 `wheel` 事件,当它们同时使用时会产生冲突,例如一个手势会同时触发滚动和缩放。
你可以通过检查 `event.ctrlKey` 属性来解决这个问题。在多数平台上,捏合手势会使 `event.ctrlKey` 为 `true`,而滑动则不会。这允许你有条件地仅为捏合手势启用 `zoom-canvas`。
```js | ob { inject: true }
import { Graph } from '@antv/g6';
const graph = new Graph({
container: 'container',
layout: {
type: 'grid',
},
data: {
nodes: [{ id: 'node1' }, { id: 'node2' }, { id: 'node3' }],
},
behaviors: [
'scroll-canvas',
{
key: 'custom-zoom-canvas',
type: 'zoom-canvas',
enable: (event) => {
return event.ctrlKey; // ctrlKey 为 true 时,是双指捏合或扩张操作,false 时是双指滑动操作
},
},
],
});
graph.render();
```
## 实际案例
```js | ob { inject: true }
import { Graph } from '@antv/g6';
const graph = new Graph({
container: 'container',
layout: {
type: 'grid',
},
data: {
nodes: [{ id: 'node1' }, { id: 'node2' }, { id: 'node3' }, { id: 'node4' }, { id: 'node5' }],
edges: [
{ source: 'node1', target: 'node2' },
{ source: 'node1', target: 'node3' },
{ source: 'node1', target: 'node4' },
{ source: 'node2', target: 'node3' },
{ source: 'node3', target: 'node4' },
{ source: 'node4', target: 'node5' },
],
},
behaviors: ['zoom-canvas'],
});
graph.render();
```
Manual Skill
packages/site/docs/manual/contribute.en.md anthropic-skill ~3,049 tokens---
title: contribute
order: 14
---
To contribute, you need to understand G6's code structure and development workflow. The code repository for G6 is located at: https://github.com/antvis/G6
If you want to fix a bug or add a new feature, you need to first fork a copy of the code to your repository, then make modifications in your repository, and finally submit a Pull Request (PR) to the G6 repository.
## Project Structure
<Tree>
<ul>
<li>
packages
<ul>
<li>
g6
<small>G6 Core Implementation</small>
<ul>
<li>
__tests__
<small>Testing and Development Environment</small>
<ul>
<li>
assets
<small>Test Static Resources</small>
</li>
<li>
bugs
<small>Bugfix Test Case</small>
</li>
<li>
dataset
<small>Test Dataset</small>
</li>
<li>
demos
<small>Development Demos</small>
</li>
<li>
snapshots
<small>Test Snapshots</small>
</li>
<li>
perf
<small>Performance Test Case</small>
</li>
<li>
perf-report
<small>Performance Test Reports</small>
</li>
<li>
unit
<small>Test Cases</small>
</li>
<li>
utils
<small>Test Utility Functions</small>
</li>
</ul>
</li>
<li>
src
<ul>
<li>
animations
<small>Animation Executors and Built-in Animations</small>
</li>
<li>
behaviors
<small>Built-in Interactions</small>
</li>
<li>
constants
<small>Constants and Enumeration Values</small>
</li>
<li>
elements
<small>Built-in Elements</small>
<ul>
<li>
combos
<small>Built-in Combos</small>
</li>
<li>
edges
<small>Built-in Edges</small>
</li>
<li>
nodes
<small>Built-in Nodes</small>
</li>
<li>
shapes
<small>Composite Shapes</small>
</li>
</ul>
</li>
<li>
layouts
<small>Layout References and Encapsulation</small>
</li>
<li>
palettes
<small>Built-in Palettes</small>
</li>
<li>
plugins
<small>Built-in Plugins</small>
</li>
<li>
registry
<small>Registry Module</small>
</li>
<li>
runtime
<small>Graph and Core Controller</small>
</li>
<li>
spec
<small>Specification Type Definitions</small>
</li>
<li>
themes
<small>Built-in Themes</small>
</li>
<li>
transforms
<small>Built-in Data Transformations</small>
</li>
<li>
types
<small>Type Definitions</small>
</li>
<li>
utils
<small>Utility Functions</small>
</li>
<li>
exports.ts
<small>Export Items</small>
</li>
<li>
preset.ts
<small>Pre-operations</small>
</li>
</ul>
</li>
<li>
vite.config.js
<small>Development Environment Vite Configuration</small>
</li>
</ul>
</li>
<li>
g6-extension-3d/src
<small>3D Extension</small>
<ul>
<li>
behaviors
<small>3D Behaviors</small>
</li>
<li>
elements
<small>3D Elements</small>
</li>
<li>
plugins
<small>3D Plugins</small>
</li>
<li>
renderer.ts
<small>3D Renderer</small>
</li>
</ul>
</li>
<li>
g6-extension-react/src
<small>React Node Extension</small>
<ul>
<li>
elements
<small>React Elements</small>
</li>
<li>
graph
<small>React Graph Encapsulation</small>
</li>
</ul>
</li>
<li>
site
<small>Official Website and Documentation</small>
<ul>
<li>
docs
<small>Tutorials and API</small>
</li>
<li>
examples
<small>Graph Examples</small>
</li>
<li>
.dumirc.ts
<small>Configuration File</small>
</li>
</ul>
</li>
</ul>
</li>
</ul>
</Tree>
## Development Process
1. Fork and Pull the Code
Fork the G6 repository on Github to your account, then clone it locally.
```bash
# Navigate to your workspace
cd /path/to/your/workspace
# Navigate to the G6 directory
git clone [email protected]:[your username]/G6.git
```
2. Install Dependencies
:::warning{title=Warning}
Please ensure your local environment meets the following requirements:
- [Node.js](https://nodejs.org/) version >= 18
- [pnpm](https://pnpm.io/) version >= 8
:::
```bash
# Enter the G6 code directory
cd G6
# Install Dependencies
pnpm install
```
3. Start the Development Environment
```bash
# Enter the g6 code directory.
cd ./packages/g6
# Start the development environment
pnpm dev
```
At this point, you can access G6's development environment and preview the examples by visiting http://127.0.0.1:8080 in your web browser.
4. Develop New Features or Fix Bugs
Switch to a development branch:
```bash
git checkout -b [branch name]
```
Make code modifications according to your needs and test locally.
5. Write Test Cases
In the `packages/g6/__tests__/unit` directory, write test cases to ensure your code behaves as expected.
Validate Your Code with Tests:
```bash
pnpm test
```
6. Submit a Pull Request (PR)
```bash
# Stage changes
git add .
# Commit Changes
git commit -m "[commit type]: commit message"
# Push to Your Repository
git push
```
Submit a Pull Request (PR) to the G6 repository on GitHub.
## Testing and Coverage
G6 utilizes Jest for conducting unit tests, with the test cases situated in the `packages/g6/__tests__/unit` directory.
We require that all code submissions must pass tests to ensure code quality.
The coverage rate for the current PR (Pull Request) submission is advised not to fall below the coverage rate of the existing codebase, and it is <text style="color: red;">not to fall below 90%</text>.
### Update Test Snapshots
G6 extends Jest tests and provides the `toMatchSnapshot` assertion for generating and comparing snapshots.
If the current possible modification affects the generation of some screenshots, it is necessary to check whether there are failed test cases by executing `pnpm test`.
When a failed test case is found, the console will print the path of the failed test, as well as the path information of the benchmark screenshot and the current screenshot. You can hold the `Ctrl` or `Command` key and click the path to view the specific test case or screenshot.
<img width="500px" src="https://mdn.alipayobjects.com/huamei_qa8qxu/afts/img/A*39j5TKAePWsAAAAAAAAAAAAADmJ7AQ/original"/>
If it is confirmed that this modification is correct, then please manually delete the corresponding benchmark screenshots and regenerate the screenshots:
**Regenerate all screenshots**:
1. Delete all files in the `packages/g6/__tests__/unit/snapshots` directory
2. Execute `pnpm test`
**Regenerate a single screenshot**:
1. Delete the corresponding file in the `packages/g6/__tests__/snapshots` directory (test cases in the `unit` directory will generate the corresponding directory under `snapshots`)
2. Execute `npx jest __tests__/unit/xx/xxx.spec.ts`
## Code Standards
The G6 code adheres to the following standards:
- eslint:recommended
- @typescript-eslint/recommended
- jsdoc/recommended-error
## Commit Conventions
G6 adopts the [Conventional Commits](https://www.conventionalcommits.org/) specification, and the commit message format is as follows:
```
<type>[optional scope]: <description>
```
The type field can be one of the following:
- feat: A new feature
- fix: A bug fix
- docs: Documentation update
- style: Changes that do not affect the meaning of the code (white-space, formatting, missing semi-colons, etc.)
- refactor: Code change that neither fixes a bug nor adds a feature
- perf: A code change that improves performance
- test: Adding missing or correcting existing tests
- build: Changes that affect the build system or external dependencies
- ci: Changes to our CI configuration files and scripts
- chore: Other changes that don't modify src or test files
- revert: Reverts a previous commit
For example:
```
feat: add new feature
refactor(behavior): refactor drag-canvas behavior
```
Please ensure that your commit messages conform to the standards, and try to use English descriptions whenever possible. This helps us better manage the code.
## Pull Request (PR) Standards
After completing the above steps, you can submit a PR to the G6 repository. Please ensure that your PR adheres to the following standards:
- A single PR should address only one issue.
- The title of the PR should be concise and clear.
- The description of the PR should be clear and detailed. If the changes involve the user interface, please include screenshots.
- The PR must pass CI (Continuous Integration) checks.
## Code Review
After your PR is submitted, we will review your code. Please be patient and await the results of the review. If there are any areas that require modification, we will point them out within the PR.
## Release Process
We regularly release new versions. If your PR is for a non-urgent bug fix, it will be included in the next release. If your PR addresses an urgent bug fix, we will release a new version as soon as possible.
This project uses changeset to manage version release, and the specific release process is as follows:
1. Complete related development work
2. Create a branch from v5 (any name you want)
3. Run `npm run version` command, fill in the information according to the prompt, and the version number will be updated automatically
4. Commit the changes to the remote repository
5. Create a PR on GitHub, add the `publish` label, and merge the branch to v5
6. After the branch is merged, GitHub Actions will be triggered automatically, and the package will be published to npm
7. After the release, the Release note needs to be updated. Execute "pnpm tag" in the packages/g6
8. Fill in the tag information on the newly opened Github link. First, select the previous tag, and then select the current tag to obtain the changes. After confirming that there are no issues, release it.
Manual Skill
packages/site/docs/manual/contribute.zh.md anthropic-skill ~2,004 tokens---
title: 参与贡献
order: 14
---
要参与贡献,你需要了解 G6 的代码结构和开发流程。G6 的代码仓库地址是:https://github.com/antvis/G6
如果你想要修复一个 bug 或者增加一个新功能,你需要先 fork 一份代码到你的仓库,然后在你的仓库中进行修改,最后提交 PR 到 G6 的仓库。
## 项目结构
<Tree>
<ul>
<li>
packages
<ul>
<li>
g6
<small>G6 核心实现</small>
<ul>
<li>
__tests__
<small>测试及开发环境</small>
<ul>
<li>
assets
<small>测试静态资源</small>
</li>
<li>
bugs
<small>Bug 修复测试用例</small>
</li>
<li>
dataset
<small>测试数据集</small>
</li>
<li>
demos
<small>开发示例</small>
</li>
<li>
snapshots
<small>测试截图</small>
</li>
<li>
perf
<small>性能测试用例</small>
</li>
<li>
perf-report
<small>性能测试报告</small>
</li>
<li>
unit
<small>测试用例</small>
</li>
<li>
utils
<small>测试工具函数</small>
</li>
</ul>
</li>
<li>
src
<ul>
<li>
animations
<small>动画执行器及内置动画</small>
</li>
<li>
behaviors
<small>内置交互</small>
</li>
<li>
constants
<small>常量及枚举值</small>
</li>
<li>
elements
<small>内置元素</small>
<ul>
<li>
combos
<small>内置组合</small>
</li>
<li>
edges
<small>内置边</small>
</li>
<li>
nodes
<small>内置节点</small>
</li>
<li>
shapes
<small>复合图形</small>
</li>
</ul>
</li>
<li>
layouts
<small>布局引用及封装</small>
</li>
<li>
palettes
<small>内置色板</small>
</li>
<li>
plugins
<small>内置插件</small>
</li>
<li>
registry
<small>注册模块</small>
</li>
<li>
runtime
<small>Graph 及核心控制器</small>
</li>
<li>
spec
<small>Specification 类型定义</small>
</li>
<li>
themes
<small>内置主题</small>
</li>
<li>
transforms
<small>内置数据转换</small>
</li>
<li>
types
<small>类型定义</small>
</li>
<li>
utils
<small>工具函数</small>
</li>
<li>
exports.ts
<small>导出项</small>
</li>
<li>
preset.ts
<small>预操作</small>
</li>
</ul>
</li>
<li>
vite.config.js
<small>开发环境 Vite 配置</small>
</li>
</ul>
</li>
<li>
g6-extension-3d/src
<small>3D 扩展</small>
<ul>
<li>
behaviors
<small>3D 交互</small>
</li>
<li>
elements
<small>3D 元素</small>
</li>
<li>
plugins
<small>3D 插件</small>
</li>
<li>
renderer.ts
<small>3D 渲染器</small>
</li>
</ul>
</li>
<li>
g6-extension-react/src
<small>React 节点扩展</small>
<ul>
<li>
elements
<small>React 元素</small>
</li>
<li>
graph
<small>React Graph 封装</small>
</li>
</ul>
</li>
<li>
site
<small>官网及文档</small>
<ul>
<li>
docs
<small>教程及 API</small>
</li>
<li>
examples
<small>图表示例</small>
</li>
<li>
.dumirc.ts
<small>配置文件</small>
</li>
</ul>
</li>
</ul>
</li>
</ul>
</Tree>
## 开发流程
1. Fork 并拉取代码
在 Github 中 Fork [G6](https://github.com/antvis/G6) 到你的仓库,并拉取到本地。
```bash
# 进入你的工作目录
cd /path/to/your/workspace
# 克隆 G6 代码
git clone [email protected]:[your username]/G6.git
```
2. 安装依赖
:::warning{title=注意}
请验证你的本地环境是否符合要求:
- [Node.js](https://nodejs.org/) 版本 >= 18
- [pnpm](https://pnpm.io/) 版本 >= 8
:::
```bash
# 进入 G6 代码目录
cd G6
# 安装依赖
pnpm install
```
3. 启动开发环境
```bash
# 进入 G6 代码目录
cd ./packages/g6
# 启动开发环境
pnpm dev
```
此时,你可以在浏览器中访问 `http://127.0.0.1:8080` 查看 G6 的开发环境并预览开发示例。
4. 开发新功能或修复 bug
切换到开发分支:
```bash
git checkout -b [branch name]
```
根据你的需求,修改代码并在本地测试。
5. 编写测试用例
在 `packages/g6/__tests__/unit` 目录下编写测试用例,确保你的代码符合预期。
确保你的代码通过测试:
```bash
pnpm test
```
6. 提交 PR
```bash
# 添加修改
git add .
# 提交修改
git commit -m "[commit type]: commit message"
# 推送到你的仓库
git push
```
在 Github 中提交 PR 到 G6 仓库。
## 测试与覆盖率
G6 使用 Jest 进行单元测试,测试用例位于 `packages/g6/__tests__/unit` 目录下。
我们要求所有的代码提交都需要通过测试,确保代码质量。
当前 PR 提交的覆盖率不建议低于当前代码库的覆盖率,且<text style="color: red;">不得低于 90%</text>。
### 更新测试截图
G6 扩展了 Jest 测试,提供了 `toMatchSnapshot` 断言用于生成以及对比快照。
如果当前可能修改影响了部分截图的生成,需要通过执行 `pnpm test` 检查是否有测试用例失败。
当发现测试失败的用例时,控制台会打印出失败的测试路径,以及基准截图和当前截图的路径信息。你可以按住 `Ctrl` 或 `Command` 键并点击路径,查看具体的测试用例或截图。
<img width="500px" src="https://mdn.alipayobjects.com/huamei_qa8qxu/afts/img/A*39j5TKAePWsAAAAAAAAAAAAADmJ7AQ/original"/>
如果确认本次修改是正确的,那么请手动删除对应的基准截图,并重新生成截图:
**重新生成全部截图**:
1. 删除 `packages/g6/__tests__/unit/snapshots` 目录下的所有文件
2. 执行 `pnpm test`
**重新生成单个截图**:
1. 删除 `packages/g6/__tests__/snapshots` 目录下对应的文件(`unit`目录下测试用例会在`snapshots`下生成对应的目录)
2. 执行 `npx jest __tests__/unit/xx/xxx.spec.ts`
## 代码规范
G6 编码尊循以下规范:
- eslint:recommended
- @typescript-eslint/recommended
- jsdoc/recommended-error
## 提交规范
G6 采用 [Conventional Commits](https://www.conventionalcommits.org/) 规范,提交信息格式如下:
```
<type>[optional scope]: <description>
```
type 有以下几种:
- feat: 新功能
- fix: 修复 bug
- docs: 文档更新
- style: 代码格式(不影响代码运行的变动)
- refactor: 重构
- perf: 性能优化
- test: 测试
- build: 构建工具相关的变动
- ci: CI 配置
- chore: 其他无关紧要的变动
- revert: 撤销
例如:
```
feat: add new feature
refactor(behavior): refactor drag-canvas behavior
```
请确保你的提交信息符合规范,并尽量使用英文描述,这样有助于我们更好地管理代码。
## PR 规范
完成上述步骤后,你可以提交 PR 到 G6 仓库。请确保你的 PR 符合以下规范:
- 一个 PR 只解决一个问题
- PR 的标题简洁明了
- PR 的描述清晰详细,涉及视图的变动请附上截图
- PR 必需能够通过 CI 检查
## 代码 Review
PR 提交后,我们会对你的代码进行 Review。请耐心等待 Review 结果,如果有需要修改的地方,我们会在 PR 中提出。
## 发布流程
我们会定期发布新版本,如果你的 PR 是非紧急缺陷修复,我们会在下一个版本中发布。如果你的 PR 是紧急缺陷修复,我们会尽快发布新版本。
本项目通过 changeset 来管理版本发布,具体的发布流程如下:
1. 完成相关的开发工作
2. 从 v5 分支创建一个分支(任意分支名均可)
3. 根目录执行 `npm run version` 命令,根据提示填写相关信息,会自动更新版本号
4. 将变更提交到远程仓库
5. 在 GitHub 上创建一个 PR,并添加 `publish` 标签,将该分支合并到 v5 分支
6. 分支合并后,会自动触发 GitHub Actions,发布到 npm
7. 发布后,需更新 Release note,在 packages/g6 目录下执行 pnpm tag
8. 在新打开的 Github 链接填写 tag 信息,先选择前一个 tag, 然后选择当前 tag 后得到变更,确认没有问题后发布
Manual Skill
packages/site/docs/manual/data.en.md anthropic-skill ~2,440 tokens---
title: Data
order: 1
---
## Overview
G6 is a data-driven charting library, where data is one of the most important concepts. In G6, data is the core of the chart, and both display and interaction are based on data.
Common graph data formats include:CSV, [DOT](https://graphviz.org/doc/info/lang.html), GDF, GML, [GraphML](http://graphml.graphdrawing.org/), [GEXF](https://gexf.net/) etc。
G6 uses JSON format to describe the graph structure, which includes information about nodes and edges. Here is a simple JSON data example:
```json
{
"nodes": [{ "id": "node1" }, { "id": "node2" }],
"edges": [{ "source": "node1", "target": "node2" }]
}
```
Compared to the other formats mentioned above, the JSON format has a more intuitive and understandable data structure. It is also more flexible, allowing for easy expansion of node and edge attributes.
It is a data exchange format widely supported by computers, so you do not have to worry about data format compatibility issues.
## Data Structure
In G6, graph data consists of three parts: `nodes` (node data), `edges` (edge data), and `combos` (combo data). Each part corresponds to different elements in the graph, and their types and data determine how the graph is displayed.
```ts
interface GraphData {
nodes: NodeData[]; // Node data
edges?: EdgeData[]; // Edge data (optional)
combos?: ComboData[]; // Combo data (optional)
}
```
### Node Data
A node is the basic building block of a graph and represents an entity within the graph. Each node has a unique `id` used to identify it, and nodes can also have data, styles, and states.
| Attribute | Type | Description |
| ----------------------------------------- | ------------------ | ------------------------------------------------------------------------------------------------------------------ |
| <Badge type="success">Required</Badge> id | _string_ | Unique identifier for the node, used to distinguish different nodes |
| type | _string_ | Node type. It can be the type of built-in Node, or the custom Node |
| data | _Object_ | Custom data for the node, such as name, description, etc. Can be accessed in style mappings via callback functions |
| style | _Object_ | Node style, including position, size, color, and other visual properties |
| states | _string[]_ | Initial states for the node, such as selected, active, hover, etc. |
| combo | _string_ \| _null_ | ID of the combo the node belongs to. Used to organize hierarchical relationships. If none, it is null |
| children | _string[]_ | Collection of child node IDs, used only in tree diagrams |
**Example:**
```json
{
"id": "node-1",
"type": "circle",
"data": { "name": "alice", "role": "Admin" },
"style": { "x": 100, "y": 200, "size": 32, "fill": "violet" },
"states": ["selected"],
"combo": null
}
```
### Edge Data
An edge connects nodes and represents the relationship between them. Each edge is associated with two nodes (source and target), and edges themselves can have data, styles, and states. Edge data is often used to represent logical relationships, such as user connections in social networks or step flows in flowcharts.
| Attribute | Type | Description |
| --------------------------------------------- | ---------- | ----------------------------------------------------------------------------------------------------------------------- |
| <Badge type="success">Required</Badge> source | _string_ | Source node ID |
| <Badge type="success">Required</Badge> target | _string_ | Target node ID |
| id | _string_ | Unique identifier for the edge. If not specified, `id` is automatically generated with the format `${source}-${target}` |
| type | _string_ | Edge type.It can be the type of built-in Edge, or the custom Edge |
| data | _Object_ | Custom data for the edge, accessible in style mappings via callback functions |
| style | _Object_ | Edge style, including stroke color, line width, arrowhead, etc. |
| states | _string[]_ | Initial states for the edge |
**Example:**
```json
{
"source": "alice",
"target": "bob",
"type": "line",
"data": { "relationship": "friend", "strength": 5 },
"style": { "stroke": "green", "lineWidth": 2 },
"states": ["hover"]
}
```
### Combo Data
Combos allow you to create a logical unit for multiple nodes, used for layering, grouping, or other structural purposes. A combo can contain child nodes or other combos, forming a nested structure.
| Attribute | Type | Description |
| ----------------------------------------- | ------------------ | ------------------------------------------------------------------------------ |
| <Badge type="success">Required</Badge> id | _string_ | Unique identifier for the combo |
| type | _string_ | Combo type.It can be the type of built-in Combo, or the custom Combo |
| data | _Object_ | Custom data for the combo, accessible in style mappings via callback functions |
| style | _Object_ | Combo style |
| states | _string[]_ | Initial states for the combo |
| combo | _string_ \| _null_ | Parent combo ID. If there is no parent combo, it is null |
**Example:**
```json
{
"id": "combo1",
"type": "circle",
"data": { "groupName": "Group A" },
"style": { "fill": "lightblue", "stroke": "blue", "collapsed": true },
"states": [],
"combo": null
}
```
## Data Organization and Best Practices
To ensure correct rendering and interaction of the graph, it is recommended to organize the data according to G6's standard data structure. Each element (node, edge, combo) should contain a `data` field to store business data and custom properties.
- **Avoid using identifiers that conflict with internal G6 field names**, such as `id`, `type`, `style`, etc., to prevent naming conflicts.
- Store business data (such as user information, social network relationships, etc.) in the `data` field. This ensures flexibility and scalability of the data.
**Example:**
```json
{
"nodes": [
{
"id": "node1",
"data": { "name": "Alice", "role": "Admin" }
},
{
"id": "node2",
"data": { "name": "Bob", "role": "User" }
}
],
"edges": [
{
"source": "node1",
"target": "node2",
"data": { "relationship": "friend" }
}
]
}
```
## API
G6 provides a series of APIs to access and manipulate data, including:
- [getData](/en/api/data#graphgetdata)
- [setData](/en/api/data#graphsetdata)
- [getNodeData](/en/api/data#graphgetnodedata)
- [getEdgeData](/en/api/data#graphgetedgedata)
- [getComboData](/en/api/data#graphgetcombodata)
- [addData](/en/api/data#graphadddata)
- [addNodeData](/en/api/data#graphaddnodedata)
- [addEdgeData](/en/api/data#graphaddedgedata)
- [addComboData](/en/api/data#graphaddcombodata)
- [updateData](/en/api/data#graphupdatedata)
- [updateNodeData](/en/api/data#graphupdatenodedata)
- [updateEdgeData](/en/api/data#graphupdateedgedata)
- [updateComboData](/en/api/data#graphupdatecombodata)
- [removeData](/en/api/data#graphremovedata)
- [removeNodeData](/en/api/data#graphremovenodedata)
- [removeEdgeData](/en/api/data#graphremoveedgedata)
- [removeComboData](/en/api/data#graphremovecombodata)
Through different APIs, you can conveniently access and manipulate graph data, performing operations such as adding, deleting, modifying, and querying the graph.
## Use Remote Data
G6 does not provide functionality for data retrieval and parsing. For local JSON data, you can directly import and use it as follows:
```typescript
import data from './path/to/data.json' assert { type: 'json' };
```
For remote data, you can use `fetch` or other networking libraries to retrieve the data:
```typescript
fetch('https://path/to/data.json')
.then((res) => res.json())
.then((data) => {
// Use data
});
```
Manual Skill
packages/site/docs/manual/data.zh.md anthropic-skill ~2,815 tokens---
title: 数据 Data
order: 4
---
## 概述
G6 是一款数据驱动的图可视化引擎,数据是 G6 中最重要的概念之一。
G6 使用标准的 JSON 格式描述图数据结构。以下是一个基础的图数据示例:
```javascript {4-7}
import { Graph } from '@antv/g6';
const graph = new Graph({
data: {
nodes: [{ id: 'node1' }, { id: 'node2' }],
edges: [{ source: 'node1', target: 'node2' }],
},
});
```
## 数据结构
图数据包含三部分:`nodes`(节点数据)、`edges`(边数据)、`combos`(组合数据)。每一部分对应图中的不同元素,它们的类型和数据决定了图如何展示。
### 图数据(GraphData)
| 属性 | 描述 | 类型 | 默认值 | 必选 |
| ------ | -------- | --------------------------------- | ------ | ---- |
| nodes | 节点数据 | [NodeData](#节点数据nodedata)[] | - | |
| edges | 边数据 | [EdgeData](#边数据edgedata)[] | - | |
| combos | 组合数据 | [ComboData](#组合数据combodata)[] | - | |
### 节点数据(NodeData)
节点是图中的基本构成单元,它代表图中的实体。每个节点都有一个唯一的 `id`,用于标识节点,同时节点也可以有数据、样式和状态。
| 属性 | 描述 | 类型 | 默认值 | 必选 |
| -------- | -------------------------------------------------------------------------------------------- | -------------- | ------ | ---- |
| id | 节点的唯一标识符,用于区分不同的节点 | string | - | ✓ |
| type | 节点类型,内置节点类型名称或者自定义节点的名称 | string | - | |
| data | 节点数据,用于存储节点的自定义数据,例如节点的名称、描述等。可以在样式映射中通过回调函数获取 | object | - | |
| style | 节点样式,包括位置、大小、颜色等视觉属性 | object | - | |
| states | 节点初始状态,如选中、激活、悬停等 | string[] | - | |
| combo | 所属的组合 ID,用于组织节点的层级关系,如果没有则为 null | string \| null | - | |
| children | 子节点 ID 集合,仅在树图场景下使用 | string[] | - | |
**示例:**
```json
{
"id": "node-1",
"type": "circle",
"data": { "name": "alice", "role": "Admin" },
"style": { "x": 100, "y": 200, "size": 32, "fill": "violet" },
"states": ["selected"],
"combo": null
}
```
### 边数据(EdgeData)
边是连接节点的元素,表示节点之间的关系。每条边都与两个节点(起始节点和目标节点)关联,并且边本身可以有数据、样式和状态。边的数据常用于表示节点之间的逻辑或关系,如社交网络中的用户关系、流程图中的步骤流转等。
| 属性 | 描述 | 类型 | 默认值 | 必选 |
| ------ | ---------------------------------------------------------------- | -------- | ------ | ---- |
| source | 边起始节点 ID | string | - | ✓ |
| target | 边目标节点 ID | string | - | ✓ |
| id | 边的唯一标识符 | string | - | |
| type | 边类型,内置边类型名称或者自定义边的名称 | string | - | |
| data | 边数据,用于存储边的自定义数据,可以在样式映射中通过回调函数获取 | object | - | |
| style | 边样式,包括线条颜色、宽度、箭头等视觉属性 | object | - | |
| states | 边初始状态 | string[] | - | |
**示例:**
```json
{
"source": "alice",
"target": "bob",
"type": "line",
"data": { "relationship": "friend", "strength": 5 },
"style": { "stroke": "green", "lineWidth": 2 },
"states": ["hover"]
}
```
### 组合数据(ComboData)
通过组合,可以为多个节点创建一个逻辑单元,用于图形的分层、分组或其他结构化需求。组合可以包含子节点或其他组合,从而形成嵌套层次。
| 属性 | 描述 | 类型 | 默认值 | 必选 |
| ------ | -------------------------------------------------------------------- | -------------- | ------ | ---- |
| id | 组合的唯一标识符 | string | - | ✓ |
| type | 组合类型,内置组合类型名称或者自定义组合名称 | string | - | |
| data | 组合数据,用于存储组合的自定义数据,可以在样式映射中通过回调函数获取 | object | - | |
| style | 组合样式 | object | - | |
| states | 组合初始状态 | string[] | - | |
| combo | 组合的父组合 ID。如果没有父组合,则为 null | string \| null | - | |
**示例:**
```json
{
"id": "combo1",
"type": "circle",
"data": { "groupName": "Group A" },
"style": { "fill": "lightblue", "stroke": "blue", "collapsed": true },
"states": [],
"combo": null
}
```
## 数据操作
G6 提供了丰富的 API 来操作图数据,下面展示一些常见的数据操作示例。
### 数据初始化
在创建图实例时,可以直接传入数据:
```javascript
const graph = new Graph({
data: {
nodes: [
{ id: 'node1', data: { label: '节点1' } },
{ id: 'node2', data: { label: '节点2' } },
],
edges: [{ source: 'node1', target: 'node2', data: { label: '关系' } }],
},
});
```
或者通过 `setData` 方法设置数据:
```javascript
graph.setData({
nodes: [
{ id: 'node3', data: { label: '节点3' } },
{ id: 'node4', data: { label: '节点4' } },
],
edges: [{ source: 'node3', target: 'node4', data: { label: '新关系' } }],
});
```
### 数据增删改查
#### 添加节点和边
```javascript
// 添加单个节点
graph.addNodeData([
{
id: 'node5',
data: {
label: '新节点',
category: 'person',
},
style: {
fill: '#6395F9',
stroke: '#5B8FF9',
},
},
]);
// 批量添加多个节点
graph.addNodeData([
{ id: 'node6', data: { label: '批量节点1' } },
{ id: 'node7', data: { label: '批量节点2' } },
]);
// 添加连接新节点的边
graph.addEdgeData([
{
source: 'node1',
target: 'node5',
data: {
label: '连接到新节点',
weight: 2,
},
style: {
stroke: '#F6BD16',
lineWidth: 3,
},
},
]);
```
#### 更新数据
```javascript
// 更新单个节点
graph.updateNodeData([
{
id: 'node1',
data: {
label: '已更新的节点1',
status: 'updated',
},
style: {
fill: '#F6BD16',
stroke: '#EBEBEB',
lineWidth: 2,
},
},
]);
// 更新多个节点
graph.updateNodeData([
{
id: 'node2',
style: { size: 40, fill: '#5AD8A6' },
},
{
id: 'node3',
data: { importance: 'high' },
},
]);
// 更新边
graph.updateEdgeData([
{
source: 'node1',
target: 'node2',
style: {
stroke: '#5B8FF9',
lineWidth: 2,
lineDash: [5, 5],
},
},
]);
```
#### 删除数据
```javascript
// 删除单个节点(以及与该节点相连的所有边)
graph.removeNodeData(['node7']);
// 删除多个节点
graph.removeNodeData(['node5', 'node6']);
// 删除边
graph.removeEdgeData(['node1-node2']);
```
#### 查询数据
```javascript
// 获取所有节点数据
const nodes = graph.getNodeData();
// 获取所有边数据
const edges = graph.getEdgeData();
// 获取特定节点数据
const node1 = graph.getNodeData('node1');
// 获取特定边数据
const edge1 = graph.getEdgeData('node1-node2');
```
### 复杂数据结构操作
#### 嵌套组合(Combo)
下面是创建和操作嵌套组合的示例:
```javascript
import { Graph } from '@antv/g6';
const data = {
nodes: [
{ id: 'node1', data: { label: '节点1' }, combo: 'combo1' },
{ id: 'node2', data: { label: '节点2' }, combo: 'combo1' },
{ id: 'node3', data: { label: '节点3' }, combo: 'combo2' },
{ id: 'node4', data: { label: '节点4' }, combo: 'combo2' },
{ id: 'node5', data: { label: '节点5' }, combo: 'combo3' },
],
edges: [
{ source: 'node1', target: 'node3' },
{ source: 'node2', target: 'node4' },
{ source: 'node4', target: 'node5' },
],
combos: [
{ id: 'combo1', data: { label: '组1' } },
{ id: 'combo2', data: { label: '组2' } },
{ id: 'combo3', data: { label: '组3' }, combo: 'combo1' }, // 嵌套组合
],
};
const graph = new Graph({
container: 'container',
data,
layout: {
type: 'force',
},
});
// 添加新的组合
graph.addComboData([
{
id: 'combo4',
data: { label: '新组' },
combo: 'combo2', // 添加到现有组合中
},
]);
// 将节点移动到不同的组合
graph.updateNodeData([
{
id: 'node5',
combo: 'combo4', // 将节点5移动到新组合
},
]);
// 展开/折叠组合
graph.updateComboData([
{
id: 'combo1',
style: { collapsed: true }, // 折叠组合1
},
]);
graph.render();
```
#### 树形结构数据
对于树形结构,G6 支持使用 `children` 属性表示层次关系:
```javascript
// 树形结构数据
import { Graph, treeToGraphData } from '@antv/g6';
const treeData = {
id: 'root',
children: [
{
id: 'child1',
children: [{ id: 'grandchild1' }],
},
{
id: 'child2',
children: [{ id: 'grandchild2' }],
},
],
};
const data = treeToGraphData(treeData);
const graph = new Graph({
container: 'container',
data,
layout: {
type: 'dendrogram', // 或 'compactBox', 'mindmap' 等树布局
direction: 'TB', // 从上到下布局
nodeSep: 50, // 节点间距
rankSep: 100, // 层级间距
},
});
graph.render();
```
通过 `treeToGraphData` 方法,可以将树形结构数据转换为 G6 的标准数据结构,实际传入到 `data` 中的数据结构如下:
```json
{
"nodes": [
{ "id": "root", "depth": 0, "children": ["child1", "child2"] },
{ "id": "child1", "depth": 1, "children": ["grandchild1"] },
{ "id": "grandchild1", "depth": 2 },
{ "id": "child2", "depth": 1, "children": ["grandchild2"] },
{ "id": "grandchild2", "depth": 2 }
],
"edges": [
{ "source": "root", "target": "child1" },
{ "source": "root", "target": "child2" },
{ "source": "child1", "target": "grandchild1" },
{ "source": "child2", "target": "grandchild2" }
]
}
```
## 数据组织与最佳实践
为了确保图的正确渲染和交互,建议按照 G6 标准数据结构组织数据。每个元素(节点、边、组合)应包含一个 `data` 字段,用于存放业务数据和自定义属性。
- **避免使用与 G6 内部字段名称相同的标识符**,如 `id`、`type`、`style` 等,防止发生命名冲突。
- 将业务数据(如用户信息、社交网络关系等)存储在 `data` 字段中,这样可以确保数据的灵活性和可扩展性。
- **使用样式映射**来根据业务数据动态设置视觉属性,而不是直接修改样式对象。
### 数据与样式分离
良好的做法是将数据和样式分离,通过映射函数将数据属性转换为视觉属性:
```javascript
import { Graph } from '@antv/g6';
// 使用数据驱动样式
const graph = new Graph({
container: 'container',
data: {
nodes: [
{ id: 'node1', data: { value: 10, category: 'A' } },
{ id: 'node2', data: { value: 5, category: 'B' } },
],
},
node: {
style: {
// 根据数据中的 value 字段动态设置节点大小
size: (node) => 20 + node.data.value * 2,
// 根据数据中的 category 字段设置不同颜色
fill: (node) => {
const categoryColors = { A: '#F6BD16', B: '#5B8FF9' };
return categoryColors[node.data.category] || '#CCC';
},
},
},
});
```
## API
G6 提供了一系列的 API 来访问和操作数据,包括:
- [getData](/api/data#graphgetdata)
- [setData](/api/data#graphsetdata)
- [getNodeData](/api/data#graphgetnodedata)
- [getEdgeData](/api/data#graphgetedgedata)
- [getComboData](/api/data#graphgetcombodata)
- [addData](/api/data#graphadddata)
- [addNodeData](/api/data#graphaddnodedata)
- [addEdgeData](/api/data#graphaddedgedata)
- [addComboData](/api/data#graphaddcombodata)
- [updateData](/api/data#graphupdatedata)
- [updateNodeData](/api/data#graphupdatenodedata)
- [updateEdgeData](/api/data#graphupdateedgedata)
- [updateComboData](/api/data#graphupdatecombodata)
- [removeData](/api/data#graphremovedata)
- [removeNodeData](/api/data#graphremovenodedata)
- [removeEdgeData](/api/data#graphremoveedgedata)
- [removeComboData](/api/data#graphremovecombodata)
通过不同的 API,你可以方便地访问和操作图数据,实现图的增删改查等操作。
## 使用远程数据
G6 并不提供数据的获取和解析功能,对于本地 JSON 数据,你可以直接引入使用:
```typescript
import data from './path/to/data.json' assert { type: 'json' };
```
对于远程数据,你可以使用 `fetch` 或者其他网络请求库来获取数据:
```typescript
fetch('https://path/to/data.json')
.then((res) => res.json())
.then((data) => {
// 使用 data
const graph = new Graph({
container: 'container',
data,
});
// 触发布局和渲染
graph.render();
})
.catch((error) => {
console.error('加载数据失败:', error);
});
```
Combo Skill
packages/site/docs/manual/element/combo/BaseCombo.en.md anthropic-skill ~29,525 tokens---
title: Combo Common Options
order: 1
---
This document introduces the built-in combo common property configurations.
## ComboOptions
```js {5-9}
import { Graph } from '@antv/g6';
const graph = new Graph({
combo: {
type: 'circle', // Combo type
style: {}, // Combo style
state: {}, // State style
palette: {}, // Palette configuration
animation: {}, // Animation configuration
},
});
```
| Property | Description | Type | Default | Required |
| --------- | --------------------------------------------------------- | ----------------------- | -------- | -------- |
| type | Combo type, built-in combo type name or custom combo name | [Type](#type) | `circle` | |
| style | Combo style configuration, including color, size, etc. | [Style](#style) | - | |
| state | Style configuration for different states | [State](#state) | - | |
| palette | Define combo palette for mapping colors based on data | [Palette](#palette) | - | |
| animation | Define combo animation effects | [Animation](#animation) | - | |
## Type
Specifies the combo type, built-in combo type name or custom combo name. Default is `circle`. **⚠️ Note**: This determines the shape of the main graphic.
```js {3}
const graph = new Graph({
combo: {
type: 'circle',
},
});
```
**⚠️ Dynamic Configuration Note**: The `type` property also supports dynamic configuration, allowing you to dynamically select combo types based on combo data:
```js
const graph = new Graph({
combo: {
// Static configuration
type: 'circle',
// Dynamic configuration - arrow function form
type: (datum) => datum.data.comboType || 'circle',
// Dynamic configuration - regular function form (can access graph instance)
type: function (datum) {
console.log(this); // graph instance
return datum.data.category === 'important' ? 'rect' : 'circle';
},
},
});
```
Available values:
- `circle`: [Circle Combo](/en/manual/element/combo/circle)
- `rect`: [Rect Combo](/en/manual/element/combo/rect)
## Style
Defines combo style, including color, size, etc.
```js {3}
const graph = new Graph({
combo: {
style: {},
},
});
```
**⚠️ Dynamic Configuration Note**: All style properties below support dynamic configuration, meaning you can pass functions to dynamically calculate property values based on combo data:
```js
const graph = new Graph({
combo: {
style: {
// Static configuration
fill: '#1783FF',
// Dynamic configuration - arrow function form
stroke: (datum) => (datum.data.isActive ? '#FF0000' : '#000000'),
// Dynamic configuration - regular function form (can access graph instance)
lineWidth: function (datum) {
console.log(this); // graph instance
return datum.data.importance > 5 ? 3 : 1;
},
// Nested properties also support dynamic configuration
labelText: (datum) => `Combo: ${datum.id}`,
badges: (datum) => datum.data.tags.map((tag) => ({ text: tag })),
},
},
});
```
Where the `datum` parameter is the combo data object (`ComboData`), containing all combo data information.
A complete combo consists of the following parts:
<img width="240" src="https://mdn.alipayobjects.com/huamei_qa8qxu/afts/img/A*z-OxR4MAdUwAAAAAAAAAAAAADmJ7AQ/original" />
- `key`: The main graphic of the combo, representing the primary shape of the combo, such as circle, rectangle, etc.
- `label`: Text label, usually used to display the combo's name or description
- `halo`: Graphic displaying halo effect around the main graphic
- `badge`: Badge displayed at the top-right corner of the combo by default
The following style configurations will be explained by atomic graphics:
### Main Graphic Style
The main graphic is the core part of the combo, defining the basic shape and appearance of the combo. Here are common configuration scenarios:
#### Basic Style Configuration
Set the basic appearance of the combo:
```js | ob { inject: true }
import { Graph } from '@antv/g6';
const graph = new Graph({
container: 'container',
width: 200,
height: 100,
autoFit: 'center',
data: {
nodes: [{ id: 'node1', combo: 'combo1' }],
combos: [{ id: 'combo1' }],
},
combo: {
style: {
fill: '#5B8FF9', // Blue fill
stroke: '#1A1A1A', // Dark stroke
lineWidth: 2,
fillOpacity: 0.2,
},
},
});
graph.render();
```
#### Transparency and Shadow Effects
Add transparency and shadow effects to combos:
```js | ob { inject: true }
import { Graph } from '@antv/g6';
const graph = new Graph({
container: 'container',
width: 200,
height: 100,
autoFit: 'center',
data: {
nodes: [{ id: 'node1', combo: 'combo1' }],
combos: [{ id: 'combo1' }],
},
combo: {
style: {
fill: '#61DDAA',
fillOpacity: 0.15,
shadowColor: 'rgba(97, 221, 170, 0.4)',
shadowBlur: 12,
shadowOffsetX: 2,
shadowOffsetY: 4,
stroke: '#F0F0F0',
lineWidth: 1,
},
},
});
graph.render();
```
#### Dashed Border Style
Create combos with dashed borders:
```js | ob { inject: true }
import { Graph } from '@antv/g6';
const graph = new Graph({
container: 'container',
width: 200,
height: 100,
autoFit: 'center',
data: {
nodes: [{ id: 'node1', combo: 'combo1' }],
combos: [{ id: 'combo1' }],
},
combo: {
style: {
fill: '#FFF1F0',
fillOpacity: 0.1,
stroke: '#F5222D',
lineWidth: 2,
lineDash: [6, 4],
lineCap: 'round',
},
},
});
graph.render();
```
Here is the complete main graphic style configuration:
| Property | Description | Type | Default | Required |
| ------------------------------- | ---------------------------------------------------------------------------------------------------------------------------------------- | ----------------------------- | --------- | -------- |
| collapsed | Whether the current combo is collapsed | boolean | false | |
| cursor | Combo mouse hover style, [options](#cursor) | string | default | |
| fill | Combo fill color | string | `#99ADD1` | |
| fillOpacity | Combo fill opacity | number \| string | 0.04 | |
| increasedLineWidthForHitTesting | When lineWidth is small, the interactive area becomes small. Sometimes we want to increase this area to make "thin lines" easier to pick | number | 0 | |
| lineCap | Combo stroke end cap style | `round` \| `square` \| `butt` | `butt` | |
| lineDash | Combo stroke dash style | number[] | - | |
| lineDashOffset | Combo stroke dash offset | number | - | |
| lineJoin | Combo stroke join style | `round` \| `bevel` \| `miter` | `miter` | |
| lineWidth | Combo stroke width | number | 1 | |
| opacity | Combo opacity | number \| string | 1 | |
| pointerEvents | How combo responds to pointer events, [options](#pointerevents) | string | `auto` | |
| shadowBlur | Combo shadow blur | number | - | |
| shadowColor | Combo shadow color | string | - | |
| shadowOffsetX | Combo shadow offset in x direction | number \| string | - | |
| shadowOffsetY | Combo shadow offset in y direction | number \| string | - | |
| shadowType | Combo shadow type | `inner` \| `outer` | `outer` | |
| size | Combo size, quick setting for combo width and height, [options](#size) | number \| number[] | - | |
| stroke | Combo stroke color | string | `#99ADD1` | |
| strokeOpacity | Combo stroke opacity | number \| string | 1 | |
| transform | Transform property allows you to rotate, scale, skew or translate the given combo | string | - | |
| transformOrigin | Rotation and scaling center, also called transformation center | string | - | |
| visibility | Whether combo is visible | `visible` \| `hidden` | `visible` | |
| x | Combo x coordinate | number | 0 | |
| y | Combo y coordinate | number | 0 | |
| z | Combo z coordinate | number | 0 | |
| zIndex | Combo rendering layer | number | 0 | |
#### Size
Combo size, quick setting for combo width and height, supports three configuration methods:
- number: Indicates that combo width and height are the same as the specified value
- [number, number]: Indicates that combo width and height are represented by array elements in order for combo width and height
- [number, number, number]: Indicates that combo width, height, and depth are represented by array elements in order
#### PointerEvents
The `pointerEvents` property controls how graphics respond to interaction events. Refer to [MDN documentation](https://developer.mozilla.org/en-US/docs/Web/CSS/pointer-events).
Available values: `visible` | `visiblepainted` | `visiblestroke` | `non-transparent-pixel` | `visiblefill` | `visible` | `painted` | `fill` | `stroke` | `all` | `none` | `auto` | `inherit` | `initial` | `unset`
In short, `fill`, `stroke`, and `visibility` can independently or in combination affect pick testing behavior. Currently supports the following keywords:
- **`auto`**: Default value, equivalent to `visiblepainted`
- **`none`**: Will never be the target of responding events
- **`visiblepainted`**: Will respond to events only when the following conditions are met:
- `visibility` is set to `visible`, i.e., the graphic is visible
- Triggered in the graphic fill area and `fill` takes a non-`none` value; or triggered in the graphic stroke area and `stroke` takes a non-`none` value
- **`visiblefill`**: Will respond to events only when the following conditions are met:
- `visibility` is set to `visible`, i.e., the graphic is visible
- Triggered in the graphic fill area, not affected by the `fill` value
- **`visiblestroke`**: Will respond to events only when the following conditions are met:
- `visibility` is set to `visible`, i.e., the graphic is visible
- Triggered in the graphic stroke area, not affected by the `stroke` value
- **`visible`**: Will respond to events only when the following conditions are met:
- `visibility` is set to `visible`, i.e., the graphic is visible
- Triggered in the graphic fill or stroke area, not affected by `fill` and `stroke` values
- **`painted`**: Will respond to events only when the following conditions are met:
- Triggered in the graphic fill area and `fill` takes a non-`none` value; or triggered in the graphic stroke area and `stroke` takes a non-`none` value
- Not affected by `visibility` value
- **`fill`**: Will respond to events only when the following conditions are met:
- Triggered in the graphic fill area, not affected by the `fill` value
- Not affected by `visibility` value
- **`stroke`**: Will respond to events only when the following conditions are met:
- Triggered in the graphic stroke area, not affected by the `stroke` value
- Not affected by `visibility` value
- **`all`**: Will respond to events as long as entering the graphic fill and stroke areas, not affected by `fill`, `stroke`, `visibility` values
**Usage Examples:**
```js
// Example 1: Only stroke area responds to events
const graph = new Graph({
combo: {
style: {
fill: 'none',
stroke: '#000',
lineWidth: 2,
pointerEvents: 'stroke', // Only stroke responds to events
},
},
});
// Example 2: Does not respond to events at all
const graph = new Graph({
combo: {
style: {
pointerEvents: 'none', // Combo does not respond to any events
},
},
});
```
#### Cursor
Available values: `auto` | `default` | `none` | `context-menu` | `help` | `pointer` | `progress` | `wait` | `cell` | `crosshair` | `text` | `vertical-text` | `alias` | `copy` | `move` | `no-drop` | `not-allowed` | `grab` | `grabbing` | `all-scroll` | `col-resize` | `row-resize` | `n-resize` | `e-resize` | `s-resize` | `w-resize` | `ne-resize` | `nw-resize` | `se-resize` | `sw-resize` | `ew-resize` | `ns-resize` | `nesw-resize` | `nwse-resize` | `zoom-in` | `zoom-out`
### Style When Expanded
Main graphic style when the combo is expanded
| Attribute | Description | Type | Default | Required |
| ------------------------------- | ------------------------------------------------------------------------------------------------------------------------------------------------- | ------------------------------------------------------------------------------- | --------- | -------- |
| collapsed | Whether the combo is currently collapsed | boolean | false | |
| cursor | Combo mouse hover style, [configuration item](#cursor) | string | default | |
| fill | Combo fill color | string | `#99ADD1` | |
| fillOpacity | Combo fill color opacity | number string | 0.04 | |
| increasedLineWidthForHitTesting | When lineWidth is small, the interactive area also becomes smaller. Sometimes we want to enlarge this area to make "thin lines" easier to pick up | number | 0 | |
| lineCap | Combo stroke end style | `round` `square` `butt` | `butt` | |
| lineDash | Combo stroke dash style | number[] | - | |
| lineDashOffset | Combo stroke dash offset | number | - | |
| lineJoin | Combo stroke join style | `round` `bevel` `miter` | `miter` | |
| lineWidth | Combo stroke width | number | 1 | |
| opacity | Combo opacity | number string | 1 | |
| shadowBlur | Combo shadow blur | number | - | |
| shadowColor | Combo shadow color | string | - | |
| shadowOffsetX | Combo shadow offset in the x-axis direction | number string | - | |
| shadowOffsetY | Combo shadow offset in the y-axis direction | number string | - | |
| shadowType | Combo shadow type | `inner` `outer` | `outer` | |
| stroke | Combo stroke color | string | `#99add1` | |
| strokeOpacity | Combo stroke color opacity | number string | 1 | |
| visibility | Whether the combo is visible | `visible` `hidden` | `visible` | |
| x | Combo x coordinate | number | 0 | |
| y | Combo y coordinate | number | 0 | |
| z | Combo z coordinate | number | 0 | |
| zIndex | Combo rendering layer | number | 0 | |
| `{styleProps}` | More graphic configurations, refer to [BaseStyleProps](https://g.antv.antgroup.com/api/basic/display-object#绘图属性) configuration items | [BaseStyleProps](https://g.antv.antgroup.com/api/basic/display-object#绘图属性) | - | |
#### Cursor
Optional values are: `auto` | `default` | `none` | `context-menu` | `help` | `pointer` | `progress` | `wait` | `cell` | `crosshair` | `text` | `vertical-text` | `alias` | `copy` | `move` | `no-drop` | `not-allowed` | `grab` | `grabbing` | `all-scroll` | `col-resize` | `row-resize` | `n-resize` | `e-resize` | `s-resize` | `w-resize` | `ne-resize` | `nw-resize` | `se-resize` | `sw-resize` | `ew-resize` | `ns-resize` | `nesw-resize` | `nwse-resize` | `zoom-in` | `zoom-out`
**Example:**
```js {5-7}
const graph = new Graph({
// Other configurations...
combo: {
style: {
fill: '#1783FF', // Fill color
stroke: '#000', // Stroke color
lineWidth: 2, // Stroke width
},
},
});
```
The effect is as follows:
```js | ob { pin: false, inject: true }
import { Graph } from '@antv/g6';
const graph = new Graph({
container: 'container',
width: 240,
height: 100,
autoFit: 'center',
data: {
nodes: [{ id: 'node1', combo: 'combo1' }],
combos: [{ id: 'combo1' }],
},
combo: {
style: { fill: '#1783FF', stroke: '#000', lineWidth: 2 },
},
});
graph.render();
```
### Style When Collapsed
Effective when `collapsed` is `true`
| Attribute | Description | Type | Default | Required |
| ---------------------------------------- | ---------------------------------------------------------------------------------------------------------------------------------------------------------------------------- | ------------------------------------------------------------------------------- | ---------------------------------------- | -------- |
| collapsedCursor | Mouse hover style when the combo is collapsed, [configuration item](#cursor) | string | Same as the cursor when expanded | |
| collapsedFill | Fill color when the combo is collapsed | string | Same as the fill when expanded | |
| collapsedFillOpacity | Fill color opacity when the combo is collapsed | number string | 1 | |
| collapsedIncreasedLineWidthForHitTesting | When the combo is collapsed, if lineWidth is small, the interactive area also becomes smaller. Sometimes we want to enlarge this area to make "thin lines" easier to pick up | number | 0 | |
| collapsedLineCap | Stroke end style when the combo is collapsed | `round` `square` `butt` | Same as the lineCap when expanded | |
| collapsedLineDash | Stroke dash style when the combo is collapsed | number[] | Same as the lineDash when expanded | |
| collapsedLineDashOffset | Stroke dash offset when the combo is collapsed | number | Same as the lineDashOffset when expanded | |
| collapsedLineJoin | Stroke join style when the combo is collapsed | `round` `bevel` `miter` | Same as the lineJoin when expanded | |
| collapsedLineWidth | Stroke width when the combo is collapsed | number | Same as the lineWidth when expanded | |
| collapsedMarker | Whether to display the marker when the combo is collapsed, [configuration item](#collapsedMarkerStyle) | boolean | true | |
| collapsedOpacity | Opacity when the combo is collapsed | number string | Same as the opacity when expanded | |
| collapsedShadowBlur | Shadow blur when the combo is collapsed | number | Same as the shadowBlur when expanded | |
| collapsedShadowColor | Shadow color when the combo is collapsed | string | Same as the shadowColor when expanded | |
| collapsedShadowOffsetX | Shadow offset in the x-axis direction when the combo is collapsed | number string | Same as the shadowOffsetX when expanded | |
| collapsedShadowOffsetY | Shadow offset in the y-axis direction when the combo is collapsed | number string | Same as the shadowOffsetY when expanded | |
| collapsedShadowType | Shadow type when the combo is collapsed | `inner` `outer` | Same as the shadowType when expanded | |
| collapsedSize | Size when the combo is collapsed | number | [number, number] | [number, number, number] | 32 | |
| collapsedStroke | Stroke color when the combo is collapsed | string | Same as the stroke when expanded | |
| collapsedStrokeOpacity | Stroke color opacity when the combo is collapsed | number string | Same as the strokeOpacity when expanded | |
| collapsedVisibility | Whether the combo is visible when collapsed | `visible` `hidden` | Same as the visibility when expanded | |
| `collapsed{styleProps}` | More graphic configurations, refer to [BaseStyleProps](https://g.antv.antgroup.com/api/basic/display-object#绘图属性) configuration items | [BaseStyleProps](https://g.antv.antgroup.com/api/basic/display-object#绘图属性) | - | |
**Example:**
```js {5-7}
const graph = new Graph({
// Other configurations...
combo: {
style: {
collapsedFill: '#1783FF', // Fill color
collapsedStroke: '#000', // Stroke color
collapsedLineWidth: 2, // Stroke width
},
},
});
```
The effect is as follows:
```js | ob { pin: false, inject: true }
import { Graph } from '@antv/g6';
const graph = new Graph({
container: 'container',
width: 240,
height: 100,
autoFit: 'center',
data: {
nodes: [{ id: 'node1', combo: 'combo1' }],
combos: [{ id: 'combo1', style: { collapsed: true } }],
},
combo: {
style: { collapsedFill: '#1783FF', collapsedStroke: '#000', collapsedLineWidth: 2 },
},
});
graph.render();
```
### Collapsed Marker Style
Effective when `collapsedMarker` is `true`
| Attribute | Description | Type | Default | Required |
| ----------------------------- | ------------------------------------------------------------------------------------------------------------------------------------------------------------------------------------------------------------------------------------------------------------------------------------------------------------------------------------------------------------------- | ---------------------------------------------------------------------------------------------------------------------------------- | ------------- | -------- |
| collapsedMarkerType | Marker type displayed when the combo is collapsed <br> - `'child-count'`: Number of child elements (including Node and Combo) <br>- `'descendant-count'`: Number of descendant elements (including Node and Combo) <br>- `'node-count'`: Number of descendant elements (only including Node) <br> - `(children: NodeLikeData[]) => string`: Custom processing logic | `child-count` \| `descendant-count` \| `node-count` \| ((children: NodeData \| ComboData[]) => string) | `child-count` | |
| collapsedMarkerFill | Icon text color | string | #fff | |
| collapsedMarkerFillOpacity | Icon text color opacity | number | 1 | |
| collapsedMarkerFontSize | Icon font size | number | 12 | |
| collapsedMarkerFontWeight | Icon font weight | number \| string | `normal` | |
| collapsedMarkerRadius | Icon corner radius | number | 0 | |
| collapsedMarkerSrc | Image source. Its priority is higher than `collapsedMarkerText` | string | - | |
| collapsedMarkerText | Icon text | string | - | |
| collapsedMarkerTextAlign | Icon text horizontal alignment | `center` `end` `left` `right` `start` | `center` | |
| collapsedMarkerTextBaseline | Icon text alignment baseline | `alphabetic` `bottom` `hanging` `ideographic` `middle` `top` | `middle` | |
| collapsedMarkerWidth | Icon width | number | - | |
| collapsedMarkerHeight | Icon height | number | - | |
| collapsedMarkerZIndex | Icon rendering layer | number | 1 | |
| `collapsedMarker{StyleProps}` | More icon style configurations, refer to [TextStyleProps](https://g.antv.antgroup.com/api/basic/text), [ImageStyleProps](https://g.antv.antgroup.com/api/basic/image) configuration items. For example, collapsedMarkerFontSize represents the font size of the text icon | [TextStyleProps](https://g.antv.antgroup.com/api/basic/text) | [ImageStyleProps](https://g.antv.antgroup.com/api/basic/image) | - | |
**Example:**
```js {5-6}
const graph = new Graph({
// Other configurations...
combo: {
style: {
collapsedMarkerFill: '#1783FF', // Fill color
collapsedMarkerFontSize: 30, // Icon font size
},
},
});
```
The effect is as follows:
```js | ob { pin: false, inject: true }
import { Graph } from '@antv/g6';
const graph = new Graph({
container: 'container',
width: 240,
height: 100,
autoFit: 'center',
data: {
nodes: [
{ id: 'node1', combo: 'combo1' },
{ id: 'node2', combo: 'combo1' },
],
combos: [{ id: 'combo1', style: { collapsed: true } }],
},
combo: {
style: {
collapsedMarkerFill: '#1783FF',
collapsedMarkerFontSize: 30,
},
},
});
graph.render();
```
### Label Style
Labels are used to display text information for combos, supporting rich text style configuration and flexible position layout.
#### Basic Label Configuration
Add basic text label to combo:
```js | ob { inject: true }
import { Graph } from '@antv/g6';
const graph = new Graph({
container: 'container',
width: 240,
height: 100,
autoFit: 'center',
data: {
nodes: [{ id: 'node1', combo: 'combo1' }],
combos: [{ id: 'combo1' }],
},
combo: {
style: {
labelText: 'Sales Department', // Label text content
labelFill: '#1A1A1A', // Label text color
labelFontSize: 14, // Label font size
labelPlacement: 'bottom', // Label position: bottom
},
},
});
graph.render();
```
#### Multi-line Text Label
Configure labels that support multi-line display:
```js | ob { inject: true }
import { Graph } from '@antv/g6';
const graph = new Graph({
container: 'container',
width: 240,
height: 120,
autoFit: 'center',
data: {
nodes: [{ id: 'node1', combo: 'combo1' }],
combos: [{ id: 'combo1' }],
},
combo: {
style: {
labelText: 'This is a combo label text content that supports multi-line display',
labelWordWrap: true, // Enable text wrapping
labelMaxWidth: 100, // Maximum width 100px
labelMaxLines: 3, // Maximum 3 lines
labelTextAlign: 'center', // Center text alignment
labelFontSize: 12,
},
},
});
graph.render();
```
#### Custom Style Label
Create labels with special styles:
```js | ob { inject: true }
import { Graph } from '@antv/g6';
const graph = new Graph({
container: 'container',
width: 240,
height: 100,
autoFit: 'center',
data: {
nodes: [{ id: 'node1', combo: 'combo1' }],
combos: [{ id: 'combo1' }],
},
combo: {
style: {
labelText: 'IMPORTANT',
labelFill: '#FF4D4F', // Red text
labelFontSize: 16,
labelFontWeight: 'bold', // Bold
labelFontStyle: 'italic', // Italic
labelTextDecorationLine: 'underline', // Underline
labelLetterSpacing: 2, // Letter spacing
labelPlacement: 'top',
},
},
});
graph.render();
```
Here are the complete label style configurations:
| Property | Description | Type | Default | Required |
| ------------------------ | -------------------------------------------------------------------------------------------------------------------------------------------------------------------------- | --------------------------------------------------------------------------- | --------- | -------- |
| label | Whether to show combo label | boolean | true | |
| labelCursor | Cursor style when hovering over combo label, [options](#cursor) | string | `default` | |
| labelFill | Combo label text color | string | #000 | |
| labelFillOpacity | Combo label text color opacity | number | 1 | |
| labelFontFamily | Combo label font family | string | - | |
| labelFontSize | Combo label font size | number | 12 | |
| labelFontStyle | Combo label font style | `normal` \| `italic` \| `oblique` | - | |
| labelFontVariant | Combo label font variant | `normal` \| `small-caps` \| string | - | |
| labelFontWeight | Combo label font weight | `normal` \| `bold` \| `bolder` \| `lighter` \| number | 400 | |
| labelLeading | Line spacing | number | 0 | |
| labelLetterSpacing | Combo label letter spacing | number \| string | - | |
| labelLineHeight | Combo label line height | number \| string | - | |
| labelMaxLines | Combo label maximum lines | number | 1 | |
| labelMaxWidth | Combo label maximum width, [options](#labelmaxwidth) | number \| string | `200%` | |
| labelOffsetX | Combo label X offset | number | 0 | |
| labelOffsetY | Combo label Y offset | number | 0 | |
| labelPadding | Combo label padding | number \| number[] | 0 | |
| labelPlacement | Combo label position relative to combo main graphic, [options](#labelplacement) | string | `bottom` | |
| labelText | Combo label text content | string | - | |
| labelTextAlign | Combo label text horizontal alignment | `start` \| `center` \| `middle` \| `end` \| `left` \| `right` | `left` | |
| labelTextBaseline | Combo label text baseline | `top` \| `hanging` \| `middle` \| `alphabetic` \| `ideographic` \| `bottom` | - | |
| labelTextDecorationColor | Combo label text decoration color | string | - | |
| labelTextDecorationLine | Combo label text decoration line | string | - | |
| labelTextDecorationStyle | Combo label text decoration style | `solid` \| `double` \| `dotted` \| `dashed` \| `wavy` | - | |
| labelTextOverflow | Combo label text overflow handling | `clip` \| `ellipsis` \| string | - | |
| labelTextPath | Combo label text path | Path | - | |
| labelWordWrap | Whether combo label enables auto line wrapping. When labelWordWrap is enabled, parts exceeding labelMaxWidth automatically wrap | boolean | false | |
| labelZIndex | Combo label rendering layer | number | 0 | |
| `label{StyleProps}` | More label style configurations, refer to [TextStyleProps](https://g.antv.antgroup.com/api/basic/text) property values. For example, labelOpacity represents label opacity | [TextStyleProps](https://g.antv.antgroup.com/api/basic/text) | - | |
#### LabelPlacement
Label position relative to combo main graphic, available values:
- `center`: Label at combo center
- `top`, `bottom`, `left`, `right`: Label at top, bottom, left, right of combo
- `top-left`, `top-right`, `bottom-left`, `bottom-right`: Label at four corners of combo
- `left-top`, `left-bottom`, `right-top`, `right-bottom`: Label at edge endpoints of combo
#### LabelMaxWidth
When auto line wrapping `labelWordWrap` is enabled, text wraps when exceeding this width:
- string: Defines maximum width as percentage relative to combo element width. For example, `50%` means label width doesn't exceed half of combo width
- number: Defines maximum width in pixels. For example, 100 means label maximum width is 100 pixels
For example, setting multi-line label text:
```json
{
"labelWordWrap": true,
"labelMaxWidth": 200,
"labelMaxLines": 3
}
```
### Label Background Style
Label background provides background decoration for label text, improving label readability and visual effects.
#### Basic Background Style
Add simple background to label:
```js | ob { inject: true }
import { Graph } from '@antv/g6';
const graph = new Graph({
container: 'container',
width: 240,
height: 100,
autoFit: 'center',
data: {
nodes: [{ id: 'node1', combo: 'combo1' }],
combos: [{ id: 'combo1' }],
},
combo: {
style: {
labelText: 'Important Combo',
labelFill: '#fff', // White text
labelBackground: true, // Enable background
labelBackgroundFill: '#1783FF', // Blue background
labelBackgroundPadding: [4, 8], // Padding: vertical 4px, horizontal 8px
labelBackgroundRadius: 4, // Border radius
},
},
});
graph.render();
```
#### Gradient Background Effect
Create label background with gradient effect:
```js | ob { inject: true }
import { Graph } from '@antv/g6';
const graph = new Graph({
container: 'container',
width: 240,
height: 100,
autoFit: 'center',
data: {
nodes: [{ id: 'node1', combo: 'combo1' }],
combos: [{ id: 'combo1' }],
},
combo: {
style: {
labelText: 'VIP Combo',
labelFill: '#fff',
labelFontWeight: 'bold',
labelBackground: true,
labelBackgroundFill: 'linear-gradient(45deg, #FF6B6B, #4ECDC4)', // Gradient background
labelBackgroundPadding: [6, 12],
labelBackgroundRadius: 20, // Large border radius
labelBackgroundShadowColor: 'rgba(0,0,0,0.2)',
labelBackgroundShadowBlur: 4,
labelBackgroundShadowOffsetY: 2,
},
},
});
graph.render();
```
#### Stroke-only Background Style
Create label background with stroke only:
```js | ob { inject: true }
import { Graph } from '@antv/g6';
const graph = new Graph({
container: 'container',
width: 240,
height: 100,
autoFit: 'center',
data: {
nodes: [{ id: 'node1', combo: 'combo1' }],
combos: [{ id: 'combo1' }],
},
combo: {
style: {
labelText: 'Border Label',
labelFill: '#1783FF',
labelBackground: true,
labelBackgroundFill: 'transparent', // Transparent background
labelBackgroundStroke: '#1783FF', // Blue stroke
labelBackgroundLineWidth: 2, // Stroke width
labelBackgroundPadding: [4, 8],
labelBackgroundRadius: 8,
},
},
});
graph.render();
```
Here are the complete label background style configurations:
| Property | Description | Type | Default |
| ----------------------------- | ---------------------------------------------------------------------------------------------------------------------------------------------------------------------------------------------------------- | ------------------------------------------------------------ | ------------ |
| labelBackground | Whether to show combo label background | boolean | false |
| labelBackgroundCursor | Combo label background cursor style, [options](#cursor) | string | `default` |
| labelBackgroundFill | Combo label background fill color | string | #000 |
| labelBackgroundFillOpacity | Combo label background opacity | number | 0.75 |
| labelBackgroundHeight | Combo label background height | string \| number | - |
| labelBackgroundLineDash | Combo label background dash configuration | number \| string \|(number \| string )[] | - |
| labelBackgroundLineDashOffset | Combo label background dash offset | number | - |
| labelBackgroundLineWidth | Combo label background stroke line width | number | - |
| labelBackgroundPadding | Combo label background padding | number \| number[] | [2, 4, 2, 4] |
| labelBackgroundRadius | Combo label background border radius <br> - number: Set all four corner radius uniformly <br> - number[]: Set four corner radius separately, missing values auto-filled | number \| number[] | 0 |
| labelBackgroundShadowBlur | Combo label background shadow blur | number | - |
| labelBackgroundShadowColor | Combo label background shadow color | string | - |
| labelBackgroundShadowOffsetX | Combo label background shadow X offset | number | - |
| labelBackgroundShadowOffsetY | Combo label background shadow Y offset | number | - |
| labelBackgroundStroke | Combo label background stroke color | string | - |
| labelBackgroundStrokeOpacity | Combo label background stroke opacity | number \| string | 1 |
| labelBackgroundVisibility | Whether combo label background is visible | `visible` \| `hidden` | - |
| labelBackgroundZIndex | Combo label background rendering layer | number | 1 |
| `labelBackground{StyleProps}` | More label background style configurations, refer to [RectStyleProps](https://g.antv.antgroup.com/api/basic/rect) property values. For example, labelBackgroundOpacity represents label background opacity | [RectStyleProps](https://g.antv.antgroup.com/api/basic/rect) | - |
### Badge Style
Badges are small markers displayed on combos, usually used to show status, quantity, or other auxiliary information. Multiple badges can be displayed simultaneously with customizable positions.
#### Single Badge
Add a simple badge to the combo:
```js | ob { inject: true }
import { Graph } from '@antv/g6';
const graph = new Graph({
container: 'container',
width: 200,
height: 100,
autoFit: 'center',
data: {
nodes: [{ id: 'node1', combo: 'combo1' }],
combos: [{ id: 'combo1' }],
},
combo: {
style: {
badges: [
{ text: 'NEW' }, // Display at top by default
],
},
},
});
graph.render();
```
#### Multiple Badges
Add multiple badges at different positions to the combo:
```js | ob { inject: true }
import { Graph } from '@antv/g6';
const graph = new Graph({
container: 'container',
width: 200,
height: 100,
autoFit: 'center',
data: {
nodes: [{ id: 'node1', combo: 'combo1' }],
combos: [{ id: 'combo1' }],
},
combo: {
style: {
badge: true, // Whether to show badges
badges: [
{ text: 'A', placement: 'right-top' },
{ text: 'Important', placement: 'right' },
{ text: 'Notice', placement: 'right-bottom' },
],
badgePalette: ['#7E92B5', '#F4664A', '#FFBE3A'], // Badge background palette
badgeFontSize: 7, // Badge font size
},
},
});
graph.render();
```
#### Custom Badge Style
Fully customize badge appearance:
```js | ob { inject: true }
import { Graph } from '@antv/g6';
const graph = new Graph({
container: 'container',
width: 200,
height: 100,
autoFit: 'center',
data: {
nodes: [{ id: 'node1', combo: 'combo1' }],
combos: [{ id: 'combo1' }],
},
combo: {
style: {
badges: [
{
text: '99+',
placement: 'right-top',
backgroundFill: '#FF4D4F', // Red background
fill: '#fff', // White text
fontSize: 10,
padding: [2, 6],
backgroundRadius: 8,
},
],
},
},
});
graph.render();
```
Here are the complete badge style configurations:
| Property | Description | Type | Default |
| ------------ | ------------------------------ | ------------------------------------- | --------------------------------- |
| badge | Whether to show combo badge | boolean | true |
| badgePalette | Combo badge background palette | string[] | [`#7E92B5`, `#F4664A`, `#FFBE3A`] |
| badges | Combo badge settings | [BadgeStyleProps](#badgestyleprops)[] | - |
#### BadgeStyleProps
| Property | Description | Type | Default |
| ------------------------ | ------------------------------------------------------------------------------------------------------------------------------------------------------------------------------------------------------------------------------------------------------------------------------------------------------ | ---------------------------------------------------------------------------------------------------------------------------------------------------------------------- | ------------ |
| background | Whether to show combo badge background | boolean | true |
| backgroundCursor | Combo badge background cursor style, [options](#cursor) | string | `default` |
| backgroundFill | Combo badge background fill color. If not specified, consider badgePalette for sequential allocation | string | - |
| backgroundFillOpacity | Combo badge background fill opacity | number | 1 |
| backgroundFilter | Combo badge background filter | string | - |
| backgroundHeight | Combo badge background height | number \| string | - |
| backgroundLineDash | Combo badge background dash configuration | number \| string \|(number \| string )[] | - |
| backgroundLineDashOffset | Combo badge background dash offset | number | - |
| backgroundLineWidth | Combo badge background stroke line width | number | - |
| backgroundRadius | Combo badge background border radius <br> - number: Set all four corner radius uniformly <br> - number[]: Set four corner radius separately, missing values will be filled <br> - string: Similar to [CSS padding](https://developer.mozilla.org/en-US/docs/Web/CSS/padding) property, space-separated | number \| number[] \| string | 0 |
| backgroundShadowBlur | Combo badge background shadow blur | number | - |
| backgroundShadowColor | Combo badge background shadow color | string | - |
| backgroundShadowOffsetX | Combo badge background shadow X offset | number | - |
| backgroundShadowOffsetY | Combo badge background shadow Y offset | number | - |
| backgroundStroke | Combo badge background stroke color | string | - |
| backgroundStrokeOpacity | Combo badge background stroke opacity | number \| string | 1 |
| backgroundVisibility | Whether combo badge background is visible | `visible` \| `hidden` | - |
| fill | Combo badge text color | string | - |
| fontFamily | Combo badge font family | string | - |
| fontSize | Combo badge font size | number | 8 |
| fontStyle | Combo badge font style | `normal` \| `italic` \| `oblique` | `normal` |
| fontVariant | Combo badge font variant | `normal` \| `small-caps` \| string | `normal` |
| fontWeight | Combo badge font weight | number \| string | `normal` |
| lineHeight | Combo badge line height | string \| number | - |
| lineWidth | Combo badge line width | string \| number | - |
| maxLines | Combo badge text maximum lines | number | 1 |
| offsetX | Combo badge X offset | number | 0 |
| offsetY | Combo badge Y offset | number | 0 |
| padding | Combo badge padding | number \| number[] | 0 |
| placement | Combo badge position relative to combo main graphic. If not specified, defaults to clockwise placement starting from top-right | `left` \| `right` \| `top` \| `bottom` \| `left-top` \| `left-bottom` \| `right-top` \| `right-bottom` \| `top-left` \| `top-right` \| `bottom-left` \| `bottom-right` | - |
| text | Combo badge text content | string | - |
| textAlign | Combo badge text horizontal alignment | `start` \| `center` \| `middle` \| `end` \| `left` \| `right` | `left` |
| textBaseline | Combo badge text baseline | `top` \| `hanging` \| `middle` \| `alphabetic` \| `ideographic` \| `bottom` | `alphabetic` |
| textDecorationColor | Combo badge text decoration color | string | - |
| textDecorationLine | Combo badge text decoration line | string | - |
| textDecorationStyle | Combo badge text decoration style | `solid` \| `double` \| `dotted` \| `dashed` \| `wavy` | `solid` |
| textOverflow | Combo badge text overflow handling | `clip` \| `ellipsis` \| string | `clip` |
| visibility | Whether combo badge is visible | `visible` \| `hidden` | - |
| wordWrap | Whether combo badge text auto-wraps | boolean | - |
| zIndex | Combo badge rendering layer | number | 3 |
### Halo Style
Halo effect is used to highlight combos, usually used in mouse hover, selected, or active states, adding glow effect around combos.
#### Basic Halo Effect
Add simple halo effect to combo:
```js | ob { inject: true }
import { Graph } from '@antv/g6';
const graph = new Graph({
container: 'container',
width: 240,
height: 100,
autoFit: 'center',
data: {
nodes: [{ id: 'node1', combo: 'combo1' }],
combos: [{ id: 'combo1' }],
},
combo: {
style: {
halo: true, // Enable halo
haloStroke: '#1783FF', // Blue halo
haloLineWidth: 8, // Halo width
haloStrokeOpacity: 0.3, // Halo opacity
},
},
});
graph.render();
```
#### Colorful Halo Effect
Create colorful gradient halo effect:
```js | ob { inject: true }
import { Graph } from '@antv/g6';
const graph = new Graph({
container: 'container',
width: 240,
height: 100,
autoFit: 'center',
data: {
nodes: [{ id: 'node1', combo: 'combo1' }],
combos: [{ id: 'combo1' }],
},
combo: {
style: {
halo: true,
haloStroke: '#FF4D4F', // Red halo
haloLineWidth: 12, // Thicker halo
haloStrokeOpacity: 0.5,
haloFilter: 'blur(2px)', // Blur filter effect
},
},
});
graph.render();
```
#### Dynamic Halo Effect
Use halo effect in state transitions:
```js | ob { inject: true }
import { Graph } from '@antv/g6';
const graph = new Graph({
container: 'container',
width: 240,
height: 100,
autoFit: 'center',
data: {
nodes: [{ id: 'node1', combo: 'combo1' }],
combos: [{ id: 'combo1' }],
},
combo: {
style: {
// No halo in default state
halo: false,
},
state: {
// Show orange halo in hover state
hover: {
halo: true,
haloStroke: '#FF7A00',
haloLineWidth: 10,
haloStrokeOpacity: 0.4,
},
// Show green halo in selected state
selected: {
halo: true,
haloStroke: '#52C41A',
haloLineWidth: 6,
haloStrokeOpacity: 0.6,
},
},
},
});
graph.render();
```
Here are the complete halo style configurations:
| Property | Description | Type | Default | Required |
| ------------------ | --------------------------------------------------------------------------------------------------------------------------------------------------------------------------------- | --------------------------------------------------------------------- | ------------------------------- | -------- |
| halo | Whether to show combo halo | boolean | false | |
| haloCursor | Combo halo cursor style, [options](#cursor) | string | `default` | |
| haloDraggable | Whether combo halo allows dragging | boolean | true | |
| haloDroppable | Whether combo halo allows receiving dragged elements | boolean | false | |
| haloFill | Halo fill color | string | Same as main graphic fill color | |
| haloFillRule | Combo halo fill rule | `nonzero` \| `evenodd` | - | |
| haloFilter | Combo halo filter effect, such as 'blur(2px)' for blur effect | string | - | |
| haloLineWidth | Combo halo stroke width, controls halo thickness | number | 12 | |
| haloPointerEvents | Whether combo halo effect responds to pointer events, [options](#pointerevents) | string | `none` | |
| haloStroke | Combo halo stroke color, **this property is used to set the color of halo around combo, helping to highlight the combo** | string | `#99add1` | |
| haloStrokeOpacity | Combo halo stroke opacity, recommended to use 0.2-0.6 values for natural halo effect | number | 0.25 | |
| haloVisibility | Combo halo visibility | `visible` \| `hidden` | `visible` | |
| haloZIndex | Combo halo rendering layer, usually set to negative value to ensure halo is below combo main graphic | number | -1 | |
| `halo{StyleProps}` | More halo style configurations, refer to [DisplayObject](https://g.antv.antgroup.com/api/basic/display-object) options. For example, haloFillOpacity represents halo fill opacity | [DisplayObject](https://g.antv.antgroup.com/api/basic/display-object) | - | |
**Halo Usage Recommendations:**
1. **Performance Consideration**: Halo effects increase rendering burden, recommend enabling only when necessary
2. **Color Matching**: Halo color should coordinate with combo main color tone, avoid being too abrupt
3. **Opacity Setting**: Reasonable opacity (0.2-0.6) can create natural halo effect
4. **State Application**: Halo is usually used for hover, selected, active and other interactive states
### Icon Style
Icons are used to display text or image content in combos, usually located at the center of the combo, can be used to represent combo type or function.
#### Text Icon
Use text as combo icon:
```js | ob { inject: true }
import { Graph } from '@antv/g6';
const graph = new Graph({
container: 'container',
width: 240,
height: 100,
autoFit: 'center',
data: {
combos: [{ id: 'combo1' }],
},
combo: {
style: {
iconText: 'A', // Display letter A
iconFill: '#1783FF', // Blue text
iconFontSize: 24, // Large font
iconFontWeight: 'bold', // Bold
},
},
});
graph.render();
```
#### Image Icon
Use image as combo icon:
```js | ob { inject: true }
import { Graph } from '@antv/g6';
const graph = new Graph({
container: 'container',
width: 240,
height: 100,
autoFit: 'center',
data: {
combos: [{ id: 'combo1' }],
},
combo: {
style: {
fill: '#1890FF',
iconSrc: 'https://gw.alipayobjects.com/zos/basement_prod/012bcf4f-423b-4922-8c24-32a89f8c41ce.svg',
iconWidth: 32,
iconHeight: 32,
},
},
});
graph.render();
```
#### Colorful Text Icon
Create text icon with special styles:
```js | ob { inject: true }
import { Graph } from '@antv/g6';
const graph = new Graph({
container: 'container',
width: 240,
height: 100,
autoFit: 'center',
data: {
combos: [{ id: 'combo1' }],
},
combo: {
style: {
iconText: 'Dept',
iconFill: '#FF4D4F', // Red text
iconFontSize: 16,
iconFontWeight: 'bold',
iconFontStyle: 'italic', // Italic
iconTextDecorationLine: 'underline', // Underline
iconLetterSpacing: 1, // Letter spacing
},
},
});
graph.render();
```
Here are the complete icon style configurations:
| Property | Description | Type | Default |
| ----------------------- | ------------------------------------------------------------------------------------------------------------------------- | --------------------------------------------------------------------------- | --------------------------- |
| icon | Whether to show combo icon | boolean | true |
| iconCursor | Combo icon cursor style, [options](#cursor) | string | `default` |
| iconFill | Combo icon text color | string | - |
| iconFillOpacity | Combo icon text color opacity | number | 1 |
| iconFontFamily | Combo icon font family | string | - |
| iconFontSize | Combo icon font size | number | 16 |
| iconFontStyle | Combo icon font style | `normal` \| `italic` \| `oblique` | `normal` |
| iconFontVariant | Combo icon font variant | `normal` \| `small-caps` \| string | `normal` |
| iconFontWeight | Combo icon font weight | number \| string | `normal` |
| iconHeight | Combo icon height, used to control image size when using image icon | number | Half of main graphic height |
| iconLetterSpacing | Combo icon text letter spacing | number \| string | - |
| iconLineHeight | Combo icon text line height | number \| string | - |
| iconMaxLines | Combo icon text maximum lines | number | 1 |
| iconOffsetX | Combo icon X offset | number | 0 |
| iconOffsetY | Combo icon Y offset | number | 0 |
| iconOpacity | Combo icon opacity | number | 1 |
| iconRadius | Combo icon border radius (only effective for rectangular icons) | number | 0 |
| iconSrc | Combo image source. Has higher priority than iconText, supports local and network images | string | - |
| iconText | Combo icon text content, supports text, Unicode characters, etc. | string | - |
| iconTextAlign | Combo icon text horizontal alignment | `start` \| `center` \| `middle` \| `end` \| `left` \| `right` | `center` |
| iconTextBaseline | Combo icon text baseline | `top` \| `hanging` \| `middle` \| `alphabetic` \| `ideographic` \| `bottom` | `middle` |
| iconTextDecorationColor | Combo icon text decoration color | string | - |
| iconTextDecorationLine | Combo icon text decoration line, such as underline, strikethrough, etc. | string | - |
| iconTextDecorationStyle | Combo icon text decoration style | `solid` \| `double` \| `dotted` \| `dashed` \| `wavy` | `solid` |
| iconTextOverflow | Combo icon text overflow handling | `clip` \| `ellipsis` \| string | `clip` |
| iconVisibility | Whether combo icon is visible | `visible` \| `hidden` | `visible` |
| iconWidth | Combo icon width, used to control image size when using image icon | number | Half of main graphic width |
| iconWordWrap | Whether combo icon text auto-wraps | boolean | false |
| iconZIndex | Combo icon rendering layer | number | 1 |
| `icon{StyleProps}` | More icon style configurations, refer to specific icon type options. For example, iconStroke represents icon stroke color | - | - |
**Icon Usage Recommendations:**
1. **Priority**: `iconSrc` (image) has higher priority than `iconText` (text), if both are set, image will be displayed first
2. **Size Control**: Recommend setting icon size reasonably according to combo size, avoid icons being too large or small affecting visual effect
3. **Performance Optimization**: Text icons have better performance, image icons require additional network requests and rendering overhead
4. **Style Consistency**: Icon styles in the same graph should be consistent to improve overall visual effect
5. **Accessibility**: Ensure icon color has sufficient contrast with background for easy user identification
## State
In some interactive behaviors, such as clicking to select a combo or hovering to activate an edge, it is merely marking certain states on the element. To reflect these states in the visual space seen by the end user, we need to set different graphic element styles for different states to respond to changes in the element's state.
G6 provides several built-in states, including selected, highlight, active, inactive, and disabled. In addition, it also supports custom states to meet more specific needs. For each state, developers can define a set of style rules that will override the default styles of the element.
<img width="520" src="https://mdn.alipayobjects.com/huamei_qa8qxu/afts/img/A*Iv_dS5XR2TcAAAAAAAAAAAAADmJ7AQ/original" />
The data structure is as follows:
```typescript
type ComboState = {
[state: string]: ComboStyle;
};
```
For example, when the combo is in the `focus` state, you can add a stroke with a width of 3 and a color of orange.
```js {4-7}
const graph = new Graph({
combo: {
state: {
focus: {
lineWidth: 3, // Stroke width
stroke: 'orange', // Stroke color
},
},
},
});
```
The effect is as follows:
```js | ob { pin: false, inject: true }
import { Graph } from '@antv/g6';
const graph = new Graph({
container: 'container',
width: 200,
height: 100,
autoFit: 'center',
data: {
nodes: [{ id: 'node1', combo: 'combo1' }],
combos: [{ id: 'combo1', states: ['focus'] }],
},
combo: {
state: {
focus: {
lineWidth: 3,
stroke: 'orange',
fill: 'orange',
fillOpacity: 0.2,
},
},
},
});
graph.render();
```
**⚠️ Dynamic Configuration**: State configuration also supports dynamic configuration, which can be used to set styles dynamically based on combo data:
```js
const graph = new Graph({
combo: {
state: {
// Static configuration
selected: {
stroke: '#1783FF',
lineWidth: 2,
},
// Dynamic configuration - arrow function form
hover: (datum) => ({
fill: datum.data.isVIP ? '#FFD700' : '#1783FF',
fillOpacity: 0.3,
}),
// Dynamic configuration - regular function form (access to graph instance)
active: function (datum) {
console.log(this); // graph instance
return {
stroke: datum.data.level > 3 ? '#FF4D4F' : '#52C41A',
lineWidth: 3,
};
},
},
},
});
```
**⚠️ State Priority**: When a combo has multiple states simultaneously, the style merge follows the following priority (high to low):
1. Later defined states override earlier defined states
2. More specific selectors have higher priority
3. Dynamic configuration has higher priority than static configuration
For example, if a combo has both `selected` and `hover` states, and `hover` is defined after `selected`, then `hover` state styles will override `selected` state styles.
## Animation
Defines the animation effects for combos, supporting the following two configuration methods:
1. Disable all combo animations
```json
{
"combo": {
"animation": false
}
}
```
2. Configure stage animations
Stage animations refer to animation effects when combos enter the canvas, update, or leave the canvas. Currently supported stages include:
- `enter`: Animation when combo enters the canvas
- `update`: Animation when combo updates
- `exit`: Animation when combo leaves the canvas
- `show`: Animation when combo shows from hidden state
- `hide`: Animation when combo hides
- `collapse`: Animation when combo collapses
- `expand`: Animation when combo expands
You can refer to [Animation Paradigm](/en/manual/animation/animation#animation-paradigm) to use animation syntax to configure combos, such as:
#### Enter Animation
Configure animation when combo enters the canvas:
```js | ob { inject: true }
import { Graph } from '@antv/g6';
const graph = new Graph({
container: 'container',
width: 200,
height: 100,
autoFit: 'center',
data: {
nodes: [{ id: 'node1', combo: 'combo1' }],
combos: [{ id: 'combo1' }],
},
combo: {
animation: {
enter: [
{
fields: ['opacity'], // Animate opacity property
from: 0, // Start from 0
to: 1, // End at 1
duration: 1000, // Animation duration
easing: 'ease-out', // Easing function
},
],
},
},
});
graph.render();
```
#### Update Animation
Configure animation when combo updates:
```js
const graph = new Graph({
combo: {
animation: {
update: [
{
fields: ['x', 'y'], // Only animate x and y properties during update
duration: 1000, // Animation duration
easing: 'linear', // Easing function
},
],
},
},
});
```
#### Exit Animation
Configure animation when combo leaves the canvas:
```js
const graph = new Graph({
combo: {
animation: {
exit: [
{
fields: ['opacity'], // Animate opacity property
to: 0, // End at 0
duration: 500, // Animation duration
easing: 'ease-in', // Easing function
},
],
},
},
});
```
#### Show/Hide Animation
Configure animation when combo shows/hides:
```js
const graph = new Graph({
combo: {
animation: {
show: [
{
fields: ['opacity'],
from: 0,
to: 1,
duration: 300,
},
],
hide: [
{
fields: ['opacity'],
to: 0,
duration: 300,
},
],
},
},
});
```
You can also use built-in animation effects:
```json
{
"combo": {
"animation": {
"enter": "fade", // Use fade animation
"update": "translate", // Use translate animation
"exit": "fade" // Use fade animation
}
}
}
```
You can pass `false` to disable specific stage animations:
```json
{
"combo": {
"animation": {
"enter": false // Disable combo enter animation
}
}
}
```
**Animation Configuration Options:**
| Property | Description | Type | Default |
| --------- | --------------------------------------- | ----------------------------------------------------------- | -------- |
| fields | Properties to animate | string[] | - |
| from | Starting value | number \| string | - |
| to | Ending value | number \| string | - |
| duration | Animation duration (milliseconds) | number | 1000 |
| easing | Easing function | string | 'ease' |
| delay | Animation delay (milliseconds) | number | 0 |
| repeat | Number of repetitions (-1 for infinite) | number | 0 |
| direction | Animation direction | 'normal' \| 'reverse' \| 'alternate' \| 'alternate-reverse' | 'normal' |
## Palette
Defines combo color palette, i.e., predefined combo color pool, and allocates according to rules, mapping colors to the `fill` property.
> For palette definition, please refer to [Palette](/en/manual/theme/palette).
| Property | Description | Type | Default |
| -------- | -------------------------------------------------------------------------------------------------------------------- | --------------------------------- | ------- |
| type | Specifies current palette type. <br> - `group`: Discrete palette <br> - `value`: Continuous palette | `group` | `value` | `group` |
| field | Specifies grouping field in element data. If not specified, defaults to id as grouping field | string | ((datum) => string) | `id` |
| color | Palette colors. If palette is registered, you can directly specify its registration name, also accepts a color array | string | string[] | - |
| invert | Whether to invert the palette | boolean | false |
For example, assign combo colors to a group of data by `category` field, so that combos of the same category have the same color:
```json
{
"combo": {
"palette": {
"type": "group",
"field": "category",
"color": ["#1783FF", "#F08F56", "#D580FF", "#00C9C9", "#7863FF"]
}
}
}
```
The effect is as follows:
```js | ob { pin: false, inject: true }
import { Graph } from '@antv/g6';
const graph = new Graph({
container: 'container',
width: 600,
height: 100,
data: {
combos: new Array(8)
.fill(0)
.map((_, i) => ({ id: `combo-${i}`, data: { category: ['A', 'B', 'C', 'D', 'E'][i % 5] } })),
},
layout: { type: 'grid', cols: 8 },
combo: {
style: { fillOpacity: 0.4 },
palette: {
type: 'group',
field: 'category',
color: ['#1783FF', '#F08F56', '#D580FF', '#00C9C9', '#7863FF'],
},
},
});
graph.render();
```
You can also use default configuration:
```json
{
"combo": {
"palette": "tableau" // tableau is palette name, defaults to assign colors by ID
}
}
```
The effect is as follows:
```js | ob { pin: false, inject: true }
import { Graph } from '@antv/g6';
const graph = new Graph({
container: 'container',
width: 600,
height: 100,
data: {
combos: new Array(8)
.fill(0)
.map((_, i) => ({ id: `combo-${i}`, data: { category: ['A', 'B', 'C', 'D', 'E'][i % 5] } })),
},
layout: { type: 'grid', cols: 8 },
combo: {
style: { fillOpacity: 0.4 },
palette: 'tableau',
},
});
graph.render();
```
Combo Skill
packages/site/docs/manual/element/combo/BaseCombo.zh.md anthropic-skill ~19,736 tokens---
title: 组合通用配置项
order: 1
---
本文介绍内置组合通用属性配置。
## ComboOptions
```js {5-9}
import { Graph } from '@antv/g6';
const graph = new Graph({
combo: {
type: 'circle', // 组合类型
style: {}, // 组合样式
state: {}, // 状态样式
palette: {}, // 色板配置
animation: {}, // 动画配置
},
});
```
| 属性 | 描述 | 类型 | 默认值 | 必选 |
| --------- | -------------------------------------------- | ----------------------- | -------- | ---- |
| type | 组合类型,内置组合类型名称或自定义组合的名称 | [Type](#type) | `circle` | |
| style | 组合样式配置,包括颜色、大小等 | [Style](#style) | - | |
| state | 不同状态下的样式配置 | [State](#state) | - | |
| palette | 定义组合的色板,用于根据不同数据映射颜色 | [Palette](#palette) | - | |
| animation | 定义组合的动画效果 | [Animation](#animation) | - | |
## Type
指定组合类型,内置组合类型名称或自定义组合的名称。默认为 `circle`(圆形)。**⚠️ 注意**:这里决定了主图形的形状。
```js {3}
const graph = new Graph({
combo: {
type: 'circle',
},
});
```
**⚠️ 动态配置说明**:`type` 属性同样支持动态配置,可以根据组合数据动态选择组合类型:
```js
const graph = new Graph({
combo: {
// 静态配置
type: 'circle',
// 动态配置 - 箭头函数形式
type: (datum) => datum.data.comboType || 'circle',
// 动态配置 - 普通函数形式(可访问 graph 实例)
type: function (datum) {
console.log(this); // graph 实例
return datum.data.category === 'important' ? 'rect' : 'circle';
},
},
});
```
可选值有:
- `circle`:[圆形组合](/manual/element/combo/circle)
- `rect`:[矩形组合](/manual/element/combo/rect)
## Style
定义组合的样式,包括颜色、大小等。
```js {3}
const graph = new Graph({
combo: {
style: {},
},
});
```
**⚠️ 动态配置说明**:以下所有样式属性都支持动态配置,即可以传入函数来根据组合数据动态计算属性值:
```js
const graph = new Graph({
combo: {
style: {
// 静态配置
fill: '#1783FF',
// 动态配置 - 箭头函数形式
stroke: (datum) => (datum.data.isActive ? '#FF0000' : '#000000'),
// 动态配置 - 普通函数形式(可访问 graph 实例)
lineWidth: function (datum) {
console.log(this); // graph 实例
return datum.data.importance > 5 ? 3 : 1;
},
// 嵌套属性也支持动态配置
labelText: (datum) => `组合: ${datum.id}`,
badges: (datum) => datum.data.tags.map((tag) => ({ text: tag })),
},
},
});
```
其中 `datum` 参数为组合数据对象 (`ComboData`),包含组合的所有数据信息。
一个完整的组合由以下几部分构成:
<img width="240" src="https://mdn.alipayobjects.com/huamei_qa8qxu/afts/img/A*z-OxR4MAdUwAAAAAAAAAAAAADmJ7AQ/original" />
- `key` :组合的主图形,表示组合的主要形状,例如圆形、矩形等;
- `label` :文本标签,通常用于展示组合的名称或描述;
- `halo` :主图形周围展示的光晕效果的图形;
- `badge` :默认位于组合右上角的徽标;
以下样式配置将按原子图形依次说明:
### 主图形样式
主图形是组合的核心部分,定义了组合的基本形状和外观。以下是常见的配置场景:
#### 基础样式配置
设置组合的基本外观:
```js | ob { inject: true }
import { Graph } from '@antv/g6';
const graph = new Graph({
container: 'container',
width: 200,
height: 100,
autoFit: 'center',
data: {
nodes: [{ id: 'node1', combo: 'combo1' }],
combos: [{ id: 'combo1' }],
},
combo: {
style: {
fill: '#5B8FF9', // 蓝色填充
stroke: '#1A1A1A', // 深色描边
lineWidth: 2,
fillOpacity: 0.2,
},
},
});
graph.render();
```
#### 透明度和阴影效果
为组合添加透明度和阴影效果:
```js | ob { inject: true }
import { Graph } from '@antv/g6';
const graph = new Graph({
container: 'container',
width: 200,
height: 100,
autoFit: 'center',
data: {
nodes: [{ id: 'node1', combo: 'combo1' }],
combos: [{ id: 'combo1' }],
},
combo: {
style: {
fill: '#61DDAA',
fillOpacity: 0.15,
shadowColor: 'rgba(97, 221, 170, 0.4)',
shadowBlur: 12,
shadowOffsetX: 2,
shadowOffsetY: 4,
stroke: '#F0F0F0',
lineWidth: 1,
},
},
});
graph.render();
```
#### 虚线边框样式
创建带虚线边框的组合:
```js | ob { inject: true }
import { Graph } from '@antv/g6';
const graph = new Graph({
container: 'container',
width: 200,
height: 100,
autoFit: 'center',
data: {
nodes: [{ id: 'node1', combo: 'combo1' }],
combos: [{ id: 'combo1' }],
},
combo: {
style: {
fill: '#FFF1F0',
fillOpacity: 0.1,
stroke: '#F5222D',
lineWidth: 2,
lineDash: [6, 4],
lineCap: 'round',
},
},
});
graph.render();
```
以下为完整的主图形样式配置:
| 属性 | 描述 | 类型 | 默认值 | 必选 |
| ------------------------------- | ----------------------------------------------------------------------------------------- | ----------------------------- | --------- | ---- |
| collapsed | 当前组合是否折叠 | boolean | false | |
| cursor | 组合鼠标移入样式,[配置项](#cursor) | string | default | |
| fill | 组合填充色 | string | `#99ADD1` | |
| fillOpacity | 组合填充色透明度 | number \| string | 0.04 | |
| increasedLineWidthForHitTesting | 当 lineWidth 较小时,可交互区域也随之变小,有时我们想增大这个区域,让"细线"更容易被拾取到 | number | 0 | |
| lineCap | 组合描边端点样式 | `round` \| `square` \| `butt` | `butt` | |
| lineDash | 组合描边虚线样式 | number[] | - | |
| lineDashOffset | 组合描边虚线偏移量 | number | - | |
| lineJoin | 组合描边连接处样式 | `round` \| `bevel` \| `miter` | `miter` | |
| lineWidth | 组合描边宽度 | number | 1 | |
| opacity | 组合透明度 | number \| string | 1 | |
| pointerEvents | 组合如何响应指针事件,[配置项](#pointerevents) | string | `auto` | |
| shadowBlur | 组合阴影模糊度 | number | - | |
| shadowColor | 组合阴影颜色 | string | - | |
| shadowOffsetX | 组合阴影在 x 轴方向上的偏移量 | number \| string | - | |
| shadowOffsetY | 组合阴影在 y 轴方向上的偏移量 | number \| string | - | |
| shadowType | 组合阴影类型 | `inner` \| `outer` | `outer` | |
| size | 组合大小,快捷设置组合宽高,[配置项](#size) | number \| number[] | - | |
| stroke | 组合描边色 | string | `#99ADD1` | |
| strokeOpacity | 组合描边色透明度 | number \| string | 1 | |
| transform | transform 属性允许你旋转、缩放、倾斜或平移给定组合 | string | - | |
| transformOrigin | 旋转与缩放中心,也称作变换中心 | string | - | |
| visibility | 组合是否可见 | `visible` \| `hidden` | `visible` | |
| x | 组合 x 坐标 | number | 0 | |
| y | 组合 y 坐标 | number | 0 | |
| z | 组合 z 坐标 | number | 0 | |
| zIndex | 组合渲染层级 | number | 0 | |
#### Size
组合大小,快捷设置组合宽高,支持三种配置方式:
- number:表示组合宽高相同为指定值
- [number, number]:表示组合宽高分别为数组元素依次表示组合的宽度、高度
- [number, number, number]:表示组合宽高分别为数组元素依次表示组合的宽度、高度以及深度
#### PointerEvents
`pointerEvents` 属性控制图形如何响应交互事件,可参考 [MDN 文档](https://developer.mozilla.org/en-US/docs/Web/CSS/pointer-events)。
可选值有:`visible` | `visiblepainted` | `visiblestroke` | `non-transparent-pixel` | `visiblefill` | `visible` | `painted` | `fill` | `stroke` | `all` | `none` | `auto` | `inherit` | `initial` | `unset`
简而言之,`fill`、`stroke` 和 `visibility` 都可以独立或组合影响拾取判定行为。目前支持以下关键词:
- **`auto`**:默认值,等同于 `visiblepainted`
- **`none`**:永远不会成为响应事件的目标
- **`visiblepainted`**:满足以下条件才会响应事件:
- `visibility` 设置为 `visible`,即图形为可见的
- 在图形填充区域触发同时 `fill` 取非 `none` 的值;或者在图形描边区域触发同时 `stroke` 取非 `none` 的值
- **`visiblefill`**:满足以下条件才会响应事件:
- `visibility` 设置为 `visible`,即图形为可见的
- 在图形填充区域触发,不受 `fill` 取值的影响
- **`visiblestroke`**:满足以下条件才会响应事件:
- `visibility` 设置为 `visible`,即图形为可见的
- 在图形描边区域触发,不受 `stroke` 取值的影响
- **`visible`**:满足以下条件才会响应事件:
- `visibility` 设置为 `visible`,即图形为可见的
- 在图形填充或者描边区域触发,不受 `fill` 和 `stroke` 取值的影响
- **`painted`**:满足以下条件才会响应事件:
- 在图形填充区域触发同时 `fill` 取非 `none` 的值;或者在图形描边区域触发同时 `stroke` 取非 `none` 的值
- 不受 `visibility` 取值的影响
- **`fill`**:满足以下条件才会响应事件:
- 在图形填充区域触发,不受 `fill` 取值的影响
- 不受 `visibility` 取值的影响
- **`stroke`**:满足以下条件才会响应事件:
- 在图形描边区域触发,不受 `stroke` 取值的影响
- 不受 `visibility` 取值的影响
- **`all`**:只要进入图形的填充和描边区域就会响应事件,不会受 `fill`、`stroke`、`visibility` 的取值影响
**使用示例:**
```js
// 示例1:只有描边区域响应事件
const graph = new Graph({
combo: {
style: {
fill: 'none',
stroke: '#000',
lineWidth: 2,
pointerEvents: 'stroke', // 只有描边响应事件
},
},
});
// 示例2:完全不响应事件
const graph = new Graph({
combo: {
style: {
pointerEvents: 'none', // 组合不响应任何事件
},
},
});
```
#### Cursor
可选值有:`auto` | `default` | `none` | `context-menu` | `help` | `pointer` | `progress` | `wait` | `cell` | `crosshair` | `text` | `vertical-text` | `alias` | `copy` | `move` | `no-drop` | `not-allowed` | `grab` | `grabbing` | `all-scroll` | `col-resize` | `row-resize` | `n-resize` | `e-resize` | `s-resize` | `w-resize` | `ne-resize` | `nw-resize` | `se-resize` | `sw-resize` | `ew-resize` | `ns-resize` | `nesw-resize` | `nwse-resize` | `zoom-in` | `zoom-out`
### 收起时样式
当组合处于收起状态时(`collapsed` 为 `true`),可以为其配置特殊的样式。收起时的样式属性以 `collapsed` 为前缀。
#### 基础收起样式
为收起状态的组合设置不同的外观:
```js | ob { inject: true }
import { Graph } from '@antv/g6';
const graph = new Graph({
container: 'container',
width: 200,
height: 100,
autoFit: 'center',
data: {
nodes: [
{ id: 'node1', combo: 'combo1' },
{ id: 'node2', combo: 'combo1' },
],
combos: [{ id: 'combo1', style: { collapsed: true } }],
},
combo: {
style: {
collapsedFill: '#1783FF',
collapsedStroke: '#000',
collapsedLineWidth: 2,
collapsedSize: 40,
collapsedMarkerFill: '#fff',
collapsedMarkerFontSize: 12,
},
},
});
graph.render();
```
以下为收起时样式的完整配置:
| 属性 | 描述 | 类型 | 默认值 | 必选 |
| ---------------------------------------- | ----------------------------------------------------------------------------------------------------- | ----------------------------- | ---------------------------------- | ---- |
| collapsedCursor | 组合收起时的鼠标移入样式,[配置项](#cursor) | string | 默认与展开时的 cursor 一致 | |
| collapsedFill | 组合收起时的填充色 | string | 默认与展开时的 fill 一致 | |
| collapsedFillOpacity | 组合收起时的填充色透明度 | number \| string | 1 | |
| collapsedIncreasedLineWidthForHitTesting | 组合收起时,当 lineWidth 较小时,可交互区域也随之变小,有时我们想增大这个区域,让"细线"更容易被拾取到 | number | 0 | |
| collapsedLineCap | 组合收起时的描边端点样式 | `round` \| `square` \| `butt` | 默认与展开时的 lineCap 一致 | |
| collapsedLineDash | 组合收起时的描边虚线样式 | number[] | 默认与展开时的 lineDash 一致 | |
| collapsedLineDashOffset | 组合收起时的描边虚线偏移量 | number | 默认与展开时的 lineDashOffset 一致 | |
| collapsedLineJoin | 组合收起时的描边连接处样式 | `round` \| `bevel` \| `miter` | 默认与展开时的 lineJoin 一致 | |
| collapsedLineWidth | 组合收起时的描边宽度 | number | 默认与展开时的 lineWidth 一致 | |
| collapsedMarker | 组合收起时是否显示标记,[配置项](#收起时标记样式) | boolean | true | |
| collapsedOpacity | 组合收起时的透明度 | number \| string | 默认与展开时的 opacity 一致 | |
| collapsedShadowBlur | 组合收起时的阴影模糊度 | number | 默认与展开时的 shadowBlur 一致 | |
| collapsedShadowColor | 组合收起时的阴影颜色 | string | 默认与展开时的 shadowColor 一致 | |
| collapsedShadowOffsetX | 组合收起时的阴影在 x 轴方向上的偏移量 | number \| string | 默认与展开时的 shadowOffsetX 一致 | |
| collapsedShadowOffsetY | 组合收起时的阴影在 y 轴方向上的偏移量 | number \| string | 默认与展开时的 shadowOffsetY 一致 | |
| collapsedShadowType | 组合收起时的阴影类型 | `inner` \| `outer` | 默认与展开时的 shadowType 一致 | |
| collapsedSize | 组合收起时的大小 | number \| [number, number] | 32 | |
| collapsedStroke | 组合收起时的描边色 | string | 默认与展开时的 stroke 一致 | |
| collapsedStrokeOpacity | 组合收起时的描边色透明度 | number \| string | 默认与展开时的 strokeOpacity 一致 | |
| collapsedVisibility | 组合收起时是否可见 | `visible` \| `hidden` | 默认与展开时的 visibility 一致 | |
### 收起时标记样式
当 `collapsedMarker` 为 `true` 时显示的标记,用于显示收起组合内包含的元素数量。
#### 自定义标记内容
可以自定义收起标记显示的内容:
```js | ob { inject: true }
import { Graph } from '@antv/g6';
const graph = new Graph({
container: 'container',
width: 200,
height: 100,
autoFit: 'center',
data: {
nodes: [
{ id: 'node1', combo: 'combo1' },
{ id: 'node2', combo: 'combo1' },
{ id: 'node3', combo: 'combo1' },
],
combos: [{ id: 'combo1', style: { collapsed: true } }],
},
combo: {
style: {
collapsedMarkerType: 'child-count',
collapsedMarkerFill: '#1783FF',
collapsedMarkerFontSize: 14,
collapsedMarkerFontWeight: 'bold',
},
},
});
graph.render();
```
以下为收起时标记样式的完整配置:
| 属性 | 描述 | 类型 | 默认值 | 必选 |
| --------------------------- | ------------------------------------------------------------------------------------------------------------------------------------------------------------------------------------------------------------------------------------------------------------- | ------------------------------------------------------------------------------------------------------ | ------------- | ---- |
| collapsedMarkerType | 组合收起时显示的标记类型 <br> - `'child-count'`: 子元素数量(包括 Node 和 Combo)<br>- `'descendant-count'`: 后代元素数量(包括 Node 和 Combo)<br>- `'node-count'`: 后代元素数量(只包括 Node)<br> - `(children: NodeLikeData[]) => string`: 自定义处理逻辑 | `child-count` \| `descendant-count` \| `node-count` \| ((children: NodeData \| ComboData[]) => string) | `child-count` | |
| collapsedMarkerFill | 标记文字颜色 | string | #fff | |
| collapsedMarkerFillOpacity | 标记文字颜色透明度 | number | 1 | |
| collapsedMarkerFontSize | 标记字体大小 | number | 12 | |
| collapsedMarkerFontWeight | 标记字体粗细 | number \| string | `normal` | |
| collapsedMarkerRadius | 标记圆角半径 | number | 0 | |
| collapsedMarkerSrc | 图片来源。其优先级高于 `collapsedMarkerText` | string | - | |
| collapsedMarkerText | 标记文字 | string | - | |
| collapsedMarkerTextAlign | 标记文字水平对齐方式 | `center` \| `end` \| `left` \| `right` \| `start` | `center` | |
| collapsedMarkerTextBaseline | 标记文字对齐基线 | `alphabetic` \| `bottom` \| `hanging` \| `ideographic` \| `middle` \| `top` | `middle` | |
| collapsedMarkerWidth | 标记宽度 | number | - | |
| collapsedMarkerHeight | 标记高度 | number | - | |
| collapsedMarkerZIndex | 标记层级 | number | 1 | |
### 徽标样式
徽标是组合上显示的小标记,通常用于展示状态、数量或其他辅助信息。支持多个徽标同时显示,并可自定义位置。
#### 单个徽标
为组合添加一个简单的徽标:
```js | ob { inject: true }
import { Graph } from '@antv/g6';
const graph = new Graph({
container: 'container',
width: 200,
height: 100,
autoFit: 'center',
data: {
nodes: [{ id: 'node1', combo: 'combo1' }],
combos: [{ id: 'combo1' }],
},
combo: {
style: {
badges: [
{ text: 'NEW' }, // 默认显示在上方
],
},
},
});
graph.render();
```
#### 多个徽标
为组合添加多个不同位置的徽标:
```js | ob { inject: true }
import { Graph } from '@antv/g6';
const graph = new Graph({
container: 'container',
width: 200,
height: 100,
autoFit: 'center',
data: {
nodes: [{ id: 'node1', combo: 'combo1' }],
combos: [{ id: 'combo1' }],
},
combo: {
style: {
badge: true, // 是否显示徽标
badges: [
{ text: 'A', placement: 'right-top' },
{ text: 'Important', placement: 'right' },
{ text: 'Notice', placement: 'right-bottom' },
],
badgePalette: ['#7E92B5', '#F4664A', '#FFBE3A'], // 徽标的背景色板
badgeFontSize: 7, // 徽标字体大小
},
},
});
graph.render();
```
#### 自定义徽标样式
完全自定义徽标的外观:
```js | ob { inject: true }
import { Graph } from '@antv/g6';
const graph = new Graph({
container: 'container',
width: 200,
height: 100,
autoFit: 'center',
data: {
nodes: [{ id: 'node1', combo: 'combo1' }],
combos: [{ id: 'combo1' }],
},
combo: {
style: {
badges: [
{
text: '99+',
placement: 'right-top',
backgroundFill: '#FF4D4F', // 红色背景
fill: '#fff', // 白色文字
fontSize: 10,
padding: [2, 6],
backgroundRadius: 8,
},
],
},
},
});
graph.render();
```
以下为完整的徽标样式配置:
| 属性 | 描述 | 类型 | 默认值 |
| ------------ | ------------------ | ------------------------------------- | --------------------------------- |
| badge | 组合是否显示徽标 | boolean | true |
| badgePalette | 组合徽标的背景色板 | string[] | [`#7E92B5`, `#F4664A`, `#FFBE3A`] |
| badges | 组合徽标设置 | [BadgeStyleProps](#badgestyleprops)[] | - |
#### BadgeStyleProps
| 属性 | 描述 | 类型 | 默认值 |
| ------------------------ | --------------------------------------------------------------------------------------------------------------------------------------------------------------------------------------------------------------------------------- | ---------------------------------------------------------------------------------------------------------------------------------------------------------------------- | ------------ |
| background | 组合徽标是否显示背景 | boolean | true |
| backgroundCursor | 组合徽标背景鼠标移入样式,[配置项](#cursor) | string | `default` |
| backgroundFill | 组合徽标背景填充色。若不指定,优先考虑 badgePalette 按顺序分配 | string | - |
| backgroundFillOpacity | 组合徽标背景填充透明度 | number | 1 |
| backgroundFilter | 组合徽标背景滤镜 | string | - |
| backgroundHeight | 组合徽标背景高度 | number \| string | - |
| backgroundLineDash | 组合徽标背景虚线配置 | number \| string \|(number \| string )[] | - |
| backgroundLineDashOffset | 组合徽标背景虚线偏移量 | number | - |
| backgroundLineWidth | 组合徽标背景描边线宽 | number | - |
| backgroundRadius | 组合徽标背景圆角半径 <br> - number: 统一设置四个圆角半径 <br> - number[]: 分别设置四个圆角半径,会补足缺省的分量 <br> - string: 与 [CSS padding](https://developer.mozilla.org/zh-CN/docs/Web/CSS/padding) 属性类似,使用空格分隔 | number \| number[] \| string | 0 |
| backgroundShadowBlur | 组合徽标背景阴影模糊程度 | number | - |
| backgroundShadowColor | 组合徽标背景阴影颜色 | string | - |
| backgroundShadowOffsetX | 组合徽标背景阴影 X 方向偏移 | number | - |
| backgroundShadowOffsetY | 组合徽标背景阴影 Y 方向偏移 | number | - |
| backgroundStroke | 组合徽标背景描边颜色 | string | - |
| backgroundStrokeOpacity | 组合徽标背景描边透明度 | number \| string | 1 |
| backgroundVisibility | 组合徽标背景是否可见 | `visible` \| `hidden` | - |
| fill | 组合徽标文字颜色 | string | - |
| fontFamily | 组合徽标字体族 | string | - |
| fontSize | 组合徽标字体大小 | number | 8 |
| fontStyle | 组合徽标字体样式 | `normal` \| `italic` \| `oblique` | `normal` |
| fontVariant | 组合徽标字体变种 | `normal` \| `small-caps` \| string | `normal` |
| fontWeight | 组合徽标字体粗细 | number \| string | `normal` |
| lineHeight | 组合徽标行高 | string \| number | - |
| lineWidth | 组合徽标行宽 | string \| number | - |
| maxLines | 组合徽标文本最大行数 | number | 1 |
| offsetX | 组合徽标在 x 轴方向上的偏移量 | number | 0 |
| offsetY | 组合徽标在 y 轴方向上的偏移量 | number | 0 |
| padding | 组合徽标内边距 | number \| number[] | 0 |
| placement | 组合徽标相对于组合主图形的位置。若不指定,默认从右上角顺时针依次排放 | `left` \| `right` \| `top` \| `bottom` \| `left-top` \| `left-bottom` \| `right-top` \| `right-bottom` \| `top-left` \| `top-right` \| `bottom-left` \| `bottom-right` | - |
| text | 组合徽标文字内容 | string | - |
| textAlign | 组合徽标文本水平对齐方式 | `start` \| `center` \| `middle` \| `end` \| `left` \| `right` | `left` |
| textBaseline | 组合徽标文本基线 | `top` \| `hanging` \| `middle` \| `alphabetic` \| `ideographic` \| `bottom` | `alphabetic` |
| textDecorationColor | 组合徽标文本装饰线颜色 | string | - |
| textDecorationLine | 组合徽标文本装饰线 | string | - |
| textDecorationStyle | 组合徽标文本装饰线样式 | `solid` \| `double` \| `dotted` \| `dashed` \| `wavy` | `solid` |
| textOverflow | 组合徽标文本溢出处理方式 | `clip` \| `ellipsis` \| string | `clip` |
| visibility | 组合徽标是否可见 | `visible` \| `hidden` | - |
| wordWrap | 组合徽标文本是否自动换行 | boolean | - |
| zIndex | 组合徽标渲染层级 | number | 3 |
### 标签样式
标签用于显示组合的文本信息,支持丰富的文本样式配置和灵活的位置布局。
#### 基础标签配置
为组合添加基本的文本标签:
```js | ob { inject: true }
import { Graph } from '@antv/g6';
const graph = new Graph({
container: 'container',
width: 240,
height: 100,
autoFit: 'center',
data: {
nodes: [{ id: 'node1', combo: 'combo1' }],
combos: [{ id: 'combo1' }],
},
combo: {
style: {
labelText: '销售部门', // 标签文字内容
labelFill: '#1A1A1A', // 标签文字颜色
labelFontSize: 14, // 标签字体大小
labelPlacement: 'bottom', // 标签位置:底部
},
},
});
graph.render();
```
#### 多行文本标签
配置支持多行显示的标签:
```js | ob { inject: true }
import { Graph } from '@antv/g6';
const graph = new Graph({
container: 'container',
width: 240,
height: 120,
autoFit: 'center',
data: {
nodes: [{ id: 'node1', combo: 'combo1' }],
combos: [{ id: 'combo1' }],
},
combo: {
style: {
labelText: '这是一个支持多行显示的组合标签文本内容',
labelWordWrap: true, // 开启文本换行
labelMaxWidth: 100, // 最大宽度 100px
labelMaxLines: 3, // 最多显示 3 行
labelTextAlign: 'center', // 文本居中对齐
labelFontSize: 12,
},
},
});
graph.render();
```
#### 自定义样式标签
创建具有特殊样式的标签:
```js | ob { inject: true }
import { Graph } from '@antv/g6';
const graph = new Graph({
container: 'container',
width: 240,
height: 100,
autoFit: 'center',
data: {
nodes: [{ id: 'node1', combo: 'combo1' }],
combos: [{ id: 'combo1' }],
},
combo: {
style: {
labelText: 'IMPORTANT',
labelFill: '#FF4D4F', // 红色文字
labelFontSize: 16,
labelFontWeight: 'bold', // 粗体
labelFontStyle: 'italic', // 斜体
labelTextDecorationLine: 'underline', // 下划线
labelLetterSpacing: 2, // 字间距
labelPlacement: 'top',
},
},
});
graph.render();
```
以下为完整的标签样式配置:
| 属性 | 描述 | 类型 | 默认值 | 必选 |
| ------------------------ | ---------------------------------------------------------------------------------------------------------------------------- | --------------------------------------------------------------------------- | --------- | ---- |
| label | 是否显示组合标签 | boolean | true | |
| labelCursor | 鼠标移入组合标签时显示的样式,[配置项](#cursor) | string | `default` | |
| labelFill | 组合标签文字颜色 | string | #000 | |
| labelFillOpacity | 组合标签文字颜色的透明度 | number | 1 | |
| labelFontFamily | 组合标签字体族 | string | - | |
| labelFontSize | 组合标签字体大小 | number | 12 | |
| labelFontStyle | 组合标签字体样式 | `normal` \| `italic` \| `oblique` | - | |
| labelFontVariant | 组合标签字体变种 | `normal` \| `small-caps` \| string | - | |
| labelFontWeight | 组合标签字体粗细 | `normal` \| `bold` \| `bolder` \| `lighter` \| number | 400 | |
| labelLeading | 行间距 | number | 0 | |
| labelLetterSpacing | 组合标签字间距 | number \| string | - | |
| labelLineHeight | 组合标签行高 | number \| string | - | |
| labelMaxLines | 组合标签最大行数 | number | 1 | |
| labelMaxWidth | 组合标签最大宽度,[配置项](#labelmaxwidth) | number \| string | `200%` | |
| labelOffsetX | 组合标签在 x 轴方向上的偏移量 | number | 0 | |
| labelOffsetY | 组合标签在 y 轴方向上的偏移量 | number | 0 | |
| labelPadding | 组合标签内边距 | number \| number[] | 0 | |
| labelPlacement | 组合标签相对于组合主图形的位置,[配置项](#labelplacement) | string | `bottom` | |
| labelText | 组合标签文字内容 | string | - | |
| labelTextAlign | 组合标签文本水平对齐方式 | `start` \| `center` \| `middle` \| `end` \| `left` \| `right` | `left` | |
| labelTextBaseline | 组合标签文本基线 | `top` \| `hanging` \| `middle` \| `alphabetic` \| `ideographic` \| `bottom` | - | |
| labelTextDecorationColor | 组合标签文本装饰线颜色 | string | - | |
| labelTextDecorationLine | 组合标签文本装饰线 | string | - | |
| labelTextDecorationStyle | 组合标签文本装饰线样式 | `solid` \| `double` \| `dotted` \| `dashed` \| `wavy` | - | |
| labelTextOverflow | 组合标签文本溢出处理方式 | `clip` \| `ellipsis` \| string | - | |
| labelTextPath | 组合标签文本路径 | Path | - | |
| labelWordWrap | 组合标签是否开启自动折行。开启 labelWordWrap 后,超出 labelMaxWidth 的部分自动换行 | boolean | false | |
| labelZIndex | 组合标签渲染层级 | number | 0 | |
| `label{StyleProps}` | 更多标签样式配置,参考 [TextStyleProps](https://g.antv.antgroup.com/api/basic/text) 属性值。比如 labelOpacity 代表标签透明度 | [TextStyleProps](https://g.antv.antgroup.com/api/basic/text) | - | |
#### LabelPlacement
标签相对于组合主图形的位置,可选值有:
- `center`:标签位于组合中心
- `top`、`bottom`、`left`、`right`:标签位于组合的上、下、左、右方
- `top-left`、`top-right`、`bottom-left`、`bottom-right`:标签位于组合的四个角
- `left-top`、`left-bottom`、`right-top`、`right-bottom`:标签位于组合边的端点
#### LabelMaxWidth
开启自动折行 `labelWordWrap` 后,超出该宽度则换行:
- string: 表示以相对于组合元素宽度的百分比形式定义最大宽度。例如 `50%` 表示标签宽度不超过组合宽度的一半
- number: 表示以像素值为单位定义最大宽度。例如 100 表示标签的最大宽度为 100 像素
比如,设置多行标签文字:
```json
{
"labelWordWrap": true,
"labelMaxWidth": 200,
"labelMaxLines": 3
}
```
### 标签背景样式
标签背景为标签文字提供背景装饰,可以提升标签的可读性和视觉效果。
#### 基础背景样式
为标签添加简单的背景:
```js | ob { inject: true }
import { Graph } from '@antv/g6';
const graph = new Graph({
container: 'container',
width: 240,
height: 100,
autoFit: 'center',
data: {
nodes: [{ id: 'node1', combo: 'combo1' }],
combos: [{ id: 'combo1' }],
},
combo: {
style: {
labelText: '重要组合',
labelFill: '#fff', // 白色文字
labelBackground: true, // 启用背景
labelBackgroundFill: '#1783FF', // 蓝色背景
labelBackgroundPadding: [4, 8], // 内边距:垂直4px,水平8px
labelBackgroundRadius: 4, // 圆角半径
},
},
});
graph.render();
```
#### 渐变背景效果
创建带渐变效果的标签背景:
```js | ob { inject: true }
import { Graph } from '@antv/g6';
const graph = new Graph({
container: 'container',
width: 240,
height: 100,
autoFit: 'center',
data: {
nodes: [{ id: 'node1', combo: 'combo1' }],
combos: [{ id: 'combo1' }],
},
combo: {
style: {
labelText: 'VIP组合',
labelFill: '#fff',
labelFontWeight: 'bold',
labelBackground: true,
labelBackgroundFill: 'linear-gradient(45deg, #FF6B6B, #4ECDC4)', // 渐变背景
labelBackgroundPadding: [6, 12],
labelBackgroundRadius: 20, // 大圆角
labelBackgroundShadowColor: 'rgba(0,0,0,0.2)',
labelBackgroundShadowBlur: 4,
labelBackgroundShadowOffsetY: 2,
},
},
});
graph.render();
```
#### 描边背景样式
创建只有描边的标签背景:
```js | ob { inject: true }
import { Graph } from '@antv/g6';
const graph = new Graph({
container: 'container',
width: 240,
height: 100,
autoFit: 'center',
data: {
nodes: [{ id: 'node1', combo: 'combo1' }],
combos: [{ id: 'combo1' }],
},
combo: {
style: {
labelText: '边框标签',
labelFill: '#1783FF',
labelBackground: true,
labelBackgroundFill: 'transparent', // 透明背景
labelBackgroundStroke: '#1783FF', // 蓝色描边
labelBackgroundLineWidth: 2, // 描边宽度
labelBackgroundPadding: [4, 8],
labelBackgroundRadius: 8,
},
},
});
graph.render();
```
以下为完整的标签背景样式配置:
| 属性 | 描述 | 类型 | 默认值 |
| ----------------------------- | ---------------------------------------------------------------------------------------------------------------------------------------------- | ------------------------------------------------------------ | ------------ |
| labelBackground | 组合标签背景是否显示 | boolean | false |
| labelBackgroundCursor | 组合标签背景鼠标移入样式,[配置项](#cursor) | string | `default` |
| labelBackgroundFill | 组合标签背景填充色 | string | #000 |
| labelBackgroundFillOpacity | 组合标签背景透明度 | number | 0.75 |
| labelBackgroundHeight | 组合标签背景高度 | string \| number | - |
| labelBackgroundLineDash | 组合标签背景虚线配置 | number \| string \|(number \| string )[] | - |
| labelBackgroundLineDashOffset | 组合标签背景虚线偏移量 | number | - |
| labelBackgroundLineWidth | 组合标签背景描边线宽 | number | - |
| labelBackgroundPadding | 组合标签背景内间距 | number \| number[] | [2, 4, 2, 4] |
| labelBackgroundRadius | 组合标签背景圆角半径 <br> - number: 统一设置四个圆角半径 <br> - number[]: 分别设置四个圆角半径,不足则自动补充 | number \| number[] | 0 |
| labelBackgroundShadowBlur | 组合标签背景阴影模糊程度 | number | - |
| labelBackgroundShadowColor | 组合标签背景阴影颜色 | string | - |
| labelBackgroundShadowOffsetX | 组合标签背景阴影 X 方向偏移 | number | - |
| labelBackgroundShadowOffsetY | 组合标签背景阴影 Y 方向偏移 | number | - |
| labelBackgroundStroke | 组合标签背景描边颜色 | string | - |
| labelBackgroundStrokeOpacity | 组合标签背景描边透明度 | number \| string | 1 |
| labelBackgroundVisibility | 组合标签背景是否可见 | `visible` \| `hidden` | - |
| labelBackgroundZIndex | 组合标签背景渲染层级 | number | 1 |
| `labelBackground{StyleProps}` | 更多标签背景样式配置,参考 [RectStyleProps](https://g.antv.antgroup.com/api/basic/rect) 属性值。例如 labelBackgroundOpacity 代表标签背景透明度 | [RectStyleProps](https://g.antv.antgroup.com/api/basic/rect) | - |
### 光晕样式
光晕效果用于突出显示组合,通常在鼠标悬停、选中或激活状态下使用,为组合周围添加发光效果。
#### 基础光晕效果
为组合添加简单的光晕效果:
```js | ob { inject: true }
import { Graph } from '@antv/g6';
const graph = new Graph({
container: 'container',
width: 240,
height: 100,
autoFit: 'center',
data: {
nodes: [{ id: 'node1', combo: 'combo1' }],
combos: [{ id: 'combo1' }],
},
combo: {
style: {
halo: true, // 启用光晕
haloStroke: '#1783FF', // 蓝色光晕
haloLineWidth: 8, // 光晕宽度
haloStrokeOpacity: 0.3, // 光晕透明度
},
},
});
graph.render();
```
#### 彩色光晕效果
创建彩色渐变的光晕效果:
```js | ob { inject: true }
import { Graph } from '@antv/g6';
const graph = new Graph({
container: 'container',
width: 240,
height: 100,
autoFit: 'center',
data: {
nodes: [{ id: 'node1', combo: 'combo1' }],
combos: [{ id: 'combo1' }],
},
combo: {
style: {
halo: true,
haloStroke: '#FF4D4F', // 红色光晕
haloLineWidth: 12, // 较粗的光晕
haloStrokeOpacity: 0.5,
haloFilter: 'blur(2px)', // 模糊滤镜效果
},
},
});
graph.render();
```
#### 动态光晕效果
在状态切换时使用光晕效果:
```js | ob { inject: true }
import { Graph } from '@antv/g6';
const graph = new Graph({
container: 'container',
width: 240,
height: 100,
autoFit: 'center',
data: {
nodes: [{ id: 'node1', combo: 'combo1' }],
combos: [{ id: 'combo1' }],
},
combo: {
style: {
// 默认状态下不显示光晕
halo: false,
},
state: {
// 悬停状态显示橙色光晕
hover: {
halo: true,
haloStroke: '#FF7A00',
haloLineWidth: 10,
haloStrokeOpacity: 0.4,
},
// 选中状态显示绿色光晕
selected: {
halo: true,
haloStroke: '#52C41A',
haloLineWidth: 6,
haloStrokeOpacity: 0.6,
},
},
},
});
graph.render();
```
以下为完整的光晕样式配置:
| 属性 | 描述 | 类型 | 默认值 | 必选 |
| ------------------ | ---------------------------------------------------------------------------------------------------------------------------------------------- | --------------------------------------------------------------------- | ---------------------------- | ---- |
| halo | 是否显示组合光晕 | boolean | false | |
| haloCursor | 组合光晕鼠标移入样式,[配置项](#cursor) | string | `default` | |
| haloDraggable | 组合光晕是否允许拖拽 | boolean | true | |
| haloDroppable | 组合光晕是否允许接收被拖拽的元素 | boolean | false | |
| haloFill | 光晕填充色 | string | 与主图形的填充色 `fill` 一致 | |
| haloFillRule | 组合光晕填充规则 | `nonzero` \| `evenodd` | - | |
| haloFilter | 组合光晕滤镜效果,如 'blur(2px)' 可创建模糊效果 | string | - | |
| haloLineWidth | 组合光晕描边宽度,控制光晕的粗细程度 | number | 12 | |
| haloPointerEvents | 组合光晕效果是否响应指针事件,[配置项](#pointerevents) | string | `none` | |
| haloStroke | 组合光晕描边色,**此属性用于设置组合周围光晕的颜色,帮助突出显示组合** | string | `#99add1` | |
| haloStrokeOpacity | 组合光晕描边色透明度,建议使用 0.2-0.6 的值以获得自然的光晕效果 | number | 0.25 | |
| haloVisibility | 组合光晕可见性 | `visible` \| `hidden` | `visible` | |
| haloZIndex | 组合光晕渲染层级,通常设置为负值以确保光晕在组合主图形下方 | number | -1 | |
| `halo{StyleProps}` | 更多光晕样式配置,参考 [DisplayObject](https://g.antv.antgroup.com/api/basic/display-object) 配置项。例如 haloFillOpacity 代表光晕填充色透明度 | [DisplayObject](https://g.antv.antgroup.com/api/basic/display-object) | - | |
**光晕使用建议:**
1. **性能考虑**:光晕效果会增加渲染负担,建议在必要时才启用
2. **颜色搭配**:光晕颜色应与组合主色调协调,避免过于突兀
3. **透明度设置**:合理的透明度(0.2-0.6)可以创造自然的光晕效果
4. **状态应用**:光晕通常用于 hover、selected、active 等交互状态
### 图标样式
图标用于在组合中显示文字或图片内容,通常位于组合的中心位置,可以用来表示组合的类型或功能。
#### 文字图标
使用文字作为组合的图标:
```js | ob { inject: true }
import { Graph } from '@antv/g6';
const graph = new Graph({
container: 'container',
width: 240,
height: 100,
autoFit: 'center',
data: {
combos: [{ id: 'combo1' }],
},
combo: {
style: {
iconText: 'A', // 显示字母 A
iconFill: '#1783FF', // 蓝色文字
iconFontSize: 24, // 大字体
iconFontWeight: 'bold', // 粗体
},
},
});
graph.render();
```
#### 图片图标
使用图片作为组合的图标:
```js | ob { inject: true }
import { Graph } from '@antv/g6';
const graph = new Graph({
container: 'container',
width: 240,
height: 100,
autoFit: 'center',
data: {
combos: [{ id: 'combo1' }],
},
combo: {
style: {
fill: '#1890FF',
iconSrc: 'https://gw.alipayobjects.com/zos/basement_prod/012bcf4f-423b-4922-8c24-32a89f8c41ce.svg',
iconWidth: 32,
iconHeight: 32,
},
},
});
graph.render();
```
#### 彩色文字图标
创建带有特殊样式的文字图标:
```js | ob { inject: true }
import { Graph } from '@antv/g6';
const graph = new Graph({
container: 'container',
width: 240,
height: 100,
autoFit: 'center',
data: {
combos: [{ id: 'combo1' }],
},
combo: {
style: {
iconText: '部门',
iconFill: '#FF4D4F', // 红色文字
iconFontSize: 16,
iconFontWeight: 'bold',
iconFontStyle: 'italic', // 斜体
iconTextDecorationLine: 'underline', // 下划线
iconLetterSpacing: 1, // 字间距
},
},
});
graph.render();
```
以下为完整的图标样式配置:
| 属性 | 描述 | 类型 | 默认值 |
| ----------------------- | ---------------------------------------------------------------------------- | --------------------------------------------------------------------------- | ---------------- |
| icon | 是否显示组合图标 | boolean | true |
| iconCursor | 组合图标鼠标移入样式,[配置项](#cursor) | string | `default` |
| iconFill | 组合图标文字颜色 | string | - |
| iconFillOpacity | 组合图标文字颜色透明度 | number | 1 |
| iconFontFamily | 组合图标字体族 | string | - |
| iconFontSize | 组合图标字体大小 | number | 16 |
| iconFontStyle | 组合图标字体样式 | `normal` \| `italic` \| `oblique` | `normal` |
| iconFontVariant | 组合图标字体变种 | `normal` \| `small-caps` \| string | `normal` |
| iconFontWeight | 组合图标字体粗细 | number \| string | `normal` |
| iconHeight | 组合图标高度,当使用图片图标时用于控制图片尺寸 | number | 主图形高度的一半 |
| iconLetterSpacing | 组合图标文本字间距 | number \| string | - |
| iconLineHeight | 组合图标文本行高 | number \| string | - |
| iconMaxLines | 组合图标文本最大行数 | number | 1 |
| iconOffsetX | 组合图标在 x 轴方向上的偏移量 | number | 0 |
| iconOffsetY | 组合图标在 y 轴方向上的偏移量 | number | 0 |
| iconOpacity | 组合图标透明度 | number | 1 |
| iconRadius | 组合图标圆角半径(仅对矩形图标有效) | number | 0 |
| iconSrc | 组合图片来源。其优先级高于 iconText,支持本地图片和网络图片 | string | - |
| iconText | 组合图标文字内容,支持文字、Unicode 字符等 | string | - |
| iconTextAlign | 组合图标文本水平对齐方式 | `start` \| `center` \| `middle` \| `end` \| `left` \| `right` | `center` |
| iconTextBaseline | 组合图标文本基线 | `top` \| `hanging` \| `middle` \| `alphabetic` \| `ideographic` \| `bottom` | `middle` |
| iconTextDecorationColor | 组合图标文本装饰线颜色 | string | - |
| iconTextDecorationLine | 组合图标文本装饰线,如下划线、删除线等 | string | - |
| iconTextDecorationStyle | 组合图标文本装饰线样式 | `solid` \| `double` \| `dotted` \| `dashed` \| `wavy` | `solid` |
| iconTextOverflow | 组合图标文本溢出处理方式 | `clip` \| `ellipsis` \| string | `clip` |
| iconVisibility | 组合图标是否可见 | `visible` \| `hidden` | `visible` |
| iconWidth | 组合图标宽度,当使用图片图标时用于控制图片尺寸 | number | 主图形宽度的一半 |
| iconWordWrap | 组合图标文本是否自动换行 | boolean | false |
| iconZIndex | 组合图标渲染层级 | number | 1 |
| `icon{StyleProps}` | 更多图标样式配置,参考图标的具体类型配置项。例如 iconStroke 代表图标描边颜色 | - | - |
**图标使用建议:**
1. **优先级**:`iconSrc`(图片)的优先级高于 `iconText`(文字),如果同时设置,会优先显示图片
2. **尺寸控制**:建议根据组合大小合理设置图标尺寸,避免图标过大或过小影响视觉效果
3. **性能优化**:使用文字图标性能更好,图片图标需要额外的网络请求和渲染开销
4. **样式一致性**:在同一个图中的组合图标样式应保持一致,提升整体视觉效果
5. **可访问性**:确保图标颜色与背景有足够的对比度,便于用户识别
## State
在一些交互行为中,比如点击选中一个组合或鼠标悬停激活一个边,仅仅是在该元素做了某些状态的标识。为了将这些状态反应到终端用户所见的视觉空间中,我们需要为不同的状态设置不同的图元素样式,以响应该图元素状态的变化。
G6 提供了几种内置的状态,包括选中(selected)、高亮(highlight)、激活(active)、不活跃(inactive)和禁用(disabled)。此外,它还支持自定义状态,以满足更特定的需求。对于每个状态,开发者可以定义一套样式规则,这些规则会覆盖元素的默认样式。
<img width="520" src="https://mdn.alipayobjects.com/huamei_qa8qxu/afts/img/A*Iv_dS5XR2TcAAAAAAAAAAAAADmJ7AQ/original" />
数据结构如下:
```typescript
type ComboState = {
[state: string]: ComboStyle;
};
```
例如,当组合处于 `focus` 状态时,可以为其添加一个宽度为 3 且颜色为橙色的描边。
```js {4-7}
const graph = new Graph({
combo: {
state: {
focus: {
lineWidth: 3, // 描边宽度
stroke: 'orange', // 描边颜色
},
},
},
});
```
效果如下图所示:
```js | ob { pin: false, inject: true }
import { Graph } from '@antv/g6';
const graph = new Graph({
container: 'container',
width: 200,
height: 100,
autoFit: 'center',
data: {
nodes: [{ id: 'node1', combo: 'combo1' }],
combos: [{ id: 'combo1', states: ['focus'] }],
},
combo: {
state: {
focus: {
lineWidth: 3,
stroke: 'orange',
fill: 'orange',
fillOpacity: 0.2,
},
},
},
});
graph.render();
```
## Animation
定义组合的动画效果,支持下列两种配置方式:
1. 关闭组合全部动画
```json
{
"combo": {
"animation": false
}
}
```
2. 配置阶段动画
阶段动画是指组合在进入画布、更新、离开画布时的动画效果。目前支持的阶段包括:
- `enter`: 组合进入画布时的动画
- `update`: 组合更新时的动画
- `exit`: 组合离开画布时的动画
- `show`: 组合从隐藏状态显示时的动画
- `hide`: 组合隐藏时的动画
- `collapse`: 组合收起时的动画
- `expand`: 组合展开时的动画
你可以参考 [动画范式](/manual/animation/animation#动画范式) 使用动画语法来配置组合,如:
```json
{
"combo": {
"animation": {
"update": [
{
"fields": ["x", "y"], // 更新时只对 x 和 y 属性进行动画
"duration": 1000, // 动画持续时间
"easing": "linear" // 缓动函数
}
],
}
}
```
也可以使用内置的动画效果:
```json
{
"combo": {
"animation": {
"enter": "fade", // 使用渐变动画
"update": "translate", // 使用平移动画
"exit": "fade" // 使用渐变动画
}
}
}
```
你可以传入 false 来关闭特定阶段的动画:
```json
{
"combo": {
"animation": {
"enter": false // 关闭组合入场动画
}
}
}
```
## Palette
定义组合的色板,即预定义组合颜色池,并根据规则进行分配,将颜色映射到 `fill` 属性。
> 有关色板的定义,请参考 [色板](/manual/theme/palette)。
| 属性 | 描述 | 类型 | 默认值 |
| ------ | ------------------------------------------------------------------- | --------------------------------- | ------- |
| type | 指定当前色板类型。<br> - `group`: 离散色板 <br> - `value`: 连续色板 | `group` | `value` | `group` |
| field | 指定元素数据中的分组字段。若不指定,默认取 id 作为分组字段 | string | ((datum) => string) | `id` |
| color | 色板颜色。如果色板注册过,可以直接指定其注册名,也接受一个颜色数组 | string | string[] | - |
| invert | 是否反转色板 | boolean | false |
如将一组数据按 `category` 字段分配组合颜色,使得同类别的组合颜色相同:
```json
{
"combo": {
"palette": {
"type": "group",
"field": "category",
"color": ["#1783FF", "#F08F56", "#D580FF", "#00C9C9", "#7863FF"]
}
}
}
```
效果如下图所示:
```js | ob { pin: false, inject: true }
import { Graph } from '@antv/g6';
const graph = new Graph({
container: 'container',
width: 600,
height: 100,
data: {
combos: new Array(8)
.fill(0)
.map((_, i) => ({ id: `combo-${i}`, data: { category: ['A', 'B', 'C', 'D', 'E'][i % 5] } })),
},
layout: { type: 'grid', cols: 8 },
combo: {
style: { fillOpacity: 0.4 },
palette: {
type: 'group',
field: 'category',
color: ['#1783FF', '#F08F56', '#D580FF', '#00C9C9', '#7863FF'],
},
},
});
graph.render();
```
也可以使用默认配置:
```json
{
"combo": {
"palette": "tableau" // tableau 为色板名,默认根据 ID 分配颜色
}
}
```
效果如下图所示:
```js | ob { pin: false, inject: true }
import { Graph } from '@antv/g6';
const graph = new Graph({
container: 'container',
width: 600,
height: 100,
data: {
combos: new Array(8)
.fill(0)
.map((_, i) => ({ id: `combo-${i}`, data: { category: ['A', 'B', 'C', 'D', 'E'][i % 5] } })),
},
layout: { type: 'grid', cols: 8 },
combo: {
style: { fillOpacity: 0.4 },
palette: 'tableau',
},
});
graph.render();
```
Combo Skill
packages/site/docs/manual/element/combo/CircleCombo.en.md anthropic-skill ~226 tokens---
title: Circle Combo
order: 2
---
## Overview
The circular combo wraps child nodes or child combos with a circular boundary, suitable for representing equal or non-hierarchical group relationships.
Applicable scenarios:
- Suitable for representing node groups without a clear hierarchical relationship. The circular combo can reflect the equality of members, such as user groups in social networks or decentralized team structures (highlighting collaboration).
## Online Experience
<embed src="@/common/api/elements/combos/circle-combo.md"></embed>
## Style Configuration
> If the element has its specific attributes, we will list them below. For all general style attributes, see [BaseCombo](/en/manual/element/combo/base-combo)
## Example
The following example shows the distribution of interest group members:
<embed src="@/common/api/elements/combos/circle-combo-interest.md"></embed>
Combo Skill
packages/site/docs/manual/element/combo/CircleCombo.zh.md anthropic-skill ~105 tokens---
title: 圆形组合 Circle
order: 2
---
## 概述
圆形组合以圆形边界包裹子节点或子组合,适合表示平等或非层级化的群组关系。
适用场景:
- 适合表示无明确层级关系的节点群组,圆形组合能体现成员的平等性,如社交网络中的用户群体、分散式团队结构(突出协作性)。
## 在线体验
<embed src="@/common/api/elements/combos/circle-combo.md"></embed>
## 样式配置
> 如果元素有其特定的属性,我们将在下面列出。对于所有的通用样式属性,见 [BaseCombo](/manual/element/combo/base-combo)
## 示例
以下示例为兴趣小组人员分布:
<embed src="@/common/api/elements/combos/circle-combo-interest.md"></embed>
Combo Skill
packages/site/docs/manual/element/combo/custom-combo.en.md anthropic-skill ~5,075 tokens---
title: Custom Combo
order: 4
---
G6 provides two types of [built-in combos](/en/manual/element/combo/base-combo): circular combos and rectangular combos. However, in complex business scenarios, you may need to create custom combos with specific styles, interactive effects, or behavior logic.
## Before You Start: Understanding the Basic Composition of Combos
In G6, a complete combo typically consists of the following parts:
<image width="200" src="https://mdn.alipayobjects.com/huamei_qa8qxu/afts/img/A*z-OxR4MAdUwAAAAAAAAAAAAADmJ7AQ/original" />
- `key`: The main graphic of the combo, representing the main shape of the combo, such as a circle, rectangle, etc.
- `label`: Text label, usually used to display the name or description of the combo.
- `halo`: A graphic that displays a halo effect around the main graphic.
### Special Characteristics of Combos
Combos differ from ordinary nodes and have the following characteristics:
1. **Containment**: Combos can contain nodes and other combos, forming a hierarchical structure.
2. **Two States**: Expanded and Collapsed states.
3. **Adaptive Size**: Automatically adjusts size based on internal elements.
4. **Drag Behavior**: Supports overall dragging and dragging elements in/out.
## Ways to Customize Combos <Badge type="warning">Choose the Right Way</Badge>
There are two ways to create custom combos:
### 1. Inherit Existing Combo Types <Badge type="success">Recommended</Badge>
This is the most common way, and you can choose to inherit one of the following types:
- [`BaseCombo`](https://github.com/antvis/G6/blob/v5/packages/g6/src/elements/combos/base-combo.ts) - The most basic combo class, providing core functionality for combos.
- [`Circle`](https://github.com/antvis/G6/blob/v5/packages/g6/src/elements/combos/circle.ts) - Circular combo.
- [`Rect`](https://github.com/antvis/G6/blob/v5/packages/g6/src/elements/combos/rect.ts) - Rectangular combo.
**Why choose this way?**
- 📌 **Less Code**: Reuse existing combo properties and methods, focusing only on new features.
- 📌 **Fast Development**: Suitable for most project needs, quickly achieving business goals.
- 📌 **Easy Maintenance**: Clear code structure and clear inheritance relationships.
:::tip{title=Get Started Now}
If you choose to inherit from existing combo types (recommended), you can jump directly to [Create Your First Custom Combo in Three Steps](#create-your-first-custom-combo-in-three-steps) to start practicing. Most users will choose this approach!
:::
### 2. Develop from Scratch Based on the G Graphics System <Badge>Advanced Usage</Badge>
If existing combo types do not meet your needs, you can create combos from scratch based on the underlying graphics system of G.
**Why choose this way?**
- 📌 **Maximum Freedom**: Full control over every detail of the combo, achieving any complex effect.
- 📌 **Special Needs**: Highly customized scenarios that existing combo types cannot meet.
- 📌 **Performance Optimization**: Performance optimization for specific scenarios.
:::warning{title=Note}
Developing custom combos from scratch requires handling all details yourself, including graphic drawing, event response, state changes, expand/collapse logic, etc., which is quite challenging. You can directly refer to the [source code](https://github.com/antvis/G6/blob/v5/packages/g6/src/elements/combos/base-combo.ts) for implementation.
:::
## Create Your First Custom Combo in Three Steps
Let's start by inheriting `BaseCombo` to implement a custom hexagon combo:
```js | ob { pin:false, inject: true }
import { Graph, register, BaseCombo, ExtensionCategory } from '@antv/g6';
// Define the path for the collapsed state button
const collapse = (x, y, r) => {
return [
['M', x - r, y],
['a', r, r, 0, 1, 0, r * 2, 0],
['a', r, r, 0, 1, 0, -r * 2, 0],
['M', x - r + 4, y],
['L', x + r - 4, y],
];
};
// Define the path for the expanded state button
const expand = (x, y, r) => {
return [
['M', x - r, y],
['a', r, r, 0, 1, 0, r * 2, 0],
['a', r, r, 0, 1, 0, -r * 2, 0],
['M', x - r + 4, y],
['L', x - r + 2 * r - 4, y],
['M', x - r + r, y - r + 4],
['L', x, y + r - 4],
];
};
class HexagonCombo extends BaseCombo {
// Get the path of the hexagon
getKeyPath(attributes) {
const [width, height] = this.getKeySize(attributes);
const padding = 10;
const size = Math.min(width, height) + padding;
// Calculate the vertices of the hexagon
const points = [];
for (let i = 0; i < 6; i++) {
const angle = (Math.PI / 3) * i;
const x = (size / 2) * Math.cos(angle);
const y = (size / 2) * Math.sin(angle);
points.push([x, y]);
}
// Construct the SVG path
const path = [['M', points[0][0], points[0][1]]];
for (let i = 1; i < 6; i++) {
path.push(['L', points[i][0], points[i][1]]);
}
path.push(['Z']);
return path;
}
// Get the style of the main graphic
getKeyStyle(attributes) {
const style = super.getKeyStyle(attributes);
return {
...style,
d: this.getKeyPath(attributes),
fill: attributes.collapsed ? '#FF9900' : '#F04864',
fillOpacity: attributes.collapsed ? 0.5 : 0.2,
stroke: '#54BECC',
lineWidth: 2,
};
}
// Draw the main graphic
drawKeyShape(attributes, container) {
return this.upsert('key', 'path', this.getKeyStyle(attributes), container);
}
// Draw the expand/collapse button, using paths for finer control
drawCollapseButton(attributes) {
const { collapsed } = attributes;
const [width] = this.getKeySize(attributes);
const btnR = 8;
const x = width / 2 + btnR;
const d = collapsed ? expand(x, 0, btnR) : collapse(x, 0, btnR);
// Create the clickable area and button graphic
const hitArea = this.upsert('hit-area', 'circle', { cx: x, r: 8, fill: '#fff', cursor: 'pointer' }, this);
this.upsert('button', 'path', { stroke: '#54BECC', d, cursor: 'pointer', lineWidth: 1.4 }, hitArea);
}
// Override the render method to add more custom graphics
render(attributes, container) {
super.render(attributes, container);
this.drawCollapseButton(attributes, container);
}
// Use lifecycle hooks to add event listeners
onCreate() {
this.shapeMap['hit-area'].addEventListener('click', () => {
const id = this.id;
const collapsed = !this.attributes.collapsed;
const { graph } = this.context;
if (collapsed) graph.collapseElement(id);
else graph.expandElement(id);
});
}
}
// Register the custom combo
register(ExtensionCategory.COMBO, 'hexagon-combo', HexagonCombo);
// Create a graph instance and use the custom combo
const graph = new Graph({
container: 'container',
height: 250,
data: {
nodes: [
{ id: 'node1', combo: 'combo1', style: { x: 100, y: 100 } },
{ id: 'node2', combo: 'combo1', style: { x: 150, y: 150 } },
{ id: 'node3', combo: 'combo2', style: { x: 300, y: 100 } },
{ id: 'node4', combo: 'combo2', style: { x: 350, y: 150 } },
],
combos: [
{ id: 'combo1', data: { label: 'Hexagon 1' } },
{ id: 'combo2', data: { label: 'Hexagon 2' }, style: { collapsed: true } },
],
},
node: {
style: {
fill: '#91d5ff',
stroke: '#1890ff',
lineWidth: 1,
},
},
combo: {
type: 'hexagon-combo',
style: {
padding: 20,
showCollapseButton: true,
labelText: (d) => d.data?.label,
labelPlacement: 'top',
},
},
behaviors: ['drag-element'],
});
graph.render();
```
### Step 1: Write the Custom Combo Class
```typescript
import { BaseCombo } from '@antv/g6';
import type { BaseComboStyleProps } from '@antv/g6';
// Define button path generation functions
const collapse = (x, y, r) => {
return [
['M', x - r, y],
['a', r, r, 0, 1, 0, r * 2, 0],
['a', r, r, 0, 1, 0, -r * 2, 0],
['M', x - r + 4, y],
['L', x + r - 4, y],
];
};
const expand = (x, y, r) => {
return [
['M', x - r, y],
['a', r, r, 0, 1, 0, r * 2, 0],
['a', r, r, 0, 1, 0, -r * 2, 0],
['M', x - r + 4, y],
['L', x - r + 2 * r - 4, y],
['M', x - r + r, y - r + 4],
['L', x, y + r - 4],
];
};
class HexagonCombo extends BaseCombo {
// Get the path of the hexagon
protected getKeyPath(attributes: Required<BaseComboStyleProps>) {
const [width, height] = this.getKeySize(attributes);
const padding = 10;
const size = Math.min(width, height) + padding;
// Calculate the vertices of the hexagon
const points = [];
for (let i = 0; i < 6; i++) {
const angle = (Math.PI / 3) * i;
const x = (size / 2) * Math.cos(angle);
const y = (size / 2) * Math.sin(angle);
points.push([x, y]);
}
// Construct the SVG path
const path = [['M', points[0][0], points[0][1]]];
for (let i = 1; i < 6; i++) {
path.push(['L', points[i][0], points[i][1]]);
}
path.push(['Z']);
return path;
}
// Get the style of the main graphic, directly using path data
protected getKeyStyle(attributes: Required<BaseComboStyleProps>) {
const style = super.getKeyStyle(attributes);
return {
...style,
d: this.getKeyPath(attributes),
fill: attributes.collapsed ? '#FF9900' : '#F04864',
fillOpacity: attributes.collapsed ? 0.5 : 0.2,
stroke: '#54BECC',
lineWidth: 2,
};
}
// Draw the main graphic, using path type to directly pass in style objects
protected drawKeyShape(attributes: Required<BaseComboStyleProps>, container: Group) {
return this.upsert('key', 'path', this.getKeyStyle(attributes), container);
}
// Draw the collapse/expand button, using SVG paths for finer control
protected drawCollapseButton(attributes: Required<BaseComboStyleProps>) {
const { collapsed } = attributes;
const [width] = this.getKeySize(attributes);
const btnR = 8;
const x = width / 2 + btnR;
const d = collapsed ? expand(x, 0, btnR) : collapse(x, 0, btnR);
// Create the clickable area and button graphic
const hitArea = this.upsert('hit-area', 'circle', { cx: x, r: 8, fill: '#fff', cursor: 'pointer' }, this);
this.upsert('button', 'path', { stroke: '#54BECC', d, cursor: 'pointer', lineWidth: 1.4 }, hitArea);
}
// Use lifecycle hook methods to bind events
onCreate() {
this.shapeMap['hit-area'].addEventListener('click', () => {
const id = this.id;
const collapsed = !this.attributes.collapsed;
const { graph } = this.context;
if (collapsed) graph.collapseElement(id);
else graph.expandElement(id);
});
}
}
```
### Step 2: Register the Custom Combo
```js
import { ExtensionCategory } from '@antv/g6';
register(ExtensionCategory.COMBO, 'hexagon-combo', HexagonCombo);
```
### Step 3: Apply the Custom Combo
```js
const graph = new Graph({
// ...other configurations
combo: {
type: 'hexagon-combo', // Use the name registered
style: {
padding: 20,
showCollapseButton: true,
labelText: (d) => d.data?.label,
labelPlacement: 'top',
},
},
// Since we implemented the collapse/expand feature ourselves, only drag behavior is needed here
behaviors: ['drag-element'],
});
```
🎉 Congratulations! You have created your first custom combo.
## Going Further: Understanding the Principles of Combo Drawing
### Differences Between Combos and Nodes
Although Combos inherit from `BaseNode`, there are some key differences:
1. **Adaptive Size**: Combos automatically calculate the appropriate size based on internal elements.
2. **Expand/Collapse States**: Combos have two display states and need to handle state transitions.
3. **Hierarchical Structure**: Combos can be nested, forming hierarchical relationships.
4. **Internal Element Management**: Combos need to manage the nodes and sub-combos they contain.
### Atomic Graphics
G6's Combos are drawn using atomic graphic units provided by the [G Graphics System](https://g.antv.antgroup.com/). For an introduction to atomic graphics, please refer to the [Element - Shape (Optional)](/en/manual/element/shape/overview) documentation.
All these graphics can be dynamically created or updated using `upsert()` and automatically manage graphic states and lifecycles.
### Element Base Class
Before customizing Combos, you need to understand some important properties and methods in the G6 element base class:
#### Properties
| Property | Type | Description |
| ---------- | ----------------------------- | --------------------------------------------------------- |
| shapeMap | Record<string, DisplayObject> | Mapping table of all graphics under the current element |
| animateMap | Record<string, IAnimation> | Mapping table of all animations under the current element |
#### Methods
#### `upsert(name, Ctor, style, container, hooks)`: Graphic Creation/Update
When creating custom Combos, you will frequently use the `upsert` method. It is short for "update or insert" and is responsible for adding or updating graphics in the element:
```typescript
upsert(key: string, Ctor: { new (...args: any[]): DisplayObject }, style: Record<string, any>, container: DisplayObject);
```
| Parameter | Type | Description |
| --------- | --------------------------------------- | ------------------------------------------------------------------------------------------------------------------------------------------------------------------------------------------------------------------------------------------------------------------------------------------------------------------------------ |
| key | string | Key of the graphic, corresponding to the key in `shapeMap`. Built-in keys include `'key'`, `'label'`, `'halo'`, `'icon'`, `'port'`, `'badge'`<br/> Keys should not use special symbols, and will be converted to camel case to call `getXxxStyle` and `drawXxxShape` methods (see [Element Conventions](#element-conventions)) |
| Ctor | { new (...args: any[]): DisplayObject } | Graphic class |
| style | Record<string, any> | Graphic style |
| container | DisplayObject | Container to mount the graphic |
For example, insert a fixed-position purple circle:
```js
this.upsert(
'element-key', // Unique identifier of the element
'circle', // Graphic type, such as 'rect', 'circle', etc.
{ x: 100, y: 100, fill: '#a975f3' }, // Style configuration object
container, // Parent container
);
```
Why use `upsert` instead of directly creating graphics with `container.appendChild()`? Because:
1. **Better Performance**: When state changes or data updates, it intelligently reuses existing graphics instead of deleting and recreating them, greatly improving rendering performance.
2. **Simpler Code**: No need to manually check if elements exist.
3. **Easy Management**: All graphics created through `upsert` are recorded in the node's `shapeMap`, and you can easily access them with `this.getShape(key)`.
#### `render(attributes, container)`: Main Entry for Rendering Combos
Every custom combo class must implement the `render(attributes, container)` method, which defines how the combo is "drawn". You can use various atomic graphics here to create the structure you want.
```typescript
render(style: Record<string, any>, container: Group): void;
```
| Parameter | Type | Description |
| --------- | ------------------- | ------------- |
| style | Record<string, any> | Element style |
| container | Group | Container |
#### `getShape(name)`: Get Created Graphics
Sometimes, you need to modify the properties of a sub-graphic after creation or have interactions between sub-graphics. In this case, the `getShape` method can help you access any graphics previously created with `upsert`:
**⚠️ Note**: The order of graphics is important. If graphic B depends on the position of graphic A, make sure A is created first.
### Element Conventions
- **Use Convention Properties**
The convention properties in combos include:
- Use `this.getKeySize(attributes)` to get the size of the combo, considering the collapsed state and sub-elements.
- Use `this.getContentBBox(attributes)` to get the bounding box of the content area.
- Use `this.getComboPosition(attributes)` to get the current position of the combo, based on state and sub-elements.
- **Use `getXxxStyle` and `drawXxxShape` Pairing for Graphic Drawing**
`getXxxStyle` is used to get the graphic style, and `drawXxxShape` is used to draw the graphic. Graphics created this way support automatic animation execution.
> `Xxx` is the camel case form of the key passed to the [upsert](#methods) method.
- **Access Graph Context via `this.context`**
### Lifecycle Hooks
The following lifecycle hook functions are provided, and you can override these methods in custom combos to execute specific logic at key moments:
| Hook Function | Trigger Timing | Typical Use Cases |
| ------------- | ------------------------------------------------------------------ | -------------------------------------------------------------------------------- |
| `onCreate` | After the combo is created and the entrance animation is completed | Bind interactive events, initialize combo state, add external listeners |
| `onUpdate` | After the combo is updated and the update animation is completed | Update dependent data, adjust related elements, trigger linkage effects |
| `onDestroy` | After the combo is destroyed and the exit animation is completed | Clean up resources, remove external listeners, execute destruction notifications |
### State Response
One of the most powerful aspects of G6 element design is the ability to separate **"state response"** from **"drawing logic"**.
You can define styles for each state in the combo configuration:
```js
combo: {
type: 'custom-combo',
style: {
fill: '#f0f2f5',
stroke: '#d9d9d9'
},
state: {
selected: {
stroke: '#1890ff',
lineWidth: 2,
shadowColor: 'rgba(24,144,255,0.2)',
shadowBlur: 15,
},
hover: {
fill: '#e6f7ff',
},
},
}
```
Method to switch states:
```js
graph.setElementState(comboId, ['selected']);
```
This state will be passed into the `render()` method's `attributes` and automatically applied to the graphics as a result of the internal system merging.
You can also customize rendering logic based on the state:
```typescript
protected getKeyStyle(attributes: Required<BaseComboStyleProps>) {
const style = super.getKeyStyle(attributes);
// Adjust style based on state
if (attributes.states?.includes('selected')) {
return {
...style,
stroke: '#1890ff',
lineWidth: 2,
shadowColor: 'rgba(24,144,255,0.2)',
shadowBlur: 15,
};
}
return style;
}
```
Combo Skill
packages/site/docs/manual/element/combo/custom-combo.zh.md anthropic-skill ~3,534 tokens---
title: 自定义 Combo
order: 4
---
G6 提供了两种 [内置组合](/manual/element/combo/base-combo) 类型:圆形组合和矩形 Combo 。但在复杂的业务场景中,你可能需要创建具有特定样式、交互效果或行为逻辑的自定义 Combo 。
## 开始之前:了解 Combo 的基本构成
在 G6 中,一个完整的 Combo 通常由以下几个部分组成:
<image width="200" src="https://mdn.alipayobjects.com/huamei_qa8qxu/afts/img/A*z-OxR4MAdUwAAAAAAAAAAAAADmJ7AQ/original" />
- `key` : Combo 的主图形,表示 Combo 的主要形状,如圆形、矩形等;
- `label` :文本标签,通常用于展示 Combo 的名称或描述;
- `halo` :主图形周围展示的光晕效果的图形;
### Combo 的特殊性
Combo 不同于普通节点,它具有以下特性:
1. **包含性**: Combo 可以包含节点和其他 Combo ,形成层级结构
2. **两种状态**:展开(Expanded)和收起(Collapsed)状态
3. **自适应大小**:根据内部元素动态调整大小
4. **拖拽行为**:支持整体拖拽及内部元素拖入/拖出
## 自定义 Combo 的方式 <Badge type="warning">选择合适的方式</Badge>
创建自定义 Combo 的方式有两种途径:
### 1. 继承现有 Combo 类型 <Badge type="success">推荐</Badge>
这是最常用的方式,你可以选择继承以下类型之一:
- [`BaseCombo`](https://github.com/antvis/G6/blob/v5/packages/g6/src/elements/combos/base-combo.ts) - 最基础的 Combo 类,提供 Combo 的核心功能
- [`Circle`](https://github.com/antvis/G6/blob/v5/packages/g6/src/elements/combos/circle.ts) - 圆形 Combo
- [`Rect`](https://github.com/antvis/G6/blob/v5/packages/g6/src/elements/combos/rect.ts) - 矩形 Combo
**为什么选择这种方式?**
- 📌 **代码量少**:复用现有 Combo 的属性和方法,只需专注于新增功能
- 📌 **开发迅速**:适合大多数项目需求,快速实现业务目标
- 📌 **易于维护**:代码结构清晰,继承关系明确
:::tip{title=立即开始}
如果你选择继承现有组合类型(推荐),可以直接跳到 [三步创建你的第一个自定义 Combo](#三步创建你的第一个自定义-combo) 开始实践。大部分用户都会选择这种方式!
:::
### 2. 基于 G 图形系统从零开发 <Badge>高级用法</Badge>
如果现有 Combo 类型都不满足需求,你可以基于 G 的底层图形系统从零创建 Combo。
**为什么选择这种方式?**
- 📌 **最大自由度**:完全控制 Combo 的每个细节,实现任意复杂效果
- 📌 **特殊需求**:现有 Combo 类型无法满足的高度定制场景
- 📌 **性能优化**:针对特定场景的性能优化
:::warning{title=注意事项}
从零开发的自定义 Combo 需要自行处理所有细节,包括图形绘制、事件响应、状态变化、展开/收起逻辑等,开发难度较大。这里可以直接参考 [源码](https://github.com/antvis/G6/blob/v5/packages/g6/src/elements/combos/base-combo.ts) 进行实现。
:::
## 三步创建你的第一个自定义 Combo
让我们从继承 `BaseCombo` 开始,实现一个自定义六边形 Combo :
```js | ob { pin:false, inject: true }
import { Graph, register, BaseCombo, ExtensionCategory } from '@antv/g6';
// 定义收起状态的按钮路径
const collapse = (x, y, r) => {
return [
['M', x - r, y],
['a', r, r, 0, 1, 0, r * 2, 0],
['a', r, r, 0, 1, 0, -r * 2, 0],
['M', x - r + 4, y],
['L', x + r - 4, y],
];
};
// 定义展开状态的按钮路径
const expand = (x, y, r) => {
return [
['M', x - r, y],
['a', r, r, 0, 1, 0, r * 2, 0],
['a', r, r, 0, 1, 0, -r * 2, 0],
['M', x - r + 4, y],
['L', x - r + 2 * r - 4, y],
['M', x - r + r, y - r + 4],
['L', x, y + r - 4],
];
};
class HexagonCombo extends BaseCombo {
// 获取六边形的路径
getKeyPath(attributes) {
const [width, height] = this.getKeySize(attributes);
const padding = 10;
const size = Math.min(width, height) + padding;
// 计算六边形的顶点
const points = [];
for (let i = 0; i < 6; i++) {
const angle = (Math.PI / 3) * i;
const x = (size / 2) * Math.cos(angle);
const y = (size / 2) * Math.sin(angle);
points.push([x, y]);
}
// 构建SVG路径
const path = [['M', points[0][0], points[0][1]]];
for (let i = 1; i < 6; i++) {
path.push(['L', points[i][0], points[i][1]]);
}
path.push(['Z']);
return path;
}
// 获取主图形样式
getKeyStyle(attributes) {
const style = super.getKeyStyle(attributes);
return {
...style,
d: this.getKeyPath(attributes),
fill: attributes.collapsed ? '#FF9900' : '#F04864',
fillOpacity: attributes.collapsed ? 0.5 : 0.2,
stroke: '#54BECC',
lineWidth: 2,
};
}
// 绘制主图形
drawKeyShape(attributes, container) {
return this.upsert('key', 'path', this.getKeyStyle(attributes), container);
}
// 绘制展开/收起按钮,使用路径实现更精细的控制
drawCollapseButton(attributes) {
const { collapsed } = attributes;
const [width] = this.getKeySize(attributes);
const btnR = 8;
const x = width / 2 + btnR;
const d = collapsed ? expand(x, 0, btnR) : collapse(x, 0, btnR);
// 创建点击区域和按钮图形
const hitArea = this.upsert('hit-area', 'circle', { cx: x, r: 8, fill: '#fff', cursor: 'pointer' }, this);
this.upsert('button', 'path', { stroke: '#54BECC', d, cursor: 'pointer', lineWidth: 1.4 }, hitArea);
}
// 重写render方法,添加更多自定义图形
render(attributes, container) {
super.render(attributes, container);
this.drawCollapseButton(attributes, container);
}
// 使用生命周期钩子添加事件监听
onCreate() {
this.shapeMap['hit-area'].addEventListener('click', () => {
const id = this.id;
const collapsed = !this.attributes.collapsed;
const { graph } = this.context;
if (collapsed) graph.collapseElement(id);
else graph.expandElement(id);
});
}
}
// 注册自定义 Combo
register(ExtensionCategory.COMBO, 'hexagon-combo', HexagonCombo);
// 创建图实例并使用自定义 Combo
const graph = new Graph({
container: 'container',
height: 250,
data: {
nodes: [
{ id: 'node1', combo: 'combo1', style: { x: 100, y: 100 } },
{ id: 'node2', combo: 'combo1', style: { x: 150, y: 150 } },
{ id: 'node3', combo: 'combo2', style: { x: 300, y: 100 } },
{ id: 'node4', combo: 'combo2', style: { x: 350, y: 150 } },
],
combos: [
{ id: 'combo1', data: { label: 'Hexagon 1' } },
{ id: 'combo2', data: { label: 'Hexagon 2' }, style: { collapsed: true } },
],
},
node: {
style: {
fill: '#91d5ff',
stroke: '#1890ff',
lineWidth: 1,
},
},
combo: {
type: 'hexagon-combo',
style: {
padding: 20,
showCollapseButton: true,
labelText: (d) => d.data?.label,
labelPlacement: 'top',
},
},
behaviors: ['drag-element'],
});
graph.render();
```
### 第一步:编写自定义 Combo 类
```typescript
import { BaseCombo } from '@antv/g6';
import type { BaseComboStyleProps } from '@antv/g6';
// 定义按钮路径生成函数
const collapse = (x, y, r) => {
return [
['M', x - r, y],
['a', r, r, 0, 1, 0, r * 2, 0],
['a', r, r, 0, 1, 0, -r * 2, 0],
['M', x - r + 4, y],
['L', x + r - 4, y],
];
};
const expand = (x, y, r) => {
return [
['M', x - r, y],
['a', r, r, 0, 1, 0, r * 2, 0],
['a', r, r, 0, 1, 0, -r * 2, 0],
['M', x - r + 4, y],
['L', x - r + 2 * r - 4, y],
['M', x - r + r, y - r + 4],
['L', x, y + r - 4],
];
};
class HexagonCombo extends BaseCombo {
// 获取六边形的路径
protected getKeyPath(attributes: Required<BaseComboStyleProps>) {
const [width, height] = this.getKeySize(attributes);
const padding = 10;
const size = Math.min(width, height) + padding;
// 计算六边形的顶点
const points = [];
for (let i = 0; i < 6; i++) {
const angle = (Math.PI / 3) * i;
const x = (size / 2) * Math.cos(angle);
const y = (size / 2) * Math.sin(angle);
points.push([x, y]);
}
// 构建 SVG 路径
const path = [['M', points[0][0], points[0][1]]];
for (let i = 1; i < 6; i++) {
path.push(['L', points[i][0], points[i][1]]);
}
path.push(['Z']);
return path;
}
// 获取主图形样式,直接使用路径数据
protected getKeyStyle(attributes: Required<BaseComboStyleProps>) {
const style = super.getKeyStyle(attributes);
return {
...style,
d: this.getKeyPath(attributes),
fill: attributes.collapsed ? '#FF9900' : '#F04864',
fillOpacity: attributes.collapsed ? 0.5 : 0.2,
stroke: '#54BECC',
lineWidth: 2,
};
}
// 绘制主图形,使用 path 类型直接传入样式对象
protected drawKeyShape(attributes: Required<BaseComboStyleProps>, container: Group) {
return this.upsert('key', 'path', this.getKeyStyle(attributes), container);
}
// 绘制收起/展开按钮,使用 SVG 路径实现更精细的控制
protected drawCollapseButton(attributes: Required<BaseComboStyleProps>) {
const { collapsed } = attributes;
const [width] = this.getKeySize(attributes);
const btnR = 8;
const x = width / 2 + btnR;
const d = collapsed ? expand(x, 0, btnR) : collapse(x, 0, btnR);
// 创建点击区域和按钮图形
const hitArea = this.upsert('hit-area', 'circle', { cx: x, r: 8, fill: '#fff', cursor: 'pointer' }, this);
this.upsert('button', 'path', { stroke: '#54BECC', d, cursor: 'pointer', lineWidth: 1.4 }, hitArea);
}
// 使用生命周期钩子方法绑定事件
onCreate() {
this.shapeMap['hit-area'].addEventListener('click', () => {
const id = this.id;
const collapsed = !this.attributes.collapsed;
const { graph } = this.context;
if (collapsed) graph.collapseElement(id);
else graph.expandElement(id);
});
}
}
```
### 第二步:注册自定义 Combo
```js
import { ExtensionCategory } from '@antv/g6';
register(ExtensionCategory.COMBO, 'hexagon-combo', HexagonCombo);
```
### 第三步:应用自定义 Combo
```js
const graph = new Graph({
// ...其他配置
combo: {
type: 'hexagon-combo', // 使用注册时的名称
style: {
padding: 20,
showCollapseButton: true,
labelText: (d) => d.data?.label,
labelPlacement: 'top',
},
},
// 由于我们自己实现了折叠展开功能,这里只需要拖拽行为
behaviors: ['drag-element'],
});
```
🎉 恭喜!你已经创建了第一个自定义 Combo 。
## 更进一步:理解 Combo 绘制的原理
### Combo 与节点的区别
虽然 Combo 继承自 `BaseNode`,但有一些关键区别:
1. **自适应大小**: Combo 会根据内部元素自动计算合适的大小
2. **展开/收起状态**: Combo 有两种显示状态,并需要处理状态切换
3. **层级结构**: Combo 可以嵌套,形成层级关系
4. **内部元素管理**: Combo 需要管理其包含的节点和子 Combo
### 原子图形
G6 的 Combo 是由 [G 图形系统](https://g.antv.antgroup.com/) 提供的图形原子单元绘制而成。原子图形的介绍请参考 [元素 - 图形(可选)](/manual/element/shape/overview) 文档。
所有这些图形都可通过 `upsert()` 动态创建或更新,并自动管理图形状态和生命周期。
### 元素基类
开始自定义 Combo 之前,你需要了解 G6 元素基类中的一些重要属性和方法:
#### 属性
| 属性 | 类型 | 描述 |
| ---------- | ----------------------------- | -------------------------- |
| shapeMap | Record<string, DisplayObject> | 当前元素下所有图形的映射表 |
| animateMap | Record<string, IAnimation> | 当前元素下所有动画的映射表 |
#### 方法
#### `upsert(name, Ctor, style, container, hooks)`: 图形创建/更新
在创建自定义 Combo 时,你会频繁用到 `upsert` 方法。它是 "update or insert" 的缩写,负责添加或更新元素中的图形:
```typescript
upsert(key: string, Ctor: { new (...args: any[]): DisplayObject }, style: Record<string, any>, container: DisplayObject);
```
| 参数 | 类型 | 描述 |
| --------- | --------------------------------------- | --------------------------------------------------------------------------------------------------------------------------------------------------------------------------------------------------------------------------------------- |
| key | string | 图形的 key,即 `shapeMap` 中对应的 key。内置的 key 包括 `'key'` `'label'` `'halo'` `'icon'` `'port'` `'badge'`<br/> key 不应使用特殊符号,会基于该值转化为驼峰形式调用 `getXxxStyle` 和 `drawXxxShape` 方法(见 [元素约定](#元素约定)) |
| Ctor | { new (...args: any[]): DisplayObject } | 图形类 |
| style | Record<string, any> | 图形样式 |
| container | DisplayObject | 挂载图形的容器 |
例如,插入一个固定位置的紫色圆形:
```js
this.upsert(
'element-key', // 元素的唯一标识
'circle', // 图形类型,如 'rect', 'circle' 等
{ x: 100, y: 100, fill: '#a975f3' }, // 样式配置对象
container, // 父容器
);
```
为什么要使用 `upsert` 而不直接通过 `container.appendChild()` 创建图形?因为:
1. **性能更好**:当状态变化或数据更新时,会智能地复用已有图形,而不是删除再重建,大大提高了渲染性能
2. **代码更简洁**:不需要手动判断元素是否存在
3. **便于管理**:所有通过 `upsert` 创建的图形都会被记录在节点的 `shapeMap` 中,你可以通过 `this.getShape(key)` 轻松获取
#### `render(attributes, container)`: 渲染组合的主入口
每个自定义 Combo 类都必须实现 `render(attributes, container)` 方法,它定义了该组合如何被"绘制"出来。你可以在这里使用各种原子图形,组合出你想要的结构。
```typescript
render(style: Record<string, any>, container: Group): void;
```
| 参数 | 类型 | 描述 |
| --------- | ------------------- | -------- |
| style | Record<string, any> | 元素样式 |
| container | Group | 容器 |
#### `getShape(name)`: 获取已创建的图形
有时,你需要在创建后修改某个子图形的属性,或者让子图形之间有交互关联。这时,`getShape` 方法可以帮你获取之前通过 `upsert` 创建的任何图形:
**⚠️ 注意**:图形的顺序很重要,如果图形 B 依赖图形 A 的位置,必须确保 A 先创建
### 元素约定
- **使用约定属性**
组合中约定的元素属性包括:
- 通过 `this.getKeySize(attributes)` 获取组合的尺寸,考虑折叠状态和子元素
- 通过 `this.getContentBBox(attributes)` 获取内容区域的边界盒
- 通过 `this.getComboPosition(attributes)` 获取组合的当前位置,基于状态和子元素
- **采用 `getXxxStyle` 和 `drawXxxShape` 配对的方式进行图形绘制**
`getXxxStyle` 用于获取图形样式,`drawXxxShape` 用于绘制图形。通过该方式创建的图形支持自动执行动画。
> 其中 `Xxx` 是调用 [upsert](#方法) 方法时传入的 key 的驼峰形式。
- **可通过 `this.context` 访问 Graph 上下文**
### 生命周期钩子
提供了以下生命周期钩子函数,你可以在自定义 Combo 中重写这些方法,在关键时刻执行特定逻辑:
| 钩子函数 | 触发时机 | 典型用途 |
| ----------- | -------------------------- | -------------------------------------------- |
| `onCreate` | 当组合创建后完成入场动画时 | 绑定交互事件、初始化组合状态、添加外部监听器 |
| `onUpdate` | 当组合更新后完成更新动画时 | 更新依赖数据、调整相关元素、触发联动效果 |
| `onDestroy` | 当组合完成退场动画并销毁后 | 清理资源、移除外部监听器、执行销毁通知 |
### 状态响应
G6 元素设计中最强大的一点,是可以将 **"状态响应"** 与 **"绘制逻辑"** 分离。
你可以在组合配置中定义每种状态下的样式:
```js
combo: {
type: 'custom-combo',
style: {
fill: '#f0f2f5',
stroke: '#d9d9d9'
},
state: {
selected: {
stroke: '#1890ff',
lineWidth: 2,
shadowColor: 'rgba(24,144,255,0.2)',
shadowBlur: 15,
},
hover: {
fill: '#e6f7ff',
},
},
}
```
切换状态的方法:
```js
graph.setElementState(comboId, ['selected']);
```
这个状态会传入到 `render()` 方法的 `attributes` 中,由内部系统合并后的结果自动应用在图形上。
也可以根据状态自定义渲染逻辑:
```typescript
protected getKeyStyle(attributes: Required<BaseComboStyleProps>) {
const style = super.getKeyStyle(attributes);
// 根据状态调整样式
if (attributes.states?.includes('selected')) {
return {
...style,
stroke: '#1890ff',
lineWidth: 2,
shadowColor: 'rgba(24,144,255,0.2)',
shadowBlur: 15,
};
}
return style;
}
```
Combo Skill
packages/site/docs/manual/element/combo/overview.en.md anthropic-skill ~2,060 tokens---
title: Combo Overview
order: 0
---
## What is a Combo
A Combo, short for Combination, is a special type of graph element in G6 that can contain nodes and sub-combos, similar to the concept of "groups" or "containers." It is typically used to represent set relationships, such as a department containing multiple employees or a city containing multiple regions.
<image width="450" src="https://mdn.alipayobjects.com/huamei_qa8qxu/afts/img/A*zPAzSZ3XxpUAAAAAAAAAAAAADmJ7AQ/original" />
:::warning{title=Note}
It is not recommended to use Combos in **tree graphs**. The layout mechanism of tree graphs is incompatible with that of Combos, which can lead to node misalignment or style confusion.
:::
G6 has built-in Combos including `circle` (circular combo) and `rect` (rectangular combo), as shown in the images below:
<img src="https://mdn.alipayobjects.com/huamei_qa8qxu/afts/img/A*Kbk1S5pzSY0AAAAAAAAAAAAADmJ7AQ/original" width="200" />
<img src="https://mdn.alipayobjects.com/huamei_qa8qxu/afts/img/A*PKtgSZzmb3YAAAAAAAAAAAAADmJ7AQ/original" width="200" />
## Data Structure
When defining a Combo, you need to add a `combos` field to the graph's data object. Each Combo is an object with the following structure:
| Attribute | Description | Type | Default | Required |
| --------- | ------------------------------------------------------------------------------------------------------ | -------------- | ------- | -------- |
| id | Unique identifier of the combo | string | - | ✓ |
| type | Combo type, name of built-in combo type or custom combo name, such as `circle` or `rect` | string | - | |
| data | Combo data, used to store custom data of the combo, accessible via callback functions in style mapping | object | - | |
| style | Combo style | object | - | |
| states | Initial states of the combo | string[] | - | |
| combo | Parent combo ID. If there is no parent combo, it is null | string \| null | - | |
An example of a data item in the `combos` array:
```json
{
"id": "combo1",
"type": "circle",
"data": { "groupName": "Group A" },
"style": { "fill": "lightblue", "stroke": "blue", "collapsed": true },
"states": [],
"combo": null
}
```
To assign a node to a Combo, you can add a `combo` field to the node data:
```json
{
"nodes": [{ "id": "node1", "combo": "comboA" }], // node1 belongs to comboA
"combos": [{ "id": "comboA" }] // define comboA
}
```
## Configuration Methods
There are three ways to configure Combos, listed in order of priority from highest to lowest:
- Use `graph.setCombo()` for dynamic configuration
- Global configuration during graph instantiation
- Dynamic properties in data
These configuration methods can be used simultaneously. When there are identical configuration items, the method with higher priority will override the one with lower priority.
### Using `graph.setCombo()`
You can dynamically set the style mapping logic of Combos using `graph.setCombo()` after the graph instance is created.
This method must be called before `graph.render()` to take effect and has the highest priority.
```js
graph.setCombo({
style: {
type: 'circle',
style: { fill: '#7FFFD4', stroke: '#5CACEE', lineWidth: 2 },
},
});
graph.render();
```
### Global Configuration During Graph Instantiation
You can configure Combo style mapping globally during graph instantiation. This configuration will apply to all Combos.
```js
import { Graph } from '@antv/g6';
const graph = new Graph({
// Specify combo type and combo style type in the combo configuration
combo: {
type: 'circle',
style: { fill: '#7FFFD4', stroke: '#5CACEE', lineWidth: 2 },
},
});
```
### Dynamic Configuration in Data
If you need different configurations for different Combos, you can write the configuration into the Combo data. This configuration method can be directly written into the data in the form of the following code:
```typescript
// Specify combo type and combo style type in the data
const data = {
combos: [
{
id: 'combo-1',
type: 'circle',
style: { size: 100, stroke: 'orange' },
},
],
};
```
### Adjusting Priority
If you want the configuration in the data to have a higher priority than the global configuration, you can take the following approach:
```js
const data = {
combos: [
{
id: 'combo-1',
type: 'circle',
style: { size: 100, stroke: 'orange' },
},
],
};
const graph = new Graph({
combo: {
type: (d) => d.type || 'rect',
style: {
stroke: (d) => d.style.stroke || 'blue',
},
},
});
```
## Example
```js | ob { inject: true }
import { Graph, register, Rect, ExtensionCategory } from '@antv/g6';
const data = {
nodes: [
{
id: 'node1',
combo: 'combo1',
style: { x: 245, y: 200 },
},
{
id: 'node2',
combo: 'combo1',
style: { x: 210, y: 250 },
},
{
id: 'node3',
combo: 'combo1',
style: { x: 280, y: 245 },
},
{
id: 'node4',
combo: 'combo2',
style: { x: 400, y: 165 },
},
{
id: 'node5',
combo: 'combo2',
style: { x: 450, y: 162 },
},
{
id: 'node6',
combo: 'combo3',
style: { x: 425, y: 300 },
},
{
id: 'node7',
combo: 'combo3',
style: { x: 360, y: 332 },
},
],
edges: [],
combos: [
{
id: 'combo1',
combo: 'combo3',
data: { label: 'Combo A' },
},
{
id: 'combo2',
combo: 'combo3',
data: { label: 'Combo B' },
},
{
id: 'combo3',
data: { label: 'Combo C' },
},
{
id: 'combo4',
data: { label: 'Combo D' },
style: { x: 58, y: 248 },
},
],
};
const graph = new Graph({
container: 'container',
height: 450,
data,
node: {
style: {
labelText: (d) => d.id,
labelPlacement: 'center',
labelFill: '#fff',
labelFontSize: 10,
},
},
combo: {
type: 'circle',
style: {
padding: 2,
labelText: (d) => d.data.label,
labelPlacement: 'top',
},
},
behaviors: [
'collapse-expand',
{
type: 'drag-element',
dropEffect: 'link',
},
],
});
graph.render();
```
## Combo Interaction
Simply rendering a Combo does not provide much practical value; it is only when a series of interactive operations are supported that the value of Combos can be maximized.
In G6, we have built-in interactions such as `drag-element` and `collapse-expand`.
#### drag-element
Supports dragging nodes and Combos. During the dragging of a Combo, the positions of nodes and edges within the Combo will dynamically change. After dragging is complete, the relative positions of the Combo and nodes remain unchanged. You can also change the affiliation of the Combo during dragging by setting `dropEffect: 'link'`.
<img src="https://mdn.alipayobjects.com/huamei_qa8qxu/afts/img/A*rJiHQahxgj4AAAAAAAAAAAAAemJ7AQ/original" width="400" />
#### collapse-expand
Supports double-clicking a Combo to collapse and expand it. After collapsing a Combo, all nodes within the Combo are hidden. If there are connections between external nodes and nodes within the Combo, all connections will connect to the Combo.
<img src="https://mdn.alipayobjects.com/huamei_qa8qxu/afts/img/A*PfnsSZSkRagAAAAAAAAAAAAAemJ7AQ/original" width="400" />
## Custom Combos
When built-in Combos cannot meet your needs, G6 provides powerful customization capabilities:
- Extend built-in Combos
- Create new Combo types
Unlike Combos, custom Combos need to be registered before use. For detailed tutorials, please refer to the [Custom Combo](/en/manual/element/combo/custom-combo) documentation.
Combo Skill
packages/site/docs/manual/element/combo/overview.zh.md anthropic-skill ~1,415 tokens---
title: 组合总览
order: 0
---
## 什么是组合
组合(Combo) 全称为 Combination,是 G6 中的一种特殊的图元素,它可以包含节点和子组合,类似“群组”或“容器”的概念。它通常用于表示集合关系,例如一个部门包含多个员工,一个城市包含多个区域等。
<image width="450" src="https://mdn.alipayobjects.com/huamei_qa8qxu/afts/img/A*zPAzSZ3XxpUAAAAAAAAAAAAADmJ7AQ/original" />
:::warning{title=注意}
不推荐在**树图**中使用 Combo。因为树图的布局与 Combo 的布局机制不兼容,容易导致节点错位或样式混乱。
:::
G6 的内置 Combo 包括 `circle`(圆形组合)和 `rect` (矩形组合) 两种类型,分别如下图所示:
<img src="https://mdn.alipayobjects.com/huamei_qa8qxu/afts/img/A*Kbk1S5pzSY0AAAAAAAAAAAAADmJ7AQ/original" width="200" />
<img src="https://mdn.alipayobjects.com/huamei_qa8qxu/afts/img/A*PKtgSZzmb3YAAAAAAAAAAAAADmJ7AQ/original" width="200" />
## 数据结构
定义 Combo 时,需要在图的数据对象中添加 `combos` 字段,每个 Combo 是一个对象,结构如下:
| 属性 | 描述 | 类型 | 默认值 | 必选 |
| ------ | ----------------------------------------------------------------------- | -------------- | ------ | ---- |
| id | 组合的唯一标识符 | string | - | ✓ |
| type | 组合类型,内置组合类型名称或者自定义组合名称,比如 `circle` 或者 `rect` | string | - | |
| data | 组合数据,用于存储组合的自定义数据,可以在样式映射中通过回调函数获取 | object | - | |
| style | 组合样式 | object | - | |
| states | 组合初始状态 | string[] | - | |
| combo | 组合的父组合 ID。如果没有父组合,则为 null | string \| null | - | |
`combos` 数组中一个数据项的示例:
```json
{
"id": "combo1",
"type": "circle",
"data": { "groupName": "Group A" },
"style": { "fill": "lightblue", "stroke": "blue", "collapsed": true },
"states": [],
"combo": null
}
```
要将节点归属到某个 Combo,可以在节点数据中添加 `combo` 字段:
```json
{
"nodes": [{ "id": "node1", "combo": "comboA" }], // node1 属于 comboA
"combos": [{ "id": "comboA" }] // 定义 comboA
}
```
## 配置方法
配置 Combo 的方式有三种,按优先级从高到低如下:
- 使用 `graph.setCombo()` 动态配置
- 实例化图时全局配置
- 在数据中动态属性
这几个配置方法可以同时使用。有相同的配置项时,优先级高的方式将会覆盖优先级低的。
### 使用 `graph.setCombo()`
可在图实例创建后,使用 `graph.setCombo()` 动态设置 Combo 的样式映射逻辑。
该方法需要在 `graph.render()` 之前调用才会生效,并拥有最高优先级。
```js
graph.setCombo({
style: {
type: 'circle',
style: { fill: '#7FFFD4', stroke: '#5CACEE', lineWidth: 2 },
},
});
graph.render();
```
### 实例化图时全局配置
在实例化图时可以通过 `combo` 配置 Combo 样式映射,这里的配置是全局的配置,将会在所有 Combo 上生效。
```js
import { Graph } from '@antv/g6';
const graph = new Graph({
// 在组合配置中指定组合类型以及组合样式类型
combo: {
type: 'circle',
style: { fill: '#7FFFD4', stroke: '#5CACEE', lineWidth: 2 },
},
});
```
### 在数据中动态配置
如果需要为不同 Combo 进行不同的配置,可以将配置写入到 Combo 数据中。这种配置方式可以通过下面代码的形式直接写入数据:
```typescript
// 在数据中指定组合类型以及组合样式类型
const data = {
combos: [
{
id: 'combo-1',
type: 'circle',
style: { size: 100, stroke: 'orange' },
},
],
};
```
### 调整优先级
如果你想让数据中配置的优先级高于全局配置,你可以采取以下方式:
```js
const data = {
combos: [
{
id: 'combo-1',
type: 'circle',
style: { size: 100, stroke: 'orange' },
},
],
};
const graph = new Graph({
combo: {
type: (d) => d.type || 'rect',
style: {
stroke: (d) => d.style.stroke || 'blue',
},
},
});
```
## 示例
```js | ob { inject: true }
import { Graph, register, Rect, ExtensionCategory } from '@antv/g6';
const data = {
nodes: [
{
id: 'node1',
combo: 'combo1',
style: { x: 245, y: 200 },
},
{
id: 'node2',
combo: 'combo1',
style: { x: 210, y: 250 },
},
{
id: 'node3',
combo: 'combo1',
style: { x: 280, y: 245 },
},
{
id: 'node4',
combo: 'combo2',
style: { x: 400, y: 165 },
},
{
id: 'node5',
combo: 'combo2',
style: { x: 450, y: 162 },
},
{
id: 'node6',
combo: 'combo3',
style: { x: 425, y: 300 },
},
{
id: 'node7',
combo: 'combo3',
style: { x: 360, y: 332 },
},
],
edges: [],
combos: [
{
id: 'combo1',
combo: 'combo3',
data: { label: 'Combo A' },
},
{
id: 'combo2',
combo: 'combo3',
data: { label: 'Combo B' },
},
{
id: 'combo3',
data: { label: 'Combo C' },
},
{
id: 'combo4',
data: { label: 'Combo D' },
style: { x: 58, y: 248 },
},
],
};
const graph = new Graph({
container: 'container',
height: 450,
data,
node: {
style: {
labelText: (d) => d.id,
labelPlacement: 'center',
labelFill: '#fff',
labelFontSize: 10,
},
},
combo: {
type: 'circle',
style: {
padding: 2,
labelText: (d) => d.data.label,
labelPlacement: 'top',
},
},
behaviors: [
'collapse-expand',
{
type: 'drag-element',
dropEffect: 'link',
},
],
});
graph.render();
```
## Combo 交互
只是简单地将 Combo 渲染出来,并没有多大的实用价值,只有支持一系列的交互操作后,才能最大程度地体现 Combo 的价值。
在 G6 中,我们内置了 `drag-element`、`collapse-expand` 三个交互。
#### drag-element
支持拖动节点和 Combo。拖动 Combo 过程中,会动态改变 Combo 中节点和边的位置,在拖拽完成以后,保持 Combo 和节点的相对位置不变。还可以通过设置 `dropEffect: 'link'` 在拖拽时改变 Combo 的从属关系。
<img src="https://mdn.alipayobjects.com/huamei_qa8qxu/afts/img/A*rJiHQahxgj4AAAAAAAAAAAAAemJ7AQ/original" width="400" />
#### collapse-expand
支持双击 Combo 收起和展开 Combo ,收起 Combo 以后,隐藏 Combo 中的所有节点,外部节点和 Combo 中节点有连线的情况下,所有连接会连接到 Combo 上面。
<img src="https://mdn.alipayobjects.com/huamei_qa8qxu/afts/img/A*PfnsSZSkRagAAAAAAAAAAAAAemJ7AQ/original" width="400" />
## 自定义组合
当内置组合无法满足需求时,G6 提供了强大的自定义能力:
- 继承内置组合进行扩展
- 创建全新的组合类型
与组合不同,自定义组合需要先注册后使用。详细教程请参考 [自定义组合](/manual/element/combo/custom-combo) 文档。
Combo Skill
packages/site/docs/manual/element/combo/RectCombo.en.md anthropic-skill ~232 tokens---
title: Rect Combo
order: 3
---
## Overview
The rectangular combo organizes content with right-angle boundaries, supporting strict hierarchical structures.
Applicable scenarios:
- **System Architecture Diagrams**: Such as service layering within system architecture, and subdivisions within each layer.
- **Geographical Area Division**: Such as cities containing multiple areas, where the rectangular combo can intuitively display administrative boundaries or functional divisions.
## Online Experience
<embed src="@/common/api/elements/combos/rect-combo.md"></embed>
## Style Configuration
> If the element has its specific attributes, we will list them below. For all general style attributes, see [BaseCombo](/en/manual/element/combo/base-combo)
## Example
The following example is a simple microservice architecture service layer:
<embed src="@/common/api/elements/combos/rect-combo-architecture.md"></embed>
Combo Skill
packages/site/docs/manual/element/combo/RectCombo.zh.md anthropic-skill ~108 tokens---
title: 矩形组合 Rect
order: 3
---
## 概述
矩形组合以直角边界组织内容,支持严格的层级结构。
适用场景:
- **系统架构图**:如系统架构里面的服务分层,以及每层服务里面的细分等。
- **地理区域划分**:如城市包含多个区域,矩形组合能直观展示行政边界或功能分区。
## 在线体验
<embed src="@/common/api/elements/combos/rect-combo.md"></embed>
## 样式配置
> 如果元素有其特定的属性,我们将在下面列出。对于所有的通用样式属性,见 [BaseCombo](/manual/element/combo/base-combo)
## 示例
以下示例为简单的微服务架构服务层:
<embed src="@/common/api/elements/combos/rect-combo-architecture.md"></embed>
Edge Skill
packages/site/docs/manual/element/edge/BaseEdge.en.md anthropic-skill ~12,716 tokens---
title: Edge Common Configuration
order: 1
---
This document introduces the built-in edge common property configurations.
## EdgeOptions
```js {5-9}
import { Graph } from '@antv/g6';
const graph = new Graph({
edge: {
type: 'line', // Edge type
style: {}, // Edge style
state: {}, // State styles
palette: {}, // Palette configuration
animation: {}, // Animation configuration
},
});
```
| Property | Description | Type | Default | Required |
| --------- | -------------------------------------------------------------- | ----------------------- | ------- | -------- |
| type | Edge type, built-in edge type name or custom edge name | [Type](#type) | `line` | |
| style | Edge style configuration, including color, thickness, etc. | [Style](#style) | - | |
| state | Style configuration for different states | [State](#state) | - | |
| palette | Define edge palette for mapping colors based on different data | [Palette](#palette) | - | |
| animation | Define edge animation effects | [Animation](#animation) | - | |
## Type
Specify the edge type, built-in edge type name or custom edge name. Default is `line` (straight line edge). **⚠️ Note**: This determines the shape of the main graphic.
```js {3}
const graph = new Graph({
edge: {
type: 'polyline',
},
});
```
**⚠️ Dynamic Configuration Note**: The `type` property also supports dynamic configuration, allowing you to dynamically select edge types based on edge data:
```js
const graph = new Graph({
edge: {
// Static configuration
type: 'line',
// Dynamic configuration - arrow function form
type: (datum) => datum.data.edgeType || 'line',
// Dynamic configuration - regular function form (can access graph instance)
type: function (datum) {
console.log(this); // graph instance
return datum.data.importance > 5 ? 'polyline' : 'line';
},
},
});
```
Available values:
- `line`: [Straight line edge](/en/manual/element/edge/line)
- `polyline`: [Polyline edge](/en/manual/element/edge/polyline)
- `cubic`: [Cubic Bezier curve edge](/en/manual/element/edge/cubic)
- `cubic-horizontal`: [Horizontal cubic Bezier curve edge](/en/manual/element/edge/cubic-horizontal)
- `cubic-vertical`: [Vertical cubic Bezier curve edge](/en/manual/element/edge/cubic-vertical)
- `quadratic`: [Quadratic Bezier curve edge](/en/manual/element/edge/quadratic)
## Style
Define edge styles, including color, thickness, etc.
```js {3}
const graph = new Graph({
edge: {
style: {},
},
});
```
**⚠️ Dynamic Configuration Note**: All the following style properties support dynamic configuration, meaning you can pass functions to dynamically calculate property values based on edge data:
```js
const graph = new Graph({
edge: {
style: {
// Static configuration
stroke: '#1783FF',
// Dynamic configuration - arrow function form
lineWidth: (datum) => (datum.data.isImportant ? 3 : 1),
// Dynamic configuration - regular function form (can access graph instance)
lineDash: function (datum) {
console.log(this); // graph instance
return datum.data.type === 'dashed' ? [5, 5] : [];
},
// Nested properties also support dynamic configuration
labelText: (datum) => `Edge: ${datum.id}`,
endArrow: (datum) => datum.data.hasArrow,
},
},
});
```
Where the `datum` parameter is the edge data object (`EdgeData`), containing all data information of the edge.
A complete edge consists of the following parts:
<img width="320" src="https://mdn.alipayobjects.com/huamei_qa8qxu/afts/img/A*cVHVQJKLOlgAAAAAAAAAAAAADmJ7AQ/original" />
- `key`: The main graphic of the edge, representing the main path of the edge, such as straight lines, curves, etc.
- `label`: Text label, usually used to display the name or description of the edge
- `badge`: Badge on the edge
- `halo`: The halo effect graphic displayed around the main graphic
- `startArrow`: Arrow at the starting end of the edge
- `endArrow`: Arrow at the ending end of the edge
The following style configurations will be explained by atomic graphics in order:
### Main Graphic Styles
The main graphic is the core part of the edge, defining the basic path and appearance of the edge. Here are common configuration scenarios:
#### Basic Style Configuration
Set the basic appearance of the edge:
```js | ob { inject: true }
import { Graph } from '@antv/g6';
const graph = new Graph({
container: 'container',
width: 240,
height: 100,
autoFit: 'center',
data: {
nodes: [
{ id: 'node1', style: { x: 60, y: 40 } },
{ id: 'node2', style: { x: 180, y: 40 } },
],
edges: [{ source: 'node1', target: 'node2' }],
},
edge: {
style: {
stroke: '#5B8FF9', // Blue edge
lineWidth: 2, // Edge width
},
},
});
graph.render();
```
#### Dashed Line Style
Create edges with dashed line style:
```js | ob { inject: true }
import { Graph } from '@antv/g6';
const graph = new Graph({
container: 'container',
width: 240,
height: 100,
autoFit: 'center',
data: {
nodes: [
{ id: 'node1', style: { x: 60, y: 40 } },
{ id: 'node2', style: { x: 180, y: 40 } },
],
edges: [{ source: 'node1', target: 'node2' }],
},
edge: {
style: {
stroke: '#F5222D',
lineWidth: 2,
lineDash: [6, 4], // Dashed line style
lineDashOffset: 0,
},
},
});
graph.render();
```
#### Shadow Effect
Add shadow effect to edges:
```js | ob { inject: true }
import { Graph } from '@antv/g6';
const graph = new Graph({
container: 'container',
width: 240,
height: 100,
autoFit: 'center',
data: {
nodes: [
{ id: 'node1', style: { x: 60, y: 40 } },
{ id: 'node2', style: { x: 180, y: 40 } },
],
edges: [{ source: 'node1', target: 'node2' }],
},
edge: {
style: {
stroke: '#722ED1',
lineWidth: 3,
shadowColor: 'rgba(114, 46, 209, 0.3)',
shadowBlur: 8,
shadowOffsetX: 2,
shadowOffsetY: 2,
},
},
});
graph.render();
```
The following is the complete main graphic style configuration:
| Property | Description | Type | Default | Required |
| ------------------------------- | ---------------------------------------------------------------------------------------------------------------------------------- | --------------------- | --------- | -------- |
| cursor | Mouse cursor style when hovering over edge, [options](#cursor) | string | `default` | |
| increasedLineWidthForHitTesting | When lineWidth is small, the interactive area also becomes small. We can increase this area to make "thin lines" easier to pick up | number | 0 | |
| lineDash | Edge dash line style | number[] | - | |
| lineDashOffset | Edge dash line offset | number | 0 | |
| lineWidth | Edge width | number | 1 | |
| opacity | Edge opacity | number \| string | 1 | |
| pointerEvents | How edge responds to pointer events, [options](#pointerevents) | string | `auto` | |
| shadowBlur | Edge shadow blur | number | - | |
| shadowColor | Edge shadow color | string | - | |
| shadowOffsetX | Edge shadow offset in x direction | number \| string | - | |
| shadowOffsetY | Edge shadow offset in y direction | number \| string | - | |
| shadowType | Edge shadow type | `inner` \| `outer` | `outer` | |
| sourcePort | Connection port at the source end of the edge | string | - | |
| stroke | Edge color | string | `#000` | |
| strokeOpacity | Edge color opacity | number \| string | 1 | |
| targetPort | Connection port at the target end of the edge | string | - | |
| transform | Transform property allows you to rotate, scale, skew, or translate the given edge | string | - | |
| transformOrigin | The center of rotation and scaling, also known as the transform center | string | - | |
| visibility | Whether the edge is visible | `visible` \| `hidden` | `visible` | |
| zIndex | Edge rendering layer | number | 1 | |
#### PointerEvents
The `pointerEvents` property controls how graphics respond to interaction events. Refer to [MDN documentation](https://developer.mozilla.org/en-US/docs/Web/CSS/pointer-events).
Available values: `visible` | `visiblepainted` | `visiblestroke` | `non-transparent-pixel` | `visiblefill` | `visible` | `painted` | `fill` | `stroke` | `all` | `none` | `auto` | `inherit` | `initial` | `unset`
In short, both `stroke` and `visibility` can independently or in combination affect hit testing behavior. Currently supports the following keywords:
- **`auto`**: Default value, equivalent to `visiblepainted`
- **`none`**: Never becomes a target for responding to events
- **`visiblepainted`**: Responds to events only when the following conditions are met:
- `visibility` is set to `visible`, i.e., the graphic is visible
- Triggered in the graphic stroke area while `stroke` takes a non-`none` value
- **`visiblestroke`**: Responds to events only when the following conditions are met:
- `visibility` is set to `visible`, i.e., the graphic is visible
- Triggered in the graphic stroke area, not affected by `stroke` value
- **`visible`**: Responds to events only when the following conditions are met:
- `visibility` is set to `visible`, i.e., the graphic is visible
- Triggered in the graphic stroke area, not affected by `stroke` value
- **`painted`**: Responds to events only when the following conditions are met:
- Triggered in the graphic stroke area while `stroke` takes a non-`none` value
- Not affected by `visibility` value
- **`stroke`**: Responds to events only when the following conditions are met:
- Triggered in the graphic stroke area, not affected by `stroke` value
- Not affected by `visibility` value
- **`all`**: Responds to events as long as entering the graphic stroke area, not affected by `stroke` or `visibility` values
**Usage Examples:**
```js
// Example 1: Only stroke area responds to events
const graph = new Graph({
edge: {
style: {
stroke: '#000',
lineWidth: 2,
pointerEvents: 'stroke', // Only stroke responds to events
},
},
});
// Example 2: Completely non-responsive to events
const graph = new Graph({
edge: {
style: {
pointerEvents: 'none', // Edge does not respond to any events
},
},
});
```
#### Cursor
Available values: `auto` | `default` | `none` | `context-menu` | `help` | `pointer` | `progress` | `wait` | `cell` | `crosshair` | `text` | `vertical-text` | `alias` | `copy` | `move` | `no-drop` | `not-allowed` | `grab` | `grabbing` | `all-scroll` | `col-resize` | `row-resize` | `n-resize` | `e-resize` | `s-resize` | `w-resize` | `ne-resize` | `nw-resize` | `se-resize` | `sw-resize` | `ew-resize` | `ns-resize` | `nesw-resize` | `nwse-resize` | `zoom-in` | `zoom-out`
### Label Styles
Labels are used to display text information for edges, supporting various style configurations and layout options. Here are common usage scenarios:
#### Basic Text Label
The simplest text label configuration:
```js | ob { inject: true }
import { Graph } from '@antv/g6';
const graph = new Graph({
container: 'container',
width: 240,
height: 120,
autoFit: 'center',
data: {
nodes: [
{ id: 'node1', style: { x: 60, y: 60 } },
{ id: 'node2', style: { x: 180, y: 60 } },
],
edges: [{ source: 'node1', target: 'node2' }],
},
edge: {
style: {
labelText: 'Edge Label',
labelFill: '#262626',
labelFontSize: 12,
labelPlacement: 'center',
},
},
});
graph.render();
```
#### Multi-line Text Label
When text is long, you can set automatic line wrapping:
```js | ob { inject: true }
import { Graph } from '@antv/g6';
const graph = new Graph({
container: 'container',
width: 240,
height: 120,
autoFit: 'center',
data: {
nodes: [
{ id: 'node1', style: { x: 60, y: 60 } },
{ id: 'node2', style: { x: 180, y: 60 } },
],
edges: [{ source: 'node1', target: 'node2' }],
},
edge: {
style: {
labelText: 'This is a very long edge label that needs line wrapping',
labelWordWrap: true,
labelMaxWidth: '200%',
labelMaxLines: 2,
labelTextOverflow: 'ellipsis',
labelFill: '#434343',
labelPlacement: 'center',
labelTextAlign: 'center',
},
},
});
graph.render();
```
#### Label with Background
Add background to labels for better readability:
```js | ob { inject: true }
import { Graph } from '@antv/g6';
const graph = new Graph({
container: 'container',
width: 240,
height: 120,
autoFit: 'center',
data: {
nodes: [
{ id: 'node1', style: { x: 60, y: 60 } },
{ id: 'node2', style: { x: 180, y: 60 } },
],
edges: [{ source: 'node1', target: 'node2' }],
},
edge: {
style: {
labelText: 'Important Connection',
labelBackground: true,
labelBackgroundFill: 'rgba(250, 140, 22, 0.1)',
labelBackgroundRadius: 6,
labelPadding: [4, 8],
labelFill: '#D4380D',
labelFontWeight: 'bold',
labelPlacement: 'center',
},
},
});
graph.render();
```
#### Auto-rotating Label
Labels can automatically rotate to align with edge direction:
```js | ob { inject: true }
import { Graph } from '@antv/g6';
const graph = new Graph({
container: 'container',
width: 240,
height: 120,
autoFit: 'center',
data: {
nodes: [
{ id: 'node1', style: { x: 60, y: 30 } },
{ id: 'node2', style: { x: 180, y: 90 } },
],
edges: [{ source: 'node1', target: 'node2' }],
},
edge: {
style: {
labelText: 'Auto Rotate',
labelAutoRotate: true, // Auto rotate
labelFill: '#1890FF',
labelFontWeight: 'bold',
labelPlacement: 'center',
},
},
});
graph.render();
```
The following is the complete label style configuration:
| Property | Description | Type | Default | Required |
| ------------------------ | --------------------------------------------------------------------------------------------------------------- | --------------------------------------------------------------------------- | --------- | -------- |
| label | Whether to show edge label | boolean | true | |
| labelAutoRotate | Whether edge label automatically rotates to align with edge direction | boolean | true | |
| labelCursor | Mouse cursor style when hovering over edge label, [options](#cursor) | string | `default` | |
| labelFill | Edge label text color | string | - | |
| labelFontFamily | Edge label font family | string | - | |
| labelFontSize | Edge label font size | number | 12 | |
| labelFontStyle | Edge label font style | `normal` \| `italic` \| `oblique` | - | |
| labelFontVariant | Edge label font variant | `normal` \| `small-caps` \| string | - | |
| labelFontWeight | Edge label font weight | `normal` \| `bold` \| `bolder` \| `lighter` \| number | - | |
| labelLeading | Line spacing | number | 0 | |
| labelLetterSpacing | Edge label letter spacing | number \| string | - | |
| labelLineHeight | Edge label line height | number \| string | - | |
| labelMaxLines | Edge label maximum lines | number | 1 | |
| labelMaxWidth | Edge label maximum width, [options](#labelmaxwidth) | number \| string | `200%` | |
| labelOffsetX | Edge label offset in x direction | number | 0 | |
| labelOffsetY | Edge label offset in y direction | number | 0 | |
| labelPadding | Edge label padding | number \| number[] | 0 | |
| labelPlacement | Edge label position relative to edge, [options](#labelplacement) | string \| number | `center` | |
| labelText | Edge label text content | `string` \| `(datum) => string` | - | |
| labelTextAlign | Edge label text horizontal alignment | `start` \| `center` \| `middle` \| `end` \| `left` \| `right` | `left` | |
| labelTextBaseline | Edge label text baseline | `top` \| `hanging` \| `middle` \| `alphabetic` \| `ideographic` \| `bottom` | - | |
| labelTextDecorationColor | Edge label text decoration line color | string | - | |
| labelTextDecorationLine | Edge label text decoration line | string | - | |
| labelTextDecorationStyle | Edge label text decoration line style | `solid` \| `double` \| `dotted` \| `dashed` \| `wavy` | - | |
| labelTextOverflow | Edge label text overflow handling | `clip` \| `ellipsis` \| string | - | |
| labelTextPath | Edge label text path | Path | - | |
| labelWordWrap | Whether to enable automatic line wrapping for edge labels. When enabled, text exceeding labelMaxWidth will wrap | boolean | false | |
| labelZIndex | Edge label rendering layer | number | 0 | |
#### LabelPlacement
Edge label position relative to the edge, can be set to:
- `start`: Label positioned at the starting point of the edge
- `center`: Label positioned at the center of the edge (default)
- `end`: Label positioned at the ending point of the edge
- `number`: Value range 0-1, representing the specific position ratio of the label on the edge, 0 for start position, 1 for end position
#### LabelMaxWidth
After enabling automatic line wrapping `labelWordWrap`, text exceeding this width will wrap:
- string: Represents the maximum width defined as a percentage relative to the edge length. For example, `50%` means the label width does not exceed half the edge length
- number: Represents the maximum width defined in pixels. For example, 100 means the label's maximum width is 100 pixels
For example, setting multi-line label text:
```json
{
"labelWordWrap": true,
"labelMaxWidth": 200,
"labelMaxLines": 3
}
```
### Label Background Styles
Label background is used to display the background of edge labels:
| Property | Description | Type | Default |
| ----------------------------- | ----------------------------------------------------------------------------------------------------------------------------------------------------------------- | ---------------------------------------- | --------- |
| labelBackground | Whether to show edge label background | boolean | false |
| labelBackgroundCursor | Edge label background mouse cursor style, [options](#cursor) | string | `default` |
| labelBackgroundFill | Edge label background fill color | string | - |
| labelBackgroundFillOpacity | Edge label background opacity | number | 1 |
| labelBackgroundHeight | Edge label background height | string \| number | - |
| labelBackgroundLineDash | Edge label background dash line configuration | number \| string \|(number \| string )[] | - |
| labelBackgroundLineDashOffset | Edge label background dash line offset | number | - |
| labelBackgroundLineWidth | Edge label background stroke line width | number | - |
| labelBackgroundRadius | Edge label background border radius <br> - number: Uniform radius for all corners <br> - number[]: Individual radius for each corner, auto-filled if insufficient | number \| number[] | 0 |
| labelBackgroundShadowBlur | Edge label background shadow blur | number | - |
| labelBackgroundShadowColor | Edge label background shadow color | string | - |
| labelBackgroundShadowOffsetX | Edge label background shadow X offset | number | - |
| labelBackgroundShadowOffsetY | Edge label background shadow Y offset | number | - |
| labelBackgroundStroke | Edge label background stroke color | string | - |
| labelBackgroundStrokeOpacity | Edge label background stroke opacity | number \| string | 1 |
| labelBackgroundVisibility | Edge label background visibility | `visible` \| `hidden` | - |
| labelBackgroundZIndex | Edge label background rendering layer | number | 1 |
### Halo Styles
Halo is an effect displayed around the edge main graphic, usually used for highlighting or indicating special states of the edge.
#### Basic Halo Effect
Add basic halo effect to edges:
```js | ob { inject: true }
import { Graph } from '@antv/g6';
const graph = new Graph({
container: 'container',
width: 240,
height: 100,
autoFit: 'center',
data: {
nodes: [
{ id: 'node1', style: { x: 60, y: 50 } },
{ id: 'node2', style: { x: 180, y: 50 } },
],
edges: [{ source: 'node1', target: 'node2' }],
},
edge: {
style: {
lineWidth: 2,
halo: true,
haloStroke: '#1890FF',
haloLineWidth: 6,
haloStrokeOpacity: 0.3,
},
},
});
graph.render();
```
The following is the complete halo style configuration:
| Property | Description | Type | Default | Required |
| ----------------- | ------------------------------------------------------------------------------------ | ---------------------- | ----------------------------------------- | -------- |
| halo | Whether to show edge halo | boolean | false | |
| haloCursor | Edge halo mouse cursor style, [options](#cursor) | string | `default` | |
| haloDraggable | Whether edge halo allows dragging | boolean | true | |
| haloDroppable | Whether edge halo allows receiving dragged elements | boolean | true | |
| haloFillRule | Edge halo fill rule | `nonzero` \| `evenodd` | - | |
| haloFilter | Edge halo filter | string | - | |
| haloLineWidth | Edge halo stroke width | number | 3 | |
| haloPointerEvents | Whether edge halo responds to pointer events, [options](#pointerevents) | string | `none` | |
| haloStroke | Edge halo stroke color, **this property sets the color of the halo around the edge** | string | Consistent with main graphic stroke color | |
| haloStrokeOpacity | Edge halo stroke opacity | number | 0.25 | |
| haloVisibility | Edge halo visibility | `visible` \| `hidden` | `visible` | |
| haloZIndex | Edge halo rendering layer | number | -1 | |
### Arrow Styles
Edges support adding arrows at the start and end points to indicate the directionality of the edge.
#### Basic Arrow
Add basic arrow to the end of the edge:
```js | ob { inject: true }
import { Graph } from '@antv/g6';
const graph = new Graph({
container: 'container',
width: 240,
height: 100,
autoFit: 'center',
data: {
nodes: [
{ id: 'node1', style: { x: 60, y: 50 } },
{ id: 'node2', style: { x: 180, y: 50 } },
],
edges: [{ source: 'node1', target: 'node2' }],
},
edge: {
style: {
stroke: '#1890FF',
lineWidth: 2,
endArrow: true, // End arrow
endArrowType: 'vee', // Arrow type
endArrowSize: 10, // Arrow size
},
},
});
graph.render();
```
#### Bidirectional Arrows
Add arrows to both ends of the edge:
```js | ob { inject: true }
import { Graph } from '@antv/g6';
const graph = new Graph({
container: 'container',
width: 240,
height: 100,
autoFit: 'center',
data: {
nodes: [
{ id: 'node1', style: { x: 60, y: 50 } },
{ id: 'node2', style: { x: 180, y: 50 } },
],
edges: [{ source: 'node1', target: 'node2' }],
},
edge: {
style: {
stroke: '#52C41A',
lineWidth: 2,
startArrow: true, // Start arrow
startArrowType: 'circle',
startArrowSize: 8,
endArrow: true, // End arrow
endArrowType: 'triangle',
endArrowSize: 10,
},
},
});
graph.render();
```
#### Custom Arrow Style
Customize arrow color and type:
```js | ob { inject: true }
import { Graph } from '@antv/g6';
const graph = new Graph({
container: 'container',
width: 240,
height: 100,
autoFit: 'center',
data: {
nodes: [
{ id: 'node1', style: { x: 60, y: 50 } },
{ id: 'node2', style: { x: 180, y: 50 } },
],
edges: [{ source: 'node1', target: 'node2' }],
},
edge: {
style: {
stroke: '#722ED1',
lineWidth: 3,
endArrow: true,
endArrowType: 'diamond', // Diamond arrow
endArrowSize: 12,
endArrowFill: '#FF4D4F', // Red arrow fill
endArrowStroke: '#722ED1', // Arrow stroke color
endArrowStrokeOpacity: 0.8,
},
},
});
graph.render();
```
#### Start Arrow Style Configuration
| Property | Description | Type | Default | Required |
| ----------------------- | ------------------------------------------------------- | ------------------------------------------------------------------------------------ | ---------------------------------- | -------- |
| startArrow | Whether to show edge start arrow | boolean | false | |
| startArrowCursor | Edge start arrow mouse cursor style, [options](#cursor) | string | `default` | |
| startArrowFill | Edge start arrow fill color | string | Default consistent with edge color | |
| startArrowFillOpacity | Edge start arrow fill opacity | number | 1 | |
| startArrowOffset | Edge start arrow offset | number | 0 | |
| startArrowSize | Edge start arrow size | number \| [number, number] | 10 | |
| startArrowStroke | Edge start arrow stroke color | string | Default consistent with edge color | |
| startArrowStrokeOpacity | Edge start arrow stroke opacity | number | 1 | |
| startArrowType | Edge start arrow type | `triangle` \| `circle` \| `diamond` \| `vee` \| `rect` \| `triangleRect` \| `simple` | `vee` | |
#### End Arrow Style Configuration
| Property | Description | Type | Default | Required |
| --------------------- | ----------------------------------------------------- | ------------------------------------------------------------------------------------ | ---------------------------------- | -------- |
| endArrow | Whether to show edge end arrow | boolean | false | |
| endArrowCursor | Edge end arrow mouse cursor style, [options](#cursor) | string | `default` | |
| endArrowFill | Edge end arrow fill color | string | Default consistent with edge color | |
| endArrowFillOpacity | Edge end arrow fill opacity | number | 1 | |
| endArrowOffset | Edge end arrow offset | number | 0 | |
| endArrowSize | Edge end arrow size | number \| [number, number] | 10 | |
| endArrowStroke | Edge end arrow stroke color | string | Default consistent with edge color | |
| endArrowStrokeOpacity | Edge end arrow stroke opacity | number | 1 | |
| endArrowType | Edge end arrow type | `triangle` \| `circle` \| `diamond` \| `vee` \| `rect` \| `triangleRect` \| `simple` | `vee` | |
### Loop Edge Styles
Loop edges are special edges where the start and end nodes are the same node.
#### Basic Loop Edge
Create a basic loop edge:
```js | ob { inject: true }
import { Graph } from '@antv/g6';
const graph = new Graph({
container: 'container',
width: 200,
height: 100,
autoFit: 'center',
data: {
nodes: [{ id: 'node1', style: { x: 100, y: 50 } }],
edges: [{ source: 'node1', target: 'node1' }],
},
edge: {
style: {
stroke: '#1890FF',
lineWidth: 2,
endArrow: true,
loopPlacement: 'top', // Loop position
loopDist: 30, // Loop size
},
},
});
graph.render();
```
#### Multiple Loop Edges
Create multiple loop edges at different positions for the same node:
```js | ob { inject: true }
import { Graph } from '@antv/g6';
const graph = new Graph({
container: 'container',
width: 200,
height: 120,
autoFit: 'center',
data: {
nodes: [{ id: 'node1', style: { x: 100, y: 60 } }],
edges: [
{ id: 'edge1', source: 'node1', target: 'node1' },
{ id: 'edge2', source: 'node1', target: 'node1' },
{ id: 'edge3', source: 'node1', target: 'node1' },
],
},
edge: {
style: {
lineWidth: 2,
endArrow: true,
loopPlacement: (datum) => {
const placements = ['top', 'right', 'bottom'];
return placements[parseInt(datum.id.slice(-1)) - 1];
},
loopDist: 25,
stroke: (datum) => {
const colors = ['#1890FF', '#52C41A', '#722ED1'];
return colors[parseInt(datum.id.slice(-1)) - 1];
},
},
},
});
graph.render();
```
The following is the complete loop edge style configuration:
| Property | Description | Type | Default | Required |
| ------------- | ------------------------------------------------------------------- | ---------------------------------------------------------------------------------------------------------------------------------------------------------------------- | ------------------------ | -------- |
| loop | Whether to enable loop edges | boolean | true | |
| loopClockwise | Whether to draw the loop clockwise | boolean | true | |
| loopDist | Distance from node edge to loop top, used to specify loop curvature | number | Default to max node size | |
| loopPlacement | Loop edge position | `left` \| `right` \| `top` \| `bottom` \| `left-top` \| `left-bottom` \| `right-top` \| `right-bottom` \| `top-left` \| `top-right` \| `bottom-left` \| `bottom-right` | `top` | |
## State
In some interactive behaviors, such as clicking to select an edge or hovering to activate an edge, it's simply marking certain states on that element. To reflect these states in the visual space seen by end users, we need to set different graphic element styles for different states to respond to changes in the state of that graphic element.
G6 provides several built-in states, including selected, highlight, active, inactive, and disabled. Additionally, it supports custom states to meet more specific needs. For each state, developers can define a set of style rules that will override the element's default styles.
<img width="520" src="https://mdn.alipayobjects.com/huamei_qa8qxu/afts/img/A*ebBlTpKu2WUAAAAAAAAAAAAADmJ7AQ/original" />
The data structure is as follows:
```typescript
type EdgeState = {
[state: string]: EdgeStyle;
};
```
For example, when an edge is in the `focus` state, you can add a halo with a width of 6 and orange color.
```js {4-9}
const graph = new Graph({
edge: {
state: {
focus: {
halo: true,
haloLineWidth: 6,
haloStroke: 'orange',
haloStrokeOpacity: 0.6,
},
},
},
});
```
The effect is shown in the following image:
```js | ob { pin: false, inject: true }
import { Graph } from '@antv/g6';
const graph = new Graph({
container: 'container',
width: 300,
height: 100,
autoFit: 'center',
data: {
nodes: [{ id: 'node1' }, { id: 'node2' }],
edges: [{ source: 'node1', target: 'node2', states: ['focus'] }],
},
edge: {
state: {
focus: {
halo: true,
haloLineWidth: 6,
haloStroke: 'orange',
},
},
},
layout: {
type: 'grid',
cols: 2,
},
});
graph.render();
```
## Animation
Define edge animation effects. Supports the following two configuration methods:
1. Disable all edge animations
```json
{
"edge": {
"animation": false
}
}
```
2. Configure stage animations
Stage animations refer to the animation effects when edges enter the canvas, update, or leave the canvas. Currently supported stages include:
- `enter`: Animation when edge enters the canvas
- `update`: Animation when edge updates
- `exit`: Animation when edge leaves the canvas
- `show`: Animation when edge shows from hidden state
- `hide`: Animation when edge hides
- `collapse`: Animation when edge collapses
- `expand`: Animation when edge expands
You can refer to [Animation Paradigm](/en/manual/animation/animation#动画范式) to use animation syntax to configure edges, such as:
```json
{
"edge": {
"animation": {
"update": [
{
"fields": ["stroke"], // Only animate stroke property during update
"duration": 1000, // Animation duration
"easing": "linear" // Easing function
}
]
}
}
}
```
You can also use built-in animation effects:
```json
{
"edge": {
"animation": {
"enter": "fade", // Use fade animation
"update": "path-in", // Use path animation
"exit": "fade" // Use fade animation
}
}
}
```
You can pass false to disable specific stage animations:
```json
{
"edge": {
"animation": {
"enter": false // Disable edge entrance animation
}
}
}
```
## Palette
Define the edge palette, which is a predefined edge color pool that is allocated according to rules and maps colors to the `stroke` property.
> For palette definitions, please refer to [Palette](/en/manual/theme/palette).
| Property | Description | Type | Default |
| -------- | --------------------------------------------------------------------------------------------------------------------- | ----------------------------- | ------- |
| color | Palette colors. If the palette is registered, you can directly specify its registration name, or accept a color array | string \| string[] | - |
| field | Specify the grouping field in element data. If not specified, defaults to using id as grouping field | string \| ((datum) => string) | `id` |
| invert | Whether to invert the palette | boolean | false |
| type | Specify current palette type. <br> - `group`: Discrete palette <br> - `value`: Continuous palette | `group` \| `value` | `group` |
For example, to assign edge colors to a group of data by the `direction` field, making edges of the same category have the same color:
```json
{
"edge": {
"palette": {
"type": "group",
"field": "direction",
"color": ["#F08F56", "#00C9C9", "#D580FF"]
}
}
}
```
The effect is shown in the following image:
```js | ob { pin: false, inject: true }
import { Graph } from '@antv/g6';
const graph = new Graph({
container: 'container',
width: 600,
height: 300,
data: {
nodes: new Array(6).fill(0).map((_, i) => ({ id: `node-${i + 1}` })),
edges: [
{ source: 'node-1', target: 'node-2', data: { direction: 'out' } },
{ source: 'node-1', target: 'node-3', data: { direction: 'out' } },
{ source: 'node-1', target: 'node-4', data: { direction: 'out' } },
{ source: 'node-5', target: 'node-1', data: { direction: 'in' } },
{ source: 'node-6', target: 'node-1', data: { direction: 'in' } },
],
},
layout: {
type: 'radial',
unitRadius: 120,
linkDistance: 120,
},
edge: {
style: {
endArrow: true,
},
palette: {
type: 'group',
field: 'direction',
color: ['#F08F56', '#00C9C9'],
},
},
});
graph.render();
```
You can also use default configuration:
```json
{
"edge": {
"palette": "tableau" // tableau is the palette name, colors assigned by ID by default
}
}
```
The effect is shown in the following image:
```js | ob { pin: false, inject: true }
import { Graph } from '@antv/g6';
const graph = new Graph({
container: 'container',
width: 600,
height: 300,
data: {
nodes: new Array(6).fill(0).map((_, i) => ({ id: `node-${i + 1}` })),
edges: [
{ source: 'node-1', target: 'node-2', data: { direction: 'out' } },
{ source: 'node-1', target: 'node-3', data: { direction: 'out' } },
{ source: 'node-1', target: 'node-4', data: { direction: 'out' } },
{ source: 'node-5', target: 'node-1', data: { direction: 'in' } },
{ source: 'node-6', target: 'node-1', data: { direction: 'in' } },
],
},
layout: {
type: 'radial',
unitRadius: 120,
linkDistance: 120,
},
edge: {
style: {
endArrow: true,
},
palette: 'tableau',
},
});
graph.render();
```
Edge Skill
packages/site/docs/manual/element/edge/BaseEdge.zh.md anthropic-skill ~9,599 tokens---
title: 边通用配置项
order: 1
---
本文介绍内置边通用属性配置。
## EdgeOptions
```js {5-9}
import { Graph } from '@antv/g6';
const graph = new Graph({
edge: {
type: 'line', // 边类型
style: {}, // 边样式
state: {}, // 状态样式
palette: {}, // 色板配置
animation: {}, // 动画配置
},
});
```
| 属性 | 描述 | 类型 | 默认值 | 必选 |
| --------- | -------------------------------------- | ----------------------- | ------ | ---- |
| type | 边类型,内置边类型名称或自定义边的名称 | [Type](#type) | `line` | |
| style | 边样式配置,包括颜色、粗细等 | [Style](#style) | - | |
| state | 不同状态下的样式配置 | [State](#state) | - | |
| palette | 定义边的色板,用于根据不同数据映射颜色 | [Palette](#palette) | - | |
| animation | 定义边的动画效果 | [Animation](#animation) | - | |
## Type
指定边类型,内置边类型名称或自定义边的名称。默认为 `line`(直线边)。**⚠️ 注意**:这里决定了主图形的形状。
```js {3}
const graph = new Graph({
edge: {
type: 'polyline',
},
});
```
**⚠️ 动态配置说明**:`type` 属性同样支持动态配置,可以根据边数据动态选择边类型:
```js
const graph = new Graph({
edge: {
// 静态配置
type: 'line',
// 动态配置 - 箭头函数形式
type: (datum) => datum.data.edgeType || 'line',
// 动态配置 - 普通函数形式(可访问 graph 实例)
type: function (datum) {
console.log(this); // graph 实例
return datum.data.importance > 5 ? 'polyline' : 'line';
},
},
});
```
可选值有:
- `line`:[直线边](/manual/element/edge/line)
- `polyline`:[折线边](/manual/element/edge/polyline)
- `cubic`:[三次贝塞尔曲线边](/manual/element/edge/cubic)
- `cubic-horizontal`:[水平三次贝塞尔曲线边](/manual/element/edge/cubic-horizontal)
- `cubic-vertical`:[垂直三次贝塞尔曲线边](/manual/element/edge/cubic-vertical)
- `quadratic`:[二次贝塞尔曲线边](/manual/element/edge/quadratic)
## Style
定义边的样式,包括颜色、粗细等。
```js {3}
const graph = new Graph({
edge: {
style: {},
},
});
```
**⚠️ 动态配置说明**:以下所有样式属性都支持动态配置,即可以传入函数来根据边数据动态计算属性值:
```js
const graph = new Graph({
edge: {
style: {
// 静态配置
stroke: '#1783FF',
// 动态配置 - 箭头函数形式
lineWidth: (datum) => (datum.data.isImportant ? 3 : 1),
// 动态配置 - 普通函数形式(可访问 graph 实例)
lineDash: function (datum) {
console.log(this); // graph 实例
return datum.data.type === 'dashed' ? [5, 5] : [];
},
// 嵌套属性也支持动态配置
labelText: (datum) => `边: ${datum.id}`,
endArrow: (datum) => datum.data.hasArrow,
},
},
});
```
其中 `datum` 参数为边数据对象 (`EdgeData`),包含边的所有数据信息。
一个完整的边由以下几部分构成:
<img width="320" src="https://mdn.alipayobjects.com/huamei_qa8qxu/afts/img/A*cVHVQJKLOlgAAAAAAAAAAAAADmJ7AQ/original" />
- `key` :边的主图形,表示边的主要路径,例如直线、曲线等;
- `label` :文本标签,通常用于展示边的名称或描述;
- `badge` :边上的徽标;
- `halo` :主图形周围展示的光晕效果的图形;
- `startArrow` :边起始端的箭头;
- `endArrow` :边结束端的箭头。
以下样式配置将按原子图形依次说明:
### 主图形样式
主图形是边的核心部分,定义了边的基本路径和外观。以下是常见的配置场景:
#### 基础样式配置
设置边的基本外观:
```js | ob { inject: true }
import { Graph } from '@antv/g6';
const graph = new Graph({
container: 'container',
width: 240,
height: 100,
data: {
nodes: [
{ id: 'node1', style: { x: 60, y: 40 } },
{ id: 'node2', style: { x: 180, y: 40 } },
],
edges: [{ source: 'node1', target: 'node2' }],
},
edge: {
style: {
stroke: '#5B8FF9', // 蓝色边
lineWidth: 2, // 边宽度
},
},
});
graph.render();
```
#### 虚线样式
创建带虚线样式的边:
```js | ob { inject: true }
import { Graph } from '@antv/g6';
const graph = new Graph({
container: 'container',
width: 240,
height: 100,
data: {
nodes: [
{ id: 'node1', style: { x: 60, y: 40 } },
{ id: 'node2', style: { x: 180, y: 40 } },
],
edges: [{ source: 'node1', target: 'node2' }],
},
edge: {
style: {
stroke: '#F5222D',
lineWidth: 2,
lineDash: [6, 4], // 虚线样式
lineDashOffset: 0,
},
},
});
graph.render();
```
#### 阴影效果
为边添加阴影效果:
```js | ob { inject: true }
import { Graph } from '@antv/g6';
const graph = new Graph({
container: 'container',
width: 240,
height: 100,
data: {
nodes: [
{ id: 'node1', style: { x: 60, y: 40 } },
{ id: 'node2', style: { x: 180, y: 40 } },
],
edges: [{ source: 'node1', target: 'node2' }],
},
edge: {
style: {
stroke: '#722ED1',
lineWidth: 3,
shadowColor: 'rgba(114, 46, 209, 0.3)',
shadowBlur: 8,
shadowOffsetX: 2,
shadowOffsetY: 2,
},
},
});
graph.render();
```
以下为完整的主图形样式配置:
| 属性 | 描述 | 类型 | 默认值 | 必选 |
| ------------------------------- | ----------------------------------------------------------------------------------------- | --------------------- | --------- | ---- |
| cursor | 边鼠标移入样式,[配置项](#cursor) | string | `default` | |
| increasedLineWidthForHitTesting | 当 lineWidth 较小时,可交互区域也随之变小,有时我们想增大这个区域,让"细线"更容易被拾取到 | number | 0 | |
| lineDash | 边虚线样式 | number[] | - | |
| lineDashOffset | 边虚线偏移量 | number | 0 | |
| lineWidth | 边宽度 | number | 1 | |
| opacity | 边透明度 | number \| string | 1 | |
| pointerEvents | 边如何响应指针事件,[配置项](#pointerevents) | string | `auto` | |
| shadowBlur | 边阴影模糊度 | number | - | |
| shadowColor | 边阴影颜色 | string | - | |
| shadowOffsetX | 边阴影在 x 轴方向上的偏移量 | number \| string | - | |
| shadowOffsetY | 边阴影在 y 轴方向上的偏移量 | number \| string | - | |
| shadowType | 边阴影类型 | `inner` \| `outer` | `outer` | |
| sourcePort | 边起始连接的连接桩 | string | - | |
| stroke | 边颜色 | string | `#000` | |
| strokeOpacity | 边颜色透明度 | number \| string | 1 | |
| targetPort | 边终点连接的连接桩 | string | - | |
| transform | transform 属性允许你旋转、缩放、倾斜或平移给定边 | string | - | |
| transformOrigin | 旋转与缩放中心,也称作变换中心 | string | - | |
| visibility | 边是否可见 | `visible` \| `hidden` | `visible` | |
| zIndex | 边渲染层级 | number | 1 | |
#### PointerEvents
`pointerEvents` 属性控制图形如何响应交互事件,可参考 [MDN 文档](https://developer.mozilla.org/en-US/docs/Web/CSS/pointer-events)。
可选值有:`visible` | `visiblepainted` | `visiblestroke` | `non-transparent-pixel` | `visiblefill` | `visible` | `painted` | `fill` | `stroke` | `all` | `none` | `auto` | `inherit` | `initial` | `unset`
简而言之,`stroke` 和 `visibility` 都可以独立或组合影响拾取判定行为。目前支持以下关键词:
- **`auto`**:默认值,等同于 `visiblepainted`
- **`none`**:永远不会成为响应事件的目标
- **`visiblepainted`**:满足以下条件才会响应事件:
- `visibility` 设置为 `visible`,即图形为可见的
- 在图形描边区域触发同时 `stroke` 取非 `none` 的值
- **`visiblestroke`**:满足以下条件才会响应事件:
- `visibility` 设置为 `visible`,即图形为可见的
- 在图形描边区域触发,不受 `stroke` 取值的影响
- **`visible`**:满足以下条件才会响应事件:
- `visibility` 设置为 `visible`,即图形为可见的
- 在图形描边区域触发,不受 `stroke` 取值的影响
- **`painted`**:满足以下条件才会响应事件:
- 在图形描边区域触发同时 `stroke` 取非 `none` 的值
- 不受 `visibility` 取值的影响
- **`stroke`**:满足以下条件才会响应事件:
- 在图形描边区域触发,不受 `stroke` 取值的影响
- 不受 `visibility` 取值的影响
- **`all`**:只要进入图形的描边区域就会响应事件,不会受 `stroke`、`visibility` 的取值影响
**使用示例:**
```js
// 示例1:只有描边区域响应事件
const graph = new Graph({
edge: {
style: {
stroke: '#000',
lineWidth: 2,
pointerEvents: 'stroke', // 只有描边响应事件
},
},
});
// 示例2:完全不响应事件
const graph = new Graph({
edge: {
style: {
pointerEvents: 'none', // 边不响应任何事件
},
},
});
```
#### Cursor
可选值有:`auto` | `default` | `none` | `context-menu` | `help` | `pointer` | `progress` | `wait` | `cell` | `crosshair` | `text` | `vertical-text` | `alias` | `copy` | `move` | `no-drop` | `not-allowed` | `grab` | `grabbing` | `all-scroll` | `col-resize` | `row-resize` | `n-resize` | `e-resize` | `s-resize` | `w-resize` | `ne-resize` | `nw-resize` | `se-resize` | `sw-resize` | `ew-resize` | `ns-resize` | `nesw-resize` | `nwse-resize` | `zoom-in` | `zoom-out`
### 标签样式
标签用于显示边的文本信息,支持多种样式配置和布局方式。以下是常见的使用场景:
#### 基础文本标签
最简单的文本标签配置:
```js | ob { inject: true }
import { Graph } from '@antv/g6';
const graph = new Graph({
container: 'container',
width: 240,
height: 120,
data: {
nodes: [
{ id: 'node1', style: { x: 60, y: 60 } },
{ id: 'node2', style: { x: 180, y: 60 } },
],
edges: [{ source: 'node1', target: 'node2' }],
},
edge: {
style: {
labelText: '边标签',
labelFill: '#262626',
labelFontSize: 12,
labelPlacement: 'center',
},
},
});
graph.render();
```
#### 多行文本标签
当文本较长时,可以设置自动换行:
```js | ob { inject: true }
import { Graph } from '@antv/g6';
const graph = new Graph({
container: 'container',
width: 240,
height: 120,
data: {
nodes: [
{ id: 'node1', style: { x: 60, y: 60 } },
{ id: 'node2', style: { x: 180, y: 60 } },
],
edges: [{ source: 'node1', target: 'node2' }],
},
edge: {
style: {
labelText: '这是一个很长的边标签需要换行显示',
labelWordWrap: true,
labelMaxWidth: '200%',
labelMaxLines: 2,
labelTextOverflow: 'ellipsis',
labelFill: '#434343',
labelPlacement: 'center',
labelTextAlign: 'center',
},
},
});
graph.render();
```
#### 带背景的标签
为标签添加背景,提高可读性:
```js | ob { inject: true }
import { Graph } from '@antv/g6';
const graph = new Graph({
container: 'container',
width: 240,
height: 120,
data: {
nodes: [
{ id: 'node1', style: { x: 60, y: 60 } },
{ id: 'node2', style: { x: 180, y: 60 } },
],
edges: [{ source: 'node1', target: 'node2' }],
},
edge: {
style: {
labelText: '重要连接',
labelBackground: true,
labelBackgroundFill: 'rgba(250, 140, 22, 0.1)',
labelBackgroundRadius: 6,
labelPadding: [4, 8],
labelFill: '#D4380D',
labelFontWeight: 'bold',
labelPlacement: 'center',
},
},
});
graph.render();
```
#### 自动旋转标签
标签可以自动旋转以保持与边方向一致:
```js | ob { inject: true }
import { Graph } from '@antv/g6';
const graph = new Graph({
container: 'container',
width: 240,
height: 120,
data: {
nodes: [
{ id: 'node1', style: { x: 60, y: 30 } },
{ id: 'node2', style: { x: 180, y: 90 } },
],
edges: [{ source: 'node1', target: 'node2' }],
},
edge: {
style: {
labelText: '自动旋转',
labelAutoRotate: true, // 自动旋转
labelFill: '#1890FF',
labelFontWeight: 'bold',
labelPlacement: 'center',
},
},
});
graph.render();
```
以下为完整的标签样式配置:
| 属性 | 描述 | 类型 | 默认值 | 必选 |
| ------------------------ | -------------------------------------------------------------------------------- | --------------------------------------------------------------------------- | --------- | ---- |
| label | 边标签是否显示 | boolean | true | |
| labelAutoRotate | 边标签是否自动旋转,保持与边的方向一致 | boolean | true | |
| labelCursor | 鼠标移入边标签时显示的样式,[配置项](#cursor) | string | `default` | |
| labelFill | 边标签文字颜色 | string | - | |
| labelFontFamily | 边标签字体族 | string | - | |
| labelFontSize | 边标签字体大小 | number | 12 | |
| labelFontStyle | 边标签字体样式 | `normal` \| `italic` \| `oblique` | - | |
| labelFontVariant | 边标签字体变种 | `normal` \| `small-caps` \| string | - | |
| labelFontWeight | 边标签字体粗细 | `normal` \| `bold` \| `bolder` \| `lighter` \| number | - | |
| labelLeading | 行间距 | number | 0 | |
| labelLetterSpacing | 边标签字间距 | number \| string | - | |
| labelLineHeight | 边标签行高 | number \| string | - | |
| labelMaxLines | 边标签最大行数 | number | 1 | |
| labelMaxWidth | 边标签最大宽度,[配置项](#labelmaxwidth) | number \| string | `200%` | |
| labelOffsetX | 边标签在 x 轴方向上的偏移量 | number | 0 | |
| labelOffsetY | 边标签在 y 轴方向上的偏移量 | number | 0 | |
| labelPadding | 边标签内边距 | number \| number[] | 0 | |
| labelPlacement | 边标签相对于边的位置,[配置项](#labelplacement) | string \| number | `center` | |
| labelText | 边标签文字内容 | `string` \| `(datum) => string` | - | |
| labelTextAlign | 边标签文本水平对齐方式 | `start` \| `center` \| `middle` \| `end` \| `left` \| `right` | `left` | |
| labelTextBaseline | 边标签文本基线 | `top` \| `hanging` \| `middle` \| `alphabetic` \| `ideographic` \| `bottom` | - | |
| labelTextDecorationColor | 边标签文本装饰线颜色 | string | - | |
| labelTextDecorationLine | 边标签文本装饰线 | string | - | |
| labelTextDecorationStyle | 边标签文本装饰线样式 | `solid` \| `double` \| `dotted` \| `dashed` \| `wavy` | - | |
| labelTextOverflow | 边标签文本溢出处理方式 | `clip` \| `ellipsis` \| string | - | |
| labelTextPath | 边标签文本路径 | Path | - | |
| labelWordWrap | 边标签是否开启自动折行。开启 labelWordWrap 后,超出 labelMaxWidth 的部分自动换行 | boolean | false | |
| labelZIndex | 边标签渲染层级 | number | 0 | |
#### LabelPlacement
边标签相对于边的位置,可以设置为:
- `start`:标签位于边的起始位置
- `center`:标签位于边的中心位置(默认)
- `end`:标签位于边的结束位置
- `number`:取值范围为 0-1,表示标签在边上的具体位置比例,0 为起始位置,1 为结束位置
#### LabelMaxWidth
开启自动折行 `labelWordWrap` 后,超出该宽度则换行:
- string: 表示以相对于边长度的百分比形式定义最大宽度。例如 `50%` 表示标签宽度不超过边长度的一半
- number: 表示以像素值为单位定义最大宽度。例如 100 表示标签的最大宽度为 100 像素
比如,设置多行标签文字:
```json
{
"labelWordWrap": true,
"labelMaxWidth": 200,
"labelMaxLines": 3
}
```
### 标签背景样式
标签背景用于显示边标签的背景:
| 属性 | 描述 | 类型 | 默认值 |
| ----------------------------- | ------------------------------------------------------------------------------------------------------------ | ---------------------------------------- | --------- |
| labelBackground | 边标签背景是否显示 | boolean | false |
| labelBackgroundCursor | 边标签背景鼠标移入样式,[配置项](#cursor) | string | `default` |
| labelBackgroundFill | 边标签背景填充色 | string | - |
| labelBackgroundFillOpacity | 边标签背景透明度 | number | 1 |
| labelBackgroundHeight | 边标签背景高度 | string \| number | - |
| labelBackgroundLineDash | 边标签背景虚线配置 | number \| string \|(number \| string )[] | - |
| labelBackgroundLineDashOffset | 边标签背景虚线偏移量 | number | - |
| labelBackgroundLineWidth | 边标签背景描边线宽 | number | - |
| labelBackgroundRadius | 边标签背景圆角半径 <br> - number: 统一设置四个圆角半径 <br> - number[]: 分别设置四个圆角半径,不足则自动补充 | number \| number[] | 0 |
| labelBackgroundShadowBlur | 边标签背景阴影模糊程度 | number | - |
| labelBackgroundShadowColor | 边标签背景阴影颜色 | string | - |
| labelBackgroundShadowOffsetX | 边标签背景阴影 X 方向偏移 | number | - |
| labelBackgroundShadowOffsetY | 边标签背景阴影 Y 方向偏移 | number | - |
| labelBackgroundStroke | 边标签背景描边颜色 | string | - |
| labelBackgroundStrokeOpacity | 边标签背景描边透明度 | number \| string | 1 |
| labelBackgroundVisibility | 边标签背景是否可见 | `visible` \| `hidden` | - |
| labelBackgroundZIndex | 边标签背景渲染层级 | number | 1 |
### 光晕样式
光晕是围绕边主图形显示的效果,通常用于高亮显示或表示边的特殊状态。
#### 基础光晕效果
为边添加基本的光晕效果:
```js | ob { inject: true }
import { Graph } from '@antv/g6';
const graph = new Graph({
container: 'container',
width: 240,
height: 100,
data: {
nodes: [
{ id: 'node1', style: { x: 60, y: 50 } },
{ id: 'node2', style: { x: 180, y: 50 } },
],
edges: [{ source: 'node1', target: 'node2' }],
},
edge: {
style: {
lineWidth: 2,
halo: true,
haloStroke: '#1890FF',
haloLineWidth: 6,
haloStrokeOpacity: 0.3,
},
},
});
graph.render();
```
以下为完整的光晕样式配置:
| 属性 | 描述 | 类型 | 默认值 | 必选 |
| ----------------- | ---------------------------------------------------- | ---------------------- | ------------------------------ | ---- |
| halo | 边光晕是否显示 | boolean | false | |
| haloCursor | 边光晕鼠标移入样式,[配置项](#cursor) | string | `default` | |
| haloDraggable | 边光晕是否允许拖拽 | boolean | true | |
| haloDroppable | 边光晕是否允许接收被拖拽的元素 | boolean | true | |
| haloFillRule | 边光晕填充规则 | `nonzero` \| `evenodd` | - | |
| haloFilter | 边光晕滤镜 | string | - | |
| haloLineWidth | 边光晕描边宽度 | number | 3 | |
| haloPointerEvents | 边光晕效果是否响应指针事件,[配置项](#pointerevents) | string | `none` | |
| haloStroke | 边光晕描边色,**此属性用于设置边周围光晕的颜色** | string | 与主图形的描边色 `stroke` 一致 | |
| haloStrokeOpacity | 边光晕描边色透明度 | number | 0.25 | |
| haloVisibility | 边光晕可见性 | `visible` \| `hidden` | `visible` | |
| haloZIndex | 边光晕渲染层级 | number | -1 | |
### 箭头样式
边支持在起始端和结束端添加箭头,用于表示边的方向性。
#### 基础箭头
为边的结束端添加基本箭头:
```js | ob { inject: true }
import { Graph } from '@antv/g6';
const graph = new Graph({
container: 'container',
width: 240,
height: 100,
data: {
nodes: [
{ id: 'node1', style: { x: 60, y: 50 } },
{ id: 'node2', style: { x: 180, y: 50 } },
],
edges: [{ source: 'node1', target: 'node2' }],
},
edge: {
style: {
stroke: '#1890FF',
lineWidth: 2,
endArrow: true, // 结束端箭头
endArrowType: 'vee', // 箭头类型
endArrowSize: 10, // 箭头大小
},
},
});
graph.render();
```
#### 双向箭头
为边的两端都添加箭头:
```js | ob { inject: true }
import { Graph } from '@antv/g6';
const graph = new Graph({
container: 'container',
width: 240,
height: 100,
data: {
nodes: [
{ id: 'node1', style: { x: 60, y: 50 } },
{ id: 'node2', style: { x: 180, y: 50 } },
],
edges: [{ source: 'node1', target: 'node2' }],
},
edge: {
style: {
stroke: '#52C41A',
lineWidth: 2,
startArrow: true, // 起始端箭头
startArrowType: 'circle',
startArrowSize: 8,
endArrow: true, // 结束端箭头
endArrowType: 'triangle',
endArrowSize: 10,
},
},
});
graph.render();
```
#### 自定义箭头样式
自定义箭头的颜色和类型:
```js | ob { inject: true }
import { Graph } from '@antv/g6';
const graph = new Graph({
container: 'container',
width: 240,
height: 100,
data: {
nodes: [
{ id: 'node1', style: { x: 60, y: 50 } },
{ id: 'node2', style: { x: 180, y: 50 } },
],
edges: [{ source: 'node1', target: 'node2' }],
},
edge: {
style: {
stroke: '#722ED1',
lineWidth: 3,
endArrow: true,
endArrowType: 'diamond', // 菱形箭头
endArrowSize: 12,
endArrowFill: '#FF4D4F', // 红色箭头填充
endArrowStroke: '#722ED1', // 箭头描边颜色
endArrowStrokeOpacity: 0.8,
},
},
});
graph.render();
```
#### 起始箭头样式配置
| 属性 | 描述 | 类型 | 默认值 | 必选 |
| ----------------------- | ----------------------------------------- | ------------------------------------------------------------------------------------ | ------------------ | ---- |
| startArrow | 边起始箭头是否显示 | boolean | false | |
| startArrowCursor | 边起始箭头鼠标移入样式,[配置项](#cursor) | string | `default` | |
| startArrowFill | 边起始箭头填充颜色 | string | 默认与边的颜色一致 | |
| startArrowFillOpacity | 边起始箭头填充透明度 | number | 1 | |
| startArrowOffset | 边起始箭头的偏移量 | number | 0 | |
| startArrowSize | 边起始箭头大小 | number \| [number, number] | 10 | |
| startArrowStroke | 边起始箭头描边颜色 | string | 默认与边的颜色一致 | |
| startArrowStrokeOpacity | 边起始箭头描边透明度 | number | 1 | |
| startArrowType | 边起始箭头类型 | `triangle` \| `circle` \| `diamond` \| `vee` \| `rect` \| `triangleRect` \| `simple` | `vee` | |
#### 结束箭头样式配置
| 属性 | 描述 | 类型 | 默认值 | 必选 |
| --------------------- | ----------------------------------------- | ------------------------------------------------------------------------------------ | ------------------ | ---- |
| endArrow | 边结束箭头是否显示 | boolean | false | |
| endArrowCursor | 边结束箭头鼠标移入样式,[配置项](#cursor) | string | `default` | |
| endArrowFill | 边结束箭头填充颜色 | string | 默认与边的颜色一致 | |
| endArrowFillOpacity | 边结束箭头填充透明度 | number | 1 | |
| endArrowOffset | 边结束箭头的偏移量 | number | 0 | |
| endArrowSize | 边结束箭头大小 | number \| [number, number] | 10 | |
| endArrowStroke | 边结束箭头描边颜色 | string | 默认与边的颜色一致 | |
| endArrowStrokeOpacity | 边结束箭头描边透明度 | number | 1 | |
| endArrowType | 边结束箭头类型 | `triangle` \| `circle` \| `diamond` \| `vee` \| `rect` \| `triangleRect` \| `simple` | `vee` | |
### 自环边样式
自环边是指起始节点和结束节点为同一个节点的特殊边。
#### 基础自环边
创建基本的自环边:
```js | ob { inject: true }
import { Graph } from '@antv/g6';
const graph = new Graph({
container: 'container',
width: 200,
height: 100,
data: {
nodes: [{ id: 'node1', style: { x: 100, y: 50 } }],
edges: [{ source: 'node1', target: 'node1' }],
},
edge: {
style: {
stroke: '#1890FF',
lineWidth: 2,
endArrow: true,
loopPlacement: 'top', // 自环位置
loopDist: 30, // 自环大小
},
},
});
graph.render();
```
#### 多个自环边
为同一节点创建多个不同位置的自环边:
```js | ob { inject: true }
import { Graph } from '@antv/g6';
const graph = new Graph({
container: 'container',
width: 200,
height: 120,
data: {
nodes: [{ id: 'node1', style: { x: 100, y: 60 } }],
edges: [
{ id: 'edge1', source: 'node1', target: 'node1' },
{ id: 'edge2', source: 'node1', target: 'node1' },
{ id: 'edge3', source: 'node1', target: 'node1' },
],
},
edge: {
style: {
lineWidth: 2,
endArrow: true,
loopPlacement: (datum) => {
const placements = ['top', 'right', 'bottom'];
return placements[parseInt(datum.id.slice(-1)) - 1];
},
loopDist: 25,
stroke: (datum) => {
const colors = ['#1890FF', '#52C41A', '#722ED1'];
return colors[parseInt(datum.id.slice(-1)) - 1];
},
},
},
});
graph.render();
```
以下为完整的自环边样式配置:
| 属性 | 描述 | 类型 | 默认值 | 必选 |
| ------------- | ---------------------------------------------- | ---------------------------------------------------------------------------------------------------------------------------------------------------------------------- | ---------------------- | ---- |
| loop | 是否启用自环边 | boolean | true | |
| loopClockwise | 指定是否顺时针绘制环 | boolean | true | |
| loopDist | 从节点边缘到自环顶部的距离,用于指定自环的曲率 | number | 默认为节点尺寸的最大值 | |
| loopPlacement | 自环边的位置 | `left` \| `right` \| `top` \| `bottom` \| `left-top` \| `left-bottom` \| `right-top` \| `right-bottom` \| `top-left` \| `top-right` \| `bottom-left` \| `bottom-right` | `top` | |
## State
在一些交互行为中,比如点击选中一个边或鼠标悬停激活一个边,仅仅是在该元素做了某些状态的标识。为了将这些状态反应到终端用户所见的视觉空间中,我们需要为不同的状态设置不同的图元素样式,以响应该图元素状态的变化。
G6 提供了几种内置的状态,包括选中(selected)、高亮(highlight)、激活(active)、不活跃(inactive)和禁用(disabled)。此外,它还支持自定义状态,以满足更特定的需求。对于每个状态,开发者可以定义一套样式规则,这些规则会覆盖元素的默认样式。
<img width="520" src="https://mdn.alipayobjects.com/huamei_qa8qxu/afts/img/A*ebBlTpKu2WUAAAAAAAAAAAAADmJ7AQ/original" />
数据结构如下:
```typescript
type EdgeState = {
[state: string]: EdgeStyle;
};
```
例如,当边处于 `focus` 状态时,可以为其添加一个宽度为 6 且颜色为橙色的光晕。
```js {4-9}
const graph = new Graph({
edge: {
state: {
focus: {
halo: true,
haloLineWidth: 6,
haloStroke: 'orange',
haloStrokeOpacity: 0.6,
},
},
},
});
```
效果如下图所示:
```js | ob { pin: false, inject: true }
import { Graph } from '@antv/g6';
const graph = new Graph({
container: 'container',
width: 300,
height: 100,
data: {
nodes: [{ id: 'node1' }, { id: 'node2' }],
edges: [{ source: 'node1', target: 'node2', states: ['focus'] }],
},
edge: {
state: {
focus: {
halo: true,
haloLineWidth: 6,
haloStroke: 'orange',
},
},
},
layout: {
type: 'grid',
cols: 2,
},
});
graph.render();
```
## Animation
定义边的动画效果,支持下列两种配置方式:
1. 关闭边全部动画
```json
{
"edge": {
"animation": false
}
}
```
2. 配置阶段动画
阶段动画是指边在进入画布、更新、离开画布时的动画效果。目前支持的阶段包括:
- `enter`: 边进入画布时的动画
- `update`: 边更新时的动画
- `exit`: 边离开画布时的动画
- `show`: 边从隐藏状态显示时的动画
- `hide`: 边隐藏时的动画
- `collapse`: 边收起时的动画
- `expand`: 边展开时的动画
你可以参考 [动画范式](/manual/animation/animation#动画范式) 使用动画语法来配置边,如:
```json
{
"edge": {
"animation": {
"update": [
{
"fields": ["stroke"], // 更新时只对 stroke 属性进行动画
"duration": 1000, // 动画持续时间
"easing": "linear" // 缓动函数
}
]
}
}
}
```
也可以使用内置的动画效果:
```json
{
"edge": {
"animation": {
"enter": "fade", // 使用渐变动画
"update": "path-in", // 使用路径动画
"exit": "fade" // 使用渐变动画
}
}
}
```
你可以传入 false 来关闭特定阶段的动画:
```json
{
"edge": {
"animation": {
"enter": false // 关闭边入场动画
}
}
}
```
## Palette
定义边的色板,即预定义边颜色池,并根据规则进行分配,将颜色映射到 `stroke` 属性。
> 有关色板的定义,请参考 [色板](/manual/theme/palette)。
| 属性 | 描述 | 类型 | 默认值 |
| ------ | ------------------------------------------------------------------- | ----------------------------- | ------- |
| color | 色板颜色。如果色板注册过,可以直接指定其注册名,也接受一个颜色数组 | string \| string[] | - |
| field | 指定元素数据中的分组字段。若不指定,默认取 id 作为分组字段 | string \| ((datum) => string) | `id` |
| invert | 是否反转色板 | boolean | false |
| type | 指定当前色板类型。<br> - `group`: 离散色板 <br> - `value`: 连续色板 | `group` \| `value` | `group` |
如将一组数据按 `direction` 字段分配边颜色,使得同类别的边颜色相同:
```json
{
"edge": {
"palette": {
"type": "group",
"field": "direction",
"color": ["#F08F56", "#00C9C9", "#D580FF"]
}
}
}
```
效果如下图所示:
```js | ob { pin: false, inject: true }
import { Graph } from '@antv/g6';
const graph = new Graph({
container: 'container',
width: 600,
height: 300,
data: {
nodes: new Array(6).fill(0).map((_, i) => ({ id: `node-${i + 1}` })),
edges: [
{ source: 'node-1', target: 'node-2', data: { direction: 'out' } },
{ source: 'node-1', target: 'node-3', data: { direction: 'out' } },
{ source: 'node-1', target: 'node-4', data: { direction: 'out' } },
{ source: 'node-5', target: 'node-1', data: { direction: 'in' } },
{ source: 'node-6', target: 'node-1', data: { direction: 'in' } },
],
},
layout: {
type: 'radial',
unitRadius: 120,
linkDistance: 120,
},
edge: {
style: {
endArrow: true,
},
palette: {
type: 'group',
field: 'direction',
color: ['#F08F56', '#00C9C9'],
},
},
});
graph.render();
```
也可以使用默认配置:
```json
{
"edge": {
"palette": "tableau" // tableau 为色板名,默认根据 ID 分配颜色
}
}
```
效果如下图所示:
```js | ob { pin: false, inject: true }
import { Graph } from '@antv/g6';
const graph = new Graph({
container: 'container',
width: 600,
height: 300,
data: {
nodes: new Array(6).fill(0).map((_, i) => ({ id: `node-${i + 1}` })),
edges: [
{ source: 'node-1', target: 'node-2', data: { direction: 'out' } },
{ source: 'node-1', target: 'node-3', data: { direction: 'out' } },
{ source: 'node-1', target: 'node-4', data: { direction: 'out' } },
{ source: 'node-5', target: 'node-1', data: { direction: 'in' } },
{ source: 'node-6', target: 'node-1', data: { direction: 'in' } },
],
},
layout: {
type: 'radial',
unitRadius: 120,
linkDistance: 120,
},
edge: {
style: {
endArrow: true,
},
palette: 'tableau',
},
});
graph.render();
```
Edge Skill
packages/site/docs/manual/element/edge/Cubic.en.md anthropic-skill ~858 tokens---
title: Cubic Bezier Curve Edge
order: 2
---
## Overview
A cubic Bezier curve is a versatile smooth curve with control points that can be freely distributed, suitable for connecting nodes in any direction.
Use cases:
- Suitable for graphs with any layout, such as network graphs and relationship graphs.
- Use when smooth node connections are needed without specific directional requirements.
## Online Experience
<embed src="@/common/api/elements/edges/cubic.md"></embed>
## Style Configuration
> If the element has specific attributes, we will list them below. For all general style attributes, see [BaseEdge](/en/manual/element/edge/base-edge)
| Attribute | Description | Type | Default | Required |
| ------------- | ----------------------------------------------------------------------------------------------------------------------------------------------------------- | ---------------------------------- | ------- | -------- |
| controlPoints | Array of control points used to define the shape of the curve. If not specified, control points will be calculated using `curveOffset` and `curvePosition`. | [[Point](#point), [Point](#point)] | - | |
| curvePosition | Relative position of the control point on the line connecting the two endpoints, ranging from `0-1`. | number | number[] | 0.5 | |
| curveOffset | Distance of the control point from the line connecting the two endpoints, understood as the degree of curve bending. | number | number[] | 20 | |
#### Point
```typescript
type Point = [number, number] | [number, number, number] | Float32Array;
```
## Example
### Built-in Cubic Bezier Curve Edge Effect
```js | ob { inject: true }
import { Graph, iconfont } from '@antv/g6';
const style = document.createElement('style');
style.innerHTML = `@import url('${iconfont.css}');`;
document.head.appendChild(style);
const data = {
nodes: [
{
id: 'node1',
},
{
id: 'node2',
},
{
id: 'node3',
},
{
id: 'node4',
},
{
id: 'node5',
},
{
id: 'node6',
},
],
edges: [
{
id: 'line-default',
source: 'node1',
target: 'node2',
},
{
id: 'line-active',
source: 'node1',
target: 'node3',
states: ['active'],
},
{
id: 'line-selected',
source: 'node1',
target: 'node4',
states: ['selected'],
},
{
id: 'line-highlight',
source: 'node1',
target: 'node5',
states: ['highlight'],
},
{
id: 'line-inactive',
source: 'node1',
target: 'node6',
states: ['inactive'],
},
],
};
const graph = new Graph({
container: 'container',
data,
edge: {
type: 'cubic',
style: {
labelText: (d) => d.id,
labelBackground: true,
endArrow: true,
badge: true,
badgeText: '\ue603',
badgeFontFamily: 'iconfont',
badgeBackgroundWidth: 12,
badgeBackgroundHeight: 12,
},
},
layout: {
type: 'radial',
unitRadius: 220,
linkDistance: 220,
},
});
graph.render();
```
Edge Skill
packages/site/docs/manual/element/edge/Cubic.zh.md anthropic-skill ~661 tokens---
title: 三次贝塞尔曲线边 Cubic
order: 2
---
## 概述
三次贝塞尔曲线是一种通用的平滑曲线,其控制点可以自由分布,适合连接任意方向的节点。
使用场景:
- 适用于任意布局的图,如网络图、关系图。
- 当需要平滑连接节点且无特定方向要求时使用。
## 在线体验
<embed src="@/common/api/elements/edges/cubic.md"></embed>
## 样式配置
> 如果元素有其特定的属性,我们将在下面列出。对于所有的通用样式属性,见 [BaseEdge](/manual/element/edge/base-edge)
| 属性 | 描述 | 类型 | 默认值 | 必选 |
| ------------- | -------------------------------------------------------------------------------------------------- | ---------------------------------- | ------ | ---- |
| controlPoints | 控制点数组,用于定义曲线的形状。如果不指定,将会通过 `curveOffset` 和 `curvePosition` 来计算控制点 | [[Point](#point), [Point](#point)] | - | |
| curvePosition | 控制点在两端点连线上的相对位置,范围为`0-1` | number | number[] | 0.5 | |
| curveOffset | 控制点距离两端点连线的距离,可理解为控制边的弯曲程度 | number | number[] | 20 | |
#### Point
```typescript
type Point = [number, number] | [number, number, number] | Float32Array;
```
## 示例
### 内置三次贝塞尔曲线边效果
```js | ob { inject: true }
import { Graph, iconfont } from '@antv/g6';
const style = document.createElement('style');
style.innerHTML = `@import url('${iconfont.css}');`;
document.head.appendChild(style);
const data = {
nodes: [
{
id: 'node1',
},
{
id: 'node2',
},
{
id: 'node3',
},
{
id: 'node4',
},
{
id: 'node5',
},
{
id: 'node6',
},
],
edges: [
{
id: 'line-default',
source: 'node1',
target: 'node2',
},
{
id: 'line-active',
source: 'node1',
target: 'node3',
states: ['active'],
},
{
id: 'line-selected',
source: 'node1',
target: 'node4',
states: ['selected'],
},
{
id: 'line-highlight',
source: 'node1',
target: 'node5',
states: ['highlight'],
},
{
id: 'line-inactive',
source: 'node1',
target: 'node6',
states: ['inactive'],
},
],
};
const graph = new Graph({
container: 'container',
data,
edge: {
type: 'cubic',
style: {
labelText: (d) => d.id,
labelBackground: true,
endArrow: true,
badge: true,
badgeText: '\ue603',
badgeFontFamily: 'iconfont',
badgeBackgroundWidth: 12,
badgeBackgroundHeight: 12,
},
},
layout: {
type: 'radial',
unitRadius: 220,
linkDistance: 220,
},
});
graph.render();
```
Edge Skill
packages/site/docs/manual/element/edge/CubicHorizontal.en.md anthropic-skill ~724 tokens---
title: CubicHorizontal Bezier Curve Edge
order: 3
---
## Overview
The horizontal cubic Bezier curve is a smooth curve with control points primarily distributed along the horizontal direction, suitable for connecting nodes horizontally.
Use cases:
- Suitable for horizontally laid-out graphs, such as flowcharts and hierarchical diagrams.
- Use when emphasizing horizontal connections is needed.
> Note: When calculating control points, the distance on the x-axis is primarily considered, ignoring changes on the y-axis.
## Online Experience
<embed src="@/common/api/elements/edges/cubic-horizontal.md"></embed>
## Style Configuration
> If the element has specific attributes, we will list them below. For all general style attributes, see [BaseEdge](/en/manual/element/edge/base-edge)
| Attribute | Description | Type | Default | Required |
| ------------- | -------------------------------------------------------------------------------------------------------------------- | ---------------------- | --------- | -------- |
| curvePosition | Relative position of the control point on the line connecting the two endpoints, ranging from `0-1`. | number | number[] | [0.5,0.5] | |
| curveOffset | Distance of the control point from the line connecting the two endpoints, understood as the degree of curve bending. | number | number[] | [0,0] | |
## Example
### Built-in Horizontal Cubic Bezier Curve Edge Effect
```js | ob { inject: true }
import { Graph } from '@antv/g6';
const data = {
nodes: [
{
id: 'node1',
},
{
id: 'node2',
},
{
id: 'node3',
},
{
id: 'node4',
},
{
id: 'node5',
},
{
id: 'node6',
},
],
edges: [
{
id: 'line-default',
source: 'node1',
target: 'node2',
},
{
id: 'line-active',
source: 'node1',
target: 'node3',
states: ['active'],
},
{
id: 'line-selected',
source: 'node1',
target: 'node4',
states: ['selected'],
},
{
id: 'line-highlight',
source: 'node1',
target: 'node5',
states: ['highlight'],
},
{
id: 'line-inactive',
source: 'node1',
target: 'node6',
states: ['inactive'],
},
],
};
const graph = new Graph({
container: 'container',
data,
node: {
style: {
port: true,
ports: [{ placement: 'right' }, { placement: 'left' }],
},
},
edge: {
type: 'cubic-horizontal',
style: {
labelText: (d) => d.id,
labelBackground: true,
endArrow: true,
},
},
layout: {
type: 'antv-dagre',
rankdir: 'LR',
nodesep: 20,
ranksep: 120,
},
});
graph.render();
```
Edge Skill
packages/site/docs/manual/element/edge/CubicHorizontal.zh.md anthropic-skill ~524 tokens---
title: 水平三次贝塞尔曲线边 CubicHorizontal
order: 3
---
## 概述
水平三次贝塞尔曲线是一种平滑的曲线,其控制点主要沿水平方向分布,适合在水平方向上连接节点。
使用场景:
- 适用于水平布局的图,如流程图、层次结构图。
- 当需要强调水平方向的连接关系时使用。
> 特别注意,计算控制点时主要考虑 x 轴上的距离,忽略 y 轴的变化
## 在线体验
<embed src="@/common/api/elements/edges/cubic-horizontal.md"></embed>
## 样式配置
> 如果元素有其特定的属性,我们将在下面列出。对于所有的通用样式属性,见 [BaseEdge](/manual/element/edge/base-edge)
| 属性 | 描述 | 类型 | 默认值 | 必选 |
| ------------- | ---------------------------------------------------- | ---------------------- | --------- | ---- |
| curvePosition | 控制点在两端点连线上的相对位置,范围为`0-1` | number | number[] | [0.5,0.5] | |
| curveOffset | 控制点距离两端点连线的距离,可理解为控制边的弯曲程度 | number | number[] | [0,0] | |
## 示例
### 内置水平三次贝塞尔曲线边效果
```js | ob { inject: true }
import { Graph } from '@antv/g6';
const data = {
nodes: [
{
id: 'node1',
},
{
id: 'node2',
},
{
id: 'node3',
},
{
id: 'node4',
},
{
id: 'node5',
},
{
id: 'node6',
},
],
edges: [
{
id: 'line-default',
source: 'node1',
target: 'node2',
},
{
id: 'line-active',
source: 'node1',
target: 'node3',
states: ['active'],
},
{
id: 'line-selected',
source: 'node1',
target: 'node4',
states: ['selected'],
},
{
id: 'line-highlight',
source: 'node1',
target: 'node5',
states: ['highlight'],
},
{
id: 'line-inactive',
source: 'node1',
target: 'node6',
states: ['inactive'],
},
],
};
const graph = new Graph({
container: 'container',
data,
node: {
style: {
port: true,
ports: [{ placement: 'right' }, { placement: 'left' }],
},
},
edge: {
type: 'cubic-horizontal',
style: {
labelText: (d) => d.id,
labelBackground: true,
endArrow: true,
},
},
layout: {
type: 'antv-dagre',
rankdir: 'LR',
nodesep: 20,
ranksep: 120,
},
});
graph.render();
```
Edge Skill
packages/site/docs/manual/element/edge/CubicVertical.en.md anthropic-skill ~726 tokens---
title: CubicVertical Bezier Curve Edge
order: 4
---
## Overview
The vertical cubic Bezier curve is a smooth curve with control points primarily distributed along the vertical direction, suitable for connecting nodes vertically.
Use cases:
- Suitable for vertically laid-out graphs, such as organizational charts and tree diagrams.
- Use when emphasizing vertical connections is needed.
**Note: When calculating control points, the distance on the y-axis is primarily considered, ignoring changes on the x-axis.**
## Online Experience
<embed src="@/common/api/elements/edges/cubic-vertical.md"></embed>
## Style Configuration
> If the element has specific attributes, we will list them below. For all general style attributes, see [BaseEdge](/en/manual/element/edge/base-edge)
| Attribute | Description | Type | Default | Required |
| ------------- | -------------------------------------------------------------------------------------------------------------------- | ---------------------- | --------- | -------- |
| curvePosition | Relative position of the control point on the line connecting the two endpoints, ranging from `0-1`. | number | number[] | [0.5,0.5] | |
| curveOffset | Distance of the control point from the line connecting the two endpoints, understood as the degree of curve bending. | number | number[] | [0,0] | |
## Example
### Built-in Vertical Cubic Bezier Curve Edge Effect
```js | ob { inject: true }
import { Graph } from '@antv/g6';
const data = {
nodes: [
{
id: 'node1',
},
{
id: 'node2',
},
{
id: 'node3',
},
{
id: 'node4',
},
{
id: 'node5',
},
{
id: 'node6',
},
],
edges: [
{
id: 'line-default',
source: 'node1',
target: 'node2',
},
{
id: 'line-active',
source: 'node1',
target: 'node3',
states: ['active'],
},
{
id: 'line-selected',
source: 'node1',
target: 'node4',
states: ['selected'],
},
{
id: 'line-highlight',
source: 'node1',
target: 'node5',
states: ['highlight'],
},
{
id: 'line-inactive',
source: 'node1',
target: 'node6',
states: ['inactive'],
},
],
};
const graph = new Graph({
container: 'container',
data,
node: {
style: {
port: true,
ports: [{ placement: 'top' }, { placement: 'bottom' }],
},
},
edge: {
type: 'cubic-vertical',
style: {
labelText: (d) => d.id,
labelBackground: true,
endArrow: true,
},
},
layout: {
type: 'antv-dagre',
begin: [50, 50],
rankdir: 'TB',
nodesep: 20,
ranksep: 120,
},
});
graph.render();
```
Edge Skill
packages/site/docs/manual/element/edge/CubicVertical.zh.md anthropic-skill ~528 tokens---
title: 垂直三次贝塞尔曲线边 CubicVertical
order: 4
---
## 概述
垂直三次贝塞尔曲线是一种平滑的曲线,其控制点主要沿垂直方向分布,适合在垂直方向上连接节点。
使用场景:
- 适用于垂直布局的图,如组织结构图、树状图。
- 当需要强调垂直方向的连接关系时使用。
**特别注意,计算控制点时主要考虑 y 轴上的距离,忽略 x 轴的变化**
## 在线体验
<embed src="@/common/api/elements/edges/cubic-vertical.md"></embed>
## 样式配置
> 如果元素有其特定的属性,我们将在下面列出。对于所有的通用样式属性,见 [BaseEdge](/manual/element/edge/base-edge)
| 属性 | 描述 | 类型 | 默认值 | 必选 |
| ------------- | ---------------------------------------------------- | ---------------------- | --------- | ---- |
| curvePosition | 控制点在两端点连线上的相对位置,范围为`0-1` | number | number[] | [0.5,0.5] | |
| curveOffset | 控制点距离两端点连线的距离,可理解为控制边的弯曲程度 | number | number[] | [0,0] | |
## 示例
### 内置垂直三次贝塞尔曲线边效果
```js | ob { inject: true }
import { Graph } from '@antv/g6';
const data = {
nodes: [
{
id: 'node1',
},
{
id: 'node2',
},
{
id: 'node3',
},
{
id: 'node4',
},
{
id: 'node5',
},
{
id: 'node6',
},
],
edges: [
{
id: 'line-default',
source: 'node1',
target: 'node2',
},
{
id: 'line-active',
source: 'node1',
target: 'node3',
states: ['active'],
},
{
id: 'line-selected',
source: 'node1',
target: 'node4',
states: ['selected'],
},
{
id: 'line-highlight',
source: 'node1',
target: 'node5',
states: ['highlight'],
},
{
id: 'line-inactive',
source: 'node1',
target: 'node6',
states: ['inactive'],
},
],
};
const graph = new Graph({
container: 'container',
data,
node: {
style: {
port: true,
ports: [{ placement: 'top' }, { placement: 'bottom' }],
},
},
edge: {
type: 'cubic-vertical',
style: {
labelText: (d) => d.id,
labelBackground: true,
endArrow: true,
},
},
layout: {
type: 'antv-dagre',
begin: [50, 50],
rankdir: 'TB',
nodesep: 20,
ranksep: 120,
},
});
graph.render();
```
Edge Skill
packages/site/docs/manual/element/edge/custom-edge.en.md anthropic-skill ~5,544 tokens---
title: Custom Edge
order: 7
---
G6 provides multiple [built-in edge](/en/manual/element/edge/base-edge) types, including [line](/en/manual/element/edge/line), [polyline](/en/manual/element/edge/polyline), [quadratic (quadratic Bézier curve edge)](/en/manual/element/edge/quadratic), [cubic (cubic Bézier curve edge)](/en/manual/element/edge/cubic), [cubic-horizontal](/en/manual/element/edge/cubic-horizontal), [cubic-vertical](/en/manual/element/edge/cubic-vertical), and more. These built-in edges can meet most basic scenario requirements.
However, in actual projects, you may encounter requirements that these basic edges cannot satisfy. In such cases, you need to create custom edges. Don't worry, it's simpler than you think!
## Before Starting: Understanding the Basic Components of an Edge
In G6, a complete edge typically consists of the following parts:
<image width="300" src="https://mdn.alipayobjects.com/huamei_qa8qxu/afts/img/A*YKN7TasqOh4AAAAAAAAAAAAADmJ7AQ/original" />
- `key`: The main graphic of the edge, representing the primary shape of the edge, such as straight lines, polylines, etc.
- `label`: Text label, usually used to display the name or description of the edge
- `arrow`: Arrow, used to indicate the direction of the edge
- `halo`: Graphic displaying halo effects around the main graphic
## Ways to Create Custom Edges <Badge type="warning">Choose the Right Approach</Badge>
There are two main ways to create custom edges:
### 1. Inherit from Existing Edge Types <Badge type="success">Recommended</Badge>
This is the most commonly used approach. You can choose to inherit from one of the following types:
- [`BaseEdge`](https://github.com/antvis/G6/blob/v5/packages/g6/src/elements/edges/base-edge.ts) - The most basic edge class, providing core edge functionality
- [`Line`](https://github.com/antvis/G6/blob/v5/packages/g6/src/elements/edges/line.ts) - Straight line edge
- [`Polyline`](https://github.com/antvis/G6/blob/v5/packages/g6/src/elements/edges/polyline.ts) - Polyline edge
- [`Quadratic`](https://github.com/antvis/G6/blob/v5/packages/g6/src/elements/edges/quadratic.ts) - Quadratic Bézier curve edge
- [`Cubic`](https://github.com/antvis/G6/blob/v5/packages/g6/src/elements/edges/cubic.ts) - Cubic Bézier curve edge
- [`CubicVertical`](https://github.com/antvis/G6/blob/v5/packages/g6/src/elements/edges/cubic-vertical.ts) - Vertical cubic Bézier curve edge
- [`CubicHorizontal`](https://github.com/antvis/G6/blob/v5/packages/g6/src/elements/edges/cubic-horizontal.ts) - Horizontal cubic Bézier curve edge
**Why choose this approach?**
- 📌 **Less code**: Reuse existing edge properties and methods, only focus on new functionality
- 📌 **Fast development**: Suitable for most project requirements, quickly achieve business goals
- 📌 **Easy maintenance**: Clear code structure, clear inheritance relationships
:::tip{title=Get Started Now}
If you choose to inherit from existing edge types (recommended), you can jump directly to [Create Your First Custom Edge in Three Steps](#create-your-first-custom-edge-in-three-steps) to start practicing. Most users will choose this approach!
:::
### 2. Build from Scratch Based on G Graphics System <Badge>Advanced Usage</Badge>
If existing edge types don't meet your requirements, you can create edges from scratch based on G's underlying graphics system.
**Why choose this approach?**
- 📌 **Maximum freedom**: Complete control over every detail of the edge, achieving any complex effects
- 📌 **Special requirements**: Highly customized scenarios that existing edge types cannot satisfy
- 📌 **Performance optimization**: Performance optimization for specific scenarios
:::warning{title=Important Notes}
Custom edges built from scratch need to handle all details by themselves, including graphic rendering, event response, state changes, etc., which is more challenging to develop. You can refer directly to the [source code](https://github.com/antvis/G6/blob/v5/packages/g6/src/elements/edges/base-edge.ts) for implementation.
:::
## Create Your First Custom Edge in Three Steps
Let's start with the most basic `BaseEdge` to implement a custom straight line edge:
```js | ob { pin:false, inject: true }
import { Graph, register, BaseEdge, ExtensionCategory } from '@antv/g6';
class MyLineEdge extends BaseEdge {
getKeyStyle(attributes) {
return { ...super.getKeyStyle(attributes), lineWidth: 2, stroke: '#A4D3EE' };
}
getKeyPath(attributes) {
const { sourceNode, targetNode } = this;
const [x1, y1] = sourceNode.getPosition();
const [x2, y2] = targetNode.getPosition();
return [
['M', x1, y1],
['L', x2, y2],
];
}
}
register(ExtensionCategory.EDGE, 'my-line-edge', MyLineEdge);
const graph = new Graph({
container: 'container',
height: 200,
data: {
nodes: [
{ id: 'node1', style: { x: 100, y: 50 } },
{ id: 'node2', style: { x: 300, y: 120 } },
],
edges: [{ source: 'node1', target: 'node2' }],
},
node: {
style: {
fill: '#7FFFD4',
stroke: '#5CACEE',
lineWidth: 2,
},
},
edge: {
type: 'my-line-edge',
style: {
zIndex: 3,
},
},
});
graph.render();
```
### Step 1: Write Custom Edge Class
```typescript
import { BaseEdge } from '@antv/g6';
import type { BaseEdgeStyleProps } from '@antv/g6';
class MyLineEdge extends BaseEdge {
// Define edge style, can add or override default styles
protected getKeyStyle(attributes: Required<BaseEdgeStyleProps>) {
// Call parent class method to get basic style, then add custom styles
return { ...super.getKeyStyle(attributes), lineWidth: 2, stroke: '#A4D3EE' };
}
// Implement abstract method: define edge path
// This is an abstract method of BaseEdge, all subclasses must implement it
protected getKeyPath(attributes) {
// Get source node and target node
const { sourceNode, targetNode } = this;
// Get node position coordinates
const [x1, y1] = sourceNode.getPosition();
const [x2, y2] = targetNode.getPosition();
// Return SVG path array, defining a straight line from start to end
return [
['M', x1, y1],
['L', x2, y2],
];
}
}
```
:::success{title=Key Method Analysis}
- `getKeyStyle`: Defines the basic style of the edge, such as line width, color, etc.
- `getKeyPath`: An abstract method in `BaseEdge` that **must be implemented**, it defines the path shape of the edge
:::
### Step 2: Register Custom Edge
Use the `register` method to register the edge type so that G6 can recognize your custom edge:
```js
import { ExtensionCategory } from '@antv/g6';
register(ExtensionCategory.EDGE, 'my-line-edge', MyLineEdge);
```
The `register` method requires three parameters:
- Extension category: `ExtensionCategory.EDGE` indicates this is an edge type
- Type name: `my-line-edge` is the name we give to this custom edge, which will be used in configuration later
- Class definition: `MyLineEdge` is the edge class we just created
### Step 3: Apply Custom Edge
In the graph configuration, use our custom edge by setting `edge.type`:
```js
const graph = new Graph({
container: 'container',
data: {
nodes: [
{ id: 'node1', style: { x: 100, y: 100 } },
{ id: 'node2', style: { x: 300, y: 150 } },
],
edges: [{ source: 'node1', target: 'node2' }],
},
node: {
style: {
fill: '#7FFFD4',
stroke: '#5CACEE',
lineWidth: 2,
},
},
edge: {
type: 'my-line-edge',
style: {
zIndex: 3,
},
},
});
graph.render();
```
🎉 Congratulations! You have created your first custom edge.
## Going Further: Understanding the Principles of Edge Rendering
### Atomic Graphics
G6 nodes are drawn using atomic graphic units provided by the [G graphics system](https://g.antv.antgroup.com/). Here are common graphic elements and their uses:
| Graphic Element | Type | Description |
| --------------- | ---------- | --------------------------------------------------------------------------------------------------------------------------------------------------------------------------------------------------------------------------------------------------------------------------- |
| Circle | `circle` | Suitable for representing states, avatars, circular buttons, etc. Refer to SVG's [\<circle\>](https://developer.mozilla.org/en-US/docs/Web/SVG/Reference/Element/circle) element |
| Ellipse | `ellipse` | Similar to circle, but supports scenarios with different horizontal and vertical axes. Refer to SVG's [\<ellipse\>](https://developer.mozilla.org/en-US/docs/Web/SVG/Reference/Element/ellipse) element |
| Image | `image` | Used to display icons, user avatars, LOGOs, etc. Refer to SVG's [\<image\>](https://developer.mozilla.org/en-US/docs/Web/SVG/Element/image) element |
| Line | `line` | Used for decoration, auxiliary connections, etc. Refer to SVG's [\<line\>](https://developer.mozilla.org/en-US/docs/Web/SVG/Element/line) element |
| Path | `path` | Supports complex graphics such as arrows, arcs, curves, Bézier paths, etc. The path contains a set of commands and parameters with different semantics, [specific usage](https://developer.mozilla.org/en-US/docs/Web/SVG/Tutorial/Paths) |
| Polygon | `polygon` | Supports custom graphics such as pentagrams, arrows. Refer to SVG's [\<polygon\>](https://developer.mozilla.org/en-US/docs/Web/SVG/Element/polygon) element |
| Polyline | `polyline` | Multi-point polyline, suitable for complex connection structures. Refer to SVG's [\<polyline\>](https://developer.mozilla.org/en-US/docs/Web/SVG/Element/polyline) element |
| Rectangle | `rect` | Most commonly used graphic, suitable as containers, cards, buttons, and other basic structures. Refer to SVG's [\<rect\>](https://developer.mozilla.org/en-US/docs/Web/SVG/Element/rect) element |
| Text | `text` | Displays names, descriptions, labels, and other content. Provides simple single-line/multi-line text layout capabilities, single-line supports horizontal alignment, character spacing; multi-line supports explicit line breaks and automatic wrapping, vertical alignment |
> For more atomic graphics and detailed properties, please refer to [Element - Shape (Optional)](/en/manual/element/shape/overview)
All these graphics can be dynamically created or updated through `upsert()`, automatically managing graphic state and lifecycle.
### Element Base Class
Before starting to customize elements, you need to understand some important properties and methods in G6 element base classes:
#### Properties
| Property | Type | Description |
| ---------- | ----------------------------- | ----------------------------------------------------- |
| shapeMap | Record<string, DisplayObject> | Mapping table of all graphics under current element |
| animateMap | Record<string, IAnimation> | Mapping table of all animations under current element |
#### Methods
#### `upsert(name, Ctor, style, container, hooks)`: Graphic Creation/Update
When creating custom elements, you will frequently use the `upsert` method. It's short for "update or insert", responsible for adding or updating graphics in elements:
```typescript
upsert(key: string, Ctor: { new (...args: any[]): DisplayObject }, style: Record<string, any>, container: DisplayObject);
```
| Parameter | Type | Description |
| --------- | --------------------------------------- | --------------------------------------------------------------------------------------------------------------------------------------------------------------------------------------------------------------------------------------------------------------------------------------------------------------------------------- |
| key | string | The key of the graphic, i.e., the corresponding key in `shapeMap`. Built-in keys include `'key'` `'label'` `'halo'` `'icon'` `'port'` `'badge'`<br/> The key should not use special symbols, it will be converted to camelCase to call `getXxxStyle` and `drawXxxShape` methods (see [Element Conventions](#element-conventions)) |
| Ctor | { new (...args: any[]): DisplayObject } | Graphic class |
| style | Record<string, any> | Graphic style |
| container | DisplayObject | Container to mount the graphic |
For example, inserting a purple circle at a fixed position:
```js
this.upsert(
'element-key', // Unique identifier of the element
'circle', // Graphic type, such as 'rect', 'circle', etc.
{ x: 100, y: 100, fill: '#a975f3' }, // Style configuration object
container, // Parent container
);
```
Why use `upsert` instead of directly creating graphics through `container.appendChild()`? Because:
1. **Better performance**: When state changes or data updates, it intelligently reuses existing graphics instead of deleting and rebuilding, greatly improving rendering performance
2. **Simpler code**: No need to manually check if elements exist
3. **Easy management**: All graphics created through `upsert` are recorded in the node's `shapeMap`, you can easily get them through `this.getShape(key)`
#### `render(attributes, container)`: Main Entry Point for Rendering Edges
Every custom edge class must implement the `render(attributes, container)` method, which defines how the edge is "drawn". You can use various atomic graphics here to compose the structure you want.
```typescript
render(style: Record<string, any>, container: Group): void;
```
| Parameter | Type | Description |
| --------- | ------------------- | ------------- |
| style | Record<string, any> | Element style |
| container | Group | Container |
#### `getShape(name)`: Get Created Graphics
Sometimes, you need to modify the properties of a sub-graphic after creation, or make sub-graphics interact with each other. In this case, the `getShape` method can help you get any graphic previously created through `upsert`:
**⚠️ Note**: The order of graphics is important. If graphic B depends on the position of graphic A, you must ensure A is created first
### Element Conventions
- **Use Conventional Properties**
Currently conventional element properties include:
- Get element size through `this.getSize()`
- Get edge start and end points through `const [sourcePoint, targetPoint] = this.getEndpoints(attributes, false)` (simple mode - doesn't consider node shape, directly returns node center or nearest port center position)
- Get edge start and end points through `const [sourcePoint, targetPoint] = this.getEndpoints(attributes)` (optimized mode - default is true, considers node shape, returns connection points on node boundary)
- **Use Paired `getXxxStyle` and `drawXxxShape` Methods for Graphic Drawing**
`getXxxStyle` is used to get graphic styles, `drawXxxShape` is used to draw graphics. Graphics created this way support automatic animation execution.
> Where `Xxx` is the camelCase form of the key passed when calling the [upsert](#methods) method.
- **Access Graph Context through `this.context`**
### Lifecycle Hooks
The following lifecycle hook functions are provided, which you can override in custom edges to execute specific logic at key moments:
| Hook Function | Trigger Time | Typical Usage |
| ------------- | ------------------------------------------------------- | -------------------------------------------------------------------------------- |
| `onCreate` | When edge creation is completed with entrance animation | Bind interaction events, initialize edge state, add external listeners |
| `onUpdate` | When edge update is completed with update animation | Update dependent data, adjust related elements, trigger linkage effects |
| `onDestroy` | When edge completes exit animation and is destroyed | Clean up resources, remove external listeners, execute destruction notifications |
### State Response
One of the most powerful aspects of G6 element design is the ability to separate **"state response"** from **"rendering logic"**.
You can define styles for each state in edge configuration:
```js
edge: {
type: 'custom-edge',
style: { stroke: '#eee' },
state: {
selected: {
stroke: '#f00',
},
hover: {
lineWidth: 3,
stroke: '#1890ff',
},
},
}
```
Method to switch states:
```js
graph.setElementState(edgeId, ['selected']);
```
This state will be passed to the `render()` method's `attributes`, and the merged result by the internal system will be automatically applied to the graphics.
You can also customize rendering logic based on state:
```typescript
protected getKeyStyle(attributes: Required<BaseEdgeStyleProps>) {
const style = super.getKeyStyle(attributes);
// Adjust style based on state
if (attributes.states?.includes('selected')) {
return {
...style,
stroke: '#1890ff',
lineWidth: 2,
shadowColor: 'rgba(24,144,255,0.2)',
shadowBlur: 15,
};
}
return style;
}
```
## From Simple to Complex
### Custom Path Polyline Edge
```js | ob { inject: true }
import { Graph, register, BaseEdge, ExtensionCategory } from '@antv/g6';
class MyPolylineEdge extends BaseEdge {
getKeyPath(attributes) {
const [sourcePoint, targetPoint] = this.getEndpoints(attributes);
return [
['M', sourcePoint[0], sourcePoint[1]],
['L', targetPoint[0] / 2 + (1 / 2) * sourcePoint[0], sourcePoint[1]],
['L', targetPoint[0] / 2 + (1 / 2) * sourcePoint[0], targetPoint[1]],
['L', targetPoint[0], targetPoint[1]],
];
}
}
register(ExtensionCategory.EDGE, 'my-polyline-edge', MyPolylineEdge);
const graph = new Graph({
container: 'container',
height: 200,
data: {
nodes: [
{ id: 'node-0', style: { x: 100, y: 50, ports: [{ key: 'right', placement: [1, 0.5] }] } },
{ id: 'node-1', style: { x: 250, y: 150, ports: [{ key: 'left', placement: [0, 0.5] }] } },
],
edges: [{ source: 'node-0', target: 'node-1' }],
},
edge: {
type: 'my-polyline-edge',
style: {
startArrow: true,
endArrow: true,
stroke: '#F6BD16',
},
},
behaviors: ['drag-element'],
});
graph.render();
```
### Additional Labels
```js | ob { inject: true }
import { Graph, Line, register, BaseEdge, ExtensionCategory, subStyleProps } from '@antv/g6';
class LabelEdge extends Line {
render(attributes, container) {
super.render(attributes);
this.drawEndLabel(attributes, container, 'start');
this.drawEndLabel(attributes, container, 'end');
}
drawEndLabel(attributes, container, type) {
const key = type === 'start' ? 'startLabel' : 'endLabel';
const [x, y] = this.getEndpoints(attributes)[type === 'start' ? 0 : 1];
const fontStyle = {
x,
y,
dx: type === 'start' ? 15 : -15,
fontSize: 16,
fill: 'gray',
textBaseline: 'middle',
textAlign: type,
};
const style = subStyleProps(attributes, key);
const text = style.text;
this.upsert(`label-${type}`, 'text', text ? { ...fontStyle, ...style } : false, container);
}
}
register(ExtensionCategory.EDGE, 'extra-label-edge', LabelEdge);
const graph = new Graph({
container: 'container',
height: 200,
data: {
nodes: [
{ id: 'node-0', style: { x: 100, y: 100 } },
{ id: 'node-1', style: { x: 300, y: 100 } },
],
edges: [{ source: 'node-0', target: 'node-1' }],
},
edge: {
type: 'extra-label-edge',
style: {
startArrow: true,
endArrow: true,
stroke: '#F6BD16',
startLabelText: 'start',
endLabelText: 'end',
},
},
behaviors: ['drag-element'],
});
graph.render();
```
Edge Skill
packages/site/docs/manual/element/edge/custom-edge.zh.md anthropic-skill ~3,674 tokens---
title: 自定义边
order: 7
---
G6 提供了多种[内置边](/manual/element/edge/base-edge)类型,包含 [line(直线边)](/manual/element/edge/line)、[polyline(折线边)](/manual/element/edge/polyline)、[quadratic(二次贝塞尔曲线边)](/manual/element/edge/quadratic)、[cubic(三次贝塞尔曲线边)](/manual/element/edge/cubic)、[cubic-horizontal(水平三次贝塞尔曲线边)](/manual/element/edge/cubic-horizontal)、[cubic-vertical(垂直三次贝塞尔曲线边)](/manual/element/edge/cubic-vertical) 等。这些内置边能够满足大部分基础场景需求。
但在实际项目中,你可能会遇到这些基础边无法满足的需求。这时,你需要创建自定义边。别担心,这比你想象的要简单!
## 开始之前:了解边的基本构成
在 G6 中,一条完整的边通常由以下几个部分组成:
<image width="300" src="https://mdn.alipayobjects.com/huamei_qa8qxu/afts/img/A*YKN7TasqOh4AAAAAAAAAAAAADmJ7AQ/original" />
- `key` :边的主图形,表示边的主要形状,例如直线、折线等;
- `label` :文本标签,通常用于展示边的名称或描述;
- `arrow` :箭头,用于表示边的方向;
- `halo` :主图形周围展示的光晕效果的图形。
## 自定义边的方式 <Badge type="warning">选择合适的方式</Badge>
创建自定义边的方式主要有两种途径:
### 1. 继承现有边类型 <Badge type="success">推荐</Badge>
这是最常用的方式,你可以选择继承以下类型之一:
- [`BaseEdge`](https://github.com/antvis/G6/blob/v5/packages/g6/src/elements/edges/base-edge.ts) - 最基础的边类,提供边的核心功能
- [`Line`](https://github.com/antvis/G6/blob/v5/packages/g6/src/elements/edges/line.ts) - 直线边
- [`Polyline`](https://github.com/antvis/G6/blob/v5/packages/g6/src/elements/edges/polyline.ts) - 折线边
- [`Quadratic`](https://github.com/antvis/G6/blob/v5/packages/g6/src/elements/edges/quadratic.ts) - 二次贝塞尔曲线边
- [`Cubic`](https://github.com/antvis/G6/blob/v5/packages/g6/src/elements/edges/cubic.ts) - 三次贝塞尔曲线边
- [`CubicVertical`](https://github.com/antvis/G6/blob/v5/packages/g6/src/elements/edges/cubic-vertical.ts) - 垂直三次贝塞尔曲线边
- [`CubicHorizontal`](https://github.com/antvis/G6/blob/v5/packages/g6/src/elements/edges/cubic-horizontal.ts) - 水平三次贝塞尔曲线边
**为什么选择这种方式?**
- 📌 **代码量少**:复用现有边的属性和方法,只需专注于新增功能
- 📌 **开发迅速**:适合大多数项目需求,快速实现业务目标
- 📌 **易于维护**:代码结构清晰,继承关系明确
:::tip{title=立即开始}
如果你选择继承现有边类型(推荐),可以直接跳到 [三步创建你的第一个自定义边](#三步创建你的第一个自定义边) 开始实践。大部分用户都会选择这种方式!
:::
### 2. 基于 G 图形系统从零开发 <Badge>高级用法</Badge>
如果现有边类型都不满足需求,你可以基于 G 的底层图形系统从零创建边。
**为什么选择这种方式?**
- 📌 **最大自由度**:完全控制边的每个细节,实现任意复杂效果
- 📌 **特殊需求**:现有边类型无法满足的高度定制场景
- 📌 **性能优化**:针对特定场景的性能优化
:::warning{title=注意事项}
从零开发的自定义边需要自行处理所有细节,包括图形绘制、事件响应、状态变化等,开发难度较大。这里可以直接参考 [源码](https://github.com/antvis/G6/blob/v5/packages/g6/src/elements/edges/base-edge.ts) 进行实现。
:::
## 三步创建你的第一个自定义边
让我们从最基础的 `BaseEdge` 开始,实现一个自定义直线边:
```js | ob { pin:false, inject: true }
import { Graph, register, BaseEdge, ExtensionCategory } from '@antv/g6';
class MyLineEdge extends BaseEdge {
getKeyStyle(attributes) {
return { ...super.getKeyStyle(attributes), lineWidth: 2, stroke: '#A4D3EE' };
}
getKeyPath(attributes) {
const { sourceNode, targetNode } = this;
const [x1, y1] = sourceNode.getPosition();
const [x2, y2] = targetNode.getPosition();
return [
['M', x1, y1],
['L', x2, y2],
];
}
}
register(ExtensionCategory.EDGE, 'my-line-edge', MyLineEdge);
const graph = new Graph({
container: 'container',
height: 200,
data: {
nodes: [
{ id: 'node1', style: { x: 100, y: 50 } },
{ id: 'node2', style: { x: 300, y: 120 } },
],
edges: [{ source: 'node1', target: 'node2' }],
},
node: {
style: {
fill: '#7FFFD4',
stroke: '#5CACEE',
lineWidth: 2,
},
},
edge: {
type: 'my-line-edge',
style: {
zIndex: 3,
},
},
});
graph.render();
```
### 第一步:编写自定义边类
```typescript
import { BaseEdge } from '@antv/g6';
import type { BaseEdgeStyleProps } from '@antv/g6';
class MyLineEdge extends BaseEdge {
// 定义边的样式,可以添加或覆盖默认样式
protected getKeyStyle(attributes: Required<BaseEdgeStyleProps>) {
// 调用父类方法获取基础样式,然后添加自定义样式
return { ...super.getKeyStyle(attributes), lineWidth: 2, stroke: '#A4D3EE' };
}
// 实现抽象方法:定义边的路径
// 这是 BaseEdge 的抽象方法,所有子类必须实现
protected getKeyPath(attributes) {
// 获取源节点和目标节点
const { sourceNode, targetNode } = this;
// 获取节点的位置坐标
const [x1, y1] = sourceNode.getPosition();
const [x2, y2] = targetNode.getPosition();
// 返回SVG路径数组,定义从起点到终点的直线
return [
['M', x1, y1],
['L', x2, y2],
];
}
}
```
:::success{title=关键方法解析}
- `getKeyStyle`: 定义边的基本样式,如线宽、颜色等
- `getKeyPath`: 是 `BaseEdge` 中的抽象方法,**必须实现**,它定义了边的路径形状
:::
### 第二步:注册自定义边
使用 `register` 方法注册边类型,这样 G6 才能识别你的自定义边:
```js
import { ExtensionCategory } from '@antv/g6';
register(ExtensionCategory.EDGE, 'my-line-edge', MyLineEdge);
```
`register` 方法需要三个参数:
- 扩展类别:`ExtensionCategory.EDGE` 表示这是一个边类型
- 类型名称:`my-line-edge` 是我们给这个自定义边起的名字,后续会在配置中使用
- 类定义:`MyLineEdge` 是我们刚刚创建的边类
### 第三步:应用自定义边
在图的配置中,通过设置 `edge.type` 来使用我们的自定义边:
```js
const graph = new Graph({
container: 'container',
data: {
nodes: [
{ id: 'node1', style: { x: 100, y: 100 } },
{ id: 'node2', style: { x: 300, y: 150 } },
],
edges: [{ source: 'node1', target: 'node2' }],
},
node: {
style: {
fill: '#7FFFD4',
stroke: '#5CACEE',
lineWidth: 2,
},
},
edge: {
type: 'my-line-edge',
style: {
zIndex: 3,
},
},
});
graph.render();
```
🎉 恭喜!你已经创建了第一个自定义边。
## 更进一步:理解边绘制的原理
### 原子图形
G6 的节点是由 [G 图形系统](https://g.antv.antgroup.com/) 提供的图形原子单元绘制而成。以下是常见图形元素及其用途:
| 图形元素 | 类型 | 描述 |
| -------- | ---------- | --------------------------------------------------------------------------------------------------------------------------------------------------------------------------- |
| 圆形 | `circle` | 适合表示状态、头像、圆形按钮等。可以参考 SVG 的 [\<circle\>](https://developer.mozilla.org/zh-CN/docs/Web/SVG/Reference/Element/circle) 元素 |
| 椭圆 | `ellipse` | 与 circle 类似,但支持横纵轴不同的场景。可以参考 SVG 的 [\<ellipse\>](https://developer.mozilla.org/zh-CN/docs/Web/SVG/Reference/Element/ellipse) 元素 |
| 图片 | `image` | 用于展示图标、用户头像、LOGO 等。可以参考 SVG 的 [\<image\>](https://developer.mozilla.org/zh-CN/docs/Web/SVG/Element/image) 元素 |
| 直线 | `line` | 用于装饰、辅助连接等。可以参考 SVG 的 [\<line\>](https://developer.mozilla.org/zh-CN/docs/Web/SVG/Element/line) 元素 |
| 路径 | `path` | 支持复杂图形,如箭头、圆弧、曲线、贝塞尔路径等。路径中包含一组命令与参数,这些命令有不同的语义,[具体用法](https://developer.mozilla.org/zh-CN/docs/Web/SVG/Tutorial/Paths) |
| 多边形 | `polygon` | 支持自定义图形,如五角星、箭头。可以参考 SVG 的 [\<polygon\>](https://developer.mozilla.org/zh-CN/docs/Web/SVG/Element/polygon) 元素 |
| 折线 | `polyline` | 多点折线,适合复杂的连线结构。可以参考 SVG 的 [\<polyline\>](https://developer.mozilla.org/zh-CN/docs/Web/SVG/Element/polyline) 元素 |
| 矩形 | `rect` | 最常用图形,适合作为容器、卡片、按钮等基础结构。可以参考 SVG 的 [\<rect\>](https://developer.mozilla.org/zh-CN/docs/Web/SVG/Element/rect) 元素 |
| 文本 | `text` | 显示名称、描述、标签等内容。提供简单的单行/多行文本排版能力,单行支持水平对齐、字符间距;多行支持显式换行符以及自动换行,垂直对齐 |
> 更多原子图形和详细的属性请参考 [元素 - 图形(可选)](/manual/element/shape/overview)
所有这些图形都可通过 `upsert()` 动态创建或更新,并自动管理图形状态和生命周期。
### 元素基类
开始自定义元素之前,你需要了解 G6 元素基类中的一些重要属性和方法:
#### 属性
| 属性 | 类型 | 描述 |
| ---------- | ----------------------------- | -------------------------- |
| shapeMap | Record<string, DisplayObject> | 当前元素下所有图形的映射表 |
| animateMap | Record<string, IAnimation> | 当前元素下所有动画的映射表 |
#### 方法
#### `upsert(name, Ctor, style, container, hooks)`: 图形创建/更新
在创建自定义元素时,你会频繁用到 `upsert` 方法。它是 "update or insert" 的缩写,负责添加或更新元素中的图形:
```typescript
upsert(key: string, Ctor: { new (...args: any[]): DisplayObject }, style: Record<string, any>, container: DisplayObject);
```
| 参数 | 类型 | 描述 |
| --------- | --------------------------------------- | -------------------------------------------------------------------------------------------------------------------------------------------------------------------------------------------------------------------------------------- |
| key | string | 图形的 key,即 `shapeMap` 中对应的 key。内置的 key 包括 `'key'` `'label'` `'halo'` `'icon'` `'port'` `'badge'`<br/> key 不应使用特殊符号,会基于该值转化为驼峰形式调用 `getXxxStyle` 和 `drawXxxShape` 方法(见[元素约定](#元素约定)) |
| Ctor | { new (...args: any[]): DisplayObject } | 图形类 |
| style | Record<string, any> | 图形样式 |
| container | DisplayObject | 挂载图形的容器 |
例如,插入一个固定位置的紫色圆形:
```js
this.upsert(
'element-key', // 元素的唯一标识
'circle', // 图形类型,如 'rect', 'circle' 等
{ x: 100, y: 100, fill: '#a975f3' }, // 样式配置对象
container, // 父容器
);
```
为什么要使用 `upsert` 而不直接通过 `container.appendChild()` 创建图形?因为:
1. **性能更好**:当状态变化或数据更新时,会智能地复用已有图形,而不是删除再重建,大大提高了渲染性能
2. **代码更简洁**:不需要手动判断元素是否存在
3. **便于管理**:所有通过 `upsert` 创建的图形都会被记录在节点的 `shapeMap` 中,你可以通过 `this.getShape(key)` 轻松获取
#### `render(attributes, container)`: 渲染边的主入口
每个自定义边类都必须实现 `render(attributes, container)` 方法,它定义了该边如何被“绘制”出来。你可以在这里使用各种原子图形,组合出你想要的结构。
```typescript
render(style: Record<string, any>, container: Group): void;
```
| 参数 | 类型 | 描述 |
| --------- | ------------------- | -------- |
| style | Record<string, any> | 元素样式 |
| container | Group | 容器 |
#### `getShape(name)`: 获取已创建的图形
有时,你需要在创建后修改某个子图形的属性,或者让子图形之间有交互关联。这时,`getShape` 方法可以帮你获取之前通过 `upsert` 创建的任何图形:
**⚠️ 注意**:图形的顺序很重要,如果图形 B 依赖图形 A 的位置,必须确保 A 先创建
### 元素约定
- **使用约定属性**
目前约定的元素属性包括:
- 通过 `this.getSize()` 获取元素的尺寸
- 通过 `const [sourcePoint, targetPoint] = this.getEndpoints(attributes, false)` 获取边的起点和终点(简单模式 - 不考虑节点形状,直接返回节点中心点或最近连接桩中心˝位置)
- 通过 `const [sourcePoint, targetPoint] = this.getEndpoints(attributes)` 获取边的起点和终点(优化模式 - 默认为 true,考虑节点形状,返回节点边界上的连接点)
- **采用 `getXxxStyle` 和 `drawXxxShape` 配对的方式进行图形绘制**
`getXxxStyle` 用于获取图形样式,`drawXxxShape` 用于绘制图形。通过该方式创建的图形支持自动执行动画。
> 其中 `Xxx` 是调用 [upsert](#方法) 方法时传入的 key 的驼峰形式。
- **可通过 `this.context` 访问 Graph 上下文**
### 生命周期钩子
提供了以下生命周期钩子函数,你可以在自定义边中重写这些方法,在关键时刻执行特定逻辑:
| 钩子函数 | 触发时机 | 典型用途 |
| ----------- | ------------------------ | ------------------------------------------ |
| `onCreate` | 当边创建后完成入场动画时 | 绑定交互事件、初始化边状态、添加外部监听器 |
| `onUpdate` | 当边更新后完成更新动画时 | 更新依赖数据、调整相关元素、触发联动效果 |
| `onDestroy` | 当边完成退场动画并销毁后 | 清理资源、移除外部监听器、执行销毁通知 |
### 状态响应
G6 元素设计中最强大的一点,是可以将 **“状态响应”** 与 **“绘制逻辑”** 分离。
你可以在边配置中定义每种状态下的样式:
```js
edge: {
type: 'custom-edge',
style: { stroke: '#eee' },
state: {
selected: {
stroke: '#f00',
},
hover: {
lineWidth: 3,
stroke: '#1890ff',
},
},
}
```
切换状态的方法:
```js
graph.setElementState(edgeId, ['selected']);
```
这个状态会传入到 `render()` 方法的 `attributes` 中,由内部系统合并后的结果自动应用在图形上。
也可以根据状态自定义渲染逻辑:
```typescript
protected getKeyStyle(attributes: Required<BaseEdgeStyleProps>) {
const style = super.getKeyStyle(attributes);
// 根据状态调整样式
if (attributes.states?.includes('selected')) {
return {
...style,
stroke: '#1890ff',
lineWidth: 2,
shadowColor: 'rgba(24,144,255,0.2)',
shadowBlur: 15,
};
}
return style;
}
```
## 从简单到复杂
### 自定义路径的折线边
```js | ob { inject: true }
import { Graph, register, BaseEdge, ExtensionCategory } from '@antv/g6';
class MyPolylineEdge extends BaseEdge {
getKeyPath(attributes) {
const [sourcePoint, targetPoint] = this.getEndpoints(attributes);
return [
['M', sourcePoint[0], sourcePoint[1]],
['L', targetPoint[0] / 2 + (1 / 2) * sourcePoint[0], sourcePoint[1]],
['L', targetPoint[0] / 2 + (1 / 2) * sourcePoint[0], targetPoint[1]],
['L', targetPoint[0], targetPoint[1]],
];
}
}
register(ExtensionCategory.EDGE, 'my-polyline-edge', MyPolylineEdge);
const graph = new Graph({
container: 'container',
height: 200,
data: {
nodes: [
{ id: 'node-0', style: { x: 100, y: 50, ports: [{ key: 'right', placement: [1, 0.5] }] } },
{ id: 'node-1', style: { x: 250, y: 150, ports: [{ key: 'left', placement: [0, 0.5] }] } },
],
edges: [{ source: 'node-0', target: 'node-1' }],
},
edge: {
type: 'my-polyline-edge',
style: {
startArrow: true,
endArrow: true,
stroke: '#F6BD16',
},
},
behaviors: ['drag-element'],
});
graph.render();
```
### 额外标签
```js | ob { inject: true }
import { Graph, Line, register, BaseEdge, ExtensionCategory, subStyleProps } from '@antv/g6';
class LabelEdge extends Line {
render(attributes, container) {
super.render(attributes);
this.drawEndLabel(attributes, container, 'start');
this.drawEndLabel(attributes, container, 'end');
}
drawEndLabel(attributes, container, type) {
const key = type === 'start' ? 'startLabel' : 'endLabel';
const [x, y] = this.getEndpoints(attributes)[type === 'start' ? 0 : 1];
const fontStyle = {
x,
y,
dx: type === 'start' ? 15 : -15,
fontSize: 16,
fill: 'gray',
textBaseline: 'middle',
textAlign: type,
};
const style = subStyleProps(attributes, key);
const text = style.text;
this.upsert(`label-${type}`, 'text', text ? { ...fontStyle, ...style } : false, container);
}
}
register(ExtensionCategory.EDGE, 'extra-label-edge', LabelEdge);
const graph = new Graph({
container: 'container',
height: 200,
data: {
nodes: [
{ id: 'node-0', style: { x: 100, y: 100 } },
{ id: 'node-1', style: { x: 300, y: 100 } },
],
edges: [{ source: 'node-0', target: 'node-1' }],
},
edge: {
type: 'extra-label-edge',
style: {
startArrow: true,
endArrow: true,
stroke: '#F6BD16',
startLabelText: 'start',
endLabelText: 'end',
},
},
behaviors: ['drag-element'],
});
graph.render();
```
Edge Skill
packages/site/docs/manual/element/edge/Line.en.md anthropic-skill ~507 tokens---
title: Line Edge
order: 5
---
## Overview
A line is the simplest type of edge, directly connecting two nodes without any curvature.
Use cases:
- Suitable for simple graphs, such as topology diagrams and flowcharts.
- Use when quick drawing is needed without complex visual effects.
## Online Experience
<embed src="@/common/api/elements/edges/line.md"></embed>
## Style Configuration
> If the element has specific attributes, we will list them below. For all general style attributes, see [BaseEdge](/en/manual/element/edge/base-edge)
## Example
### Built-in Line Edge Effect
```js | ob { inject: true }
import { Graph, iconfont } from '@antv/g6';
const style = document.createElement('style');
style.innerHTML = `@import url('${iconfont.css}');`;
document.head.appendChild(style);
const data = {
nodes: [
{
id: 'node1',
},
{
id: 'node2',
},
{
id: 'node3',
},
{
id: 'node4',
},
{
id: 'node5',
},
{
id: 'node6',
},
],
edges: [
{
id: 'line-default',
source: 'node1',
target: 'node2',
},
{
id: 'line-active',
source: 'node1',
target: 'node3',
states: ['active'],
},
{
id: 'line-selected',
source: 'node1',
target: 'node4',
states: ['selected'],
},
{
id: 'line-highlight',
source: 'node1',
target: 'node5',
states: ['highlight'],
},
{
id: 'line-inactive',
source: 'node1',
target: 'node6',
states: ['inactive'],
},
],
};
const graph = new Graph({
container: 'container',
data,
edge: {
type: 'line',
style: {
labelText: (d) => d.id,
labelBackground: true,
endArrow: true,
badge: true,
badgeText: '\ue603',
badgeFontFamily: 'iconfont',
badgeBackgroundWidth: 12,
badgeBackgroundHeight: 12,
},
},
layout: {
type: 'radial',
unitRadius: 220,
linkDistance: 220,
},
});
graph.render();
```
Edge Skill
packages/site/docs/manual/element/edge/Line.zh.md anthropic-skill ~434 tokens---
title: 直线边 Line
order: 5
---
## 概述
直线是最简单的边类型,直接连接两个节点,没有任何弯曲。
使用场景:
- 适用于简单的图,如拓扑图、流程图。
- 当需要快速绘制且无需复杂视觉效果时使用。
## 在线体验
<embed src="@/common/api/elements/edges/line.md"></embed>
## 样式配置
> 如果元素有其特定的属性,我们将在下面列出。对于所有的通用样式属性,见 [BaseEdge](/manual/element/edge/base-edge)
## 示例
### 内置直线边效果
```js | ob { inject: true }
import { Graph, iconfont } from '@antv/g6';
const style = document.createElement('style');
style.innerHTML = `@import url('${iconfont.css}');`;
document.head.appendChild(style);
const data = {
nodes: [
{
id: 'node1',
},
{
id: 'node2',
},
{
id: 'node3',
},
{
id: 'node4',
},
{
id: 'node5',
},
{
id: 'node6',
},
],
edges: [
{
id: 'line-default',
source: 'node1',
target: 'node2',
},
{
id: 'line-active',
source: 'node1',
target: 'node3',
states: ['active'],
},
{
id: 'line-selected',
source: 'node1',
target: 'node4',
states: ['selected'],
},
{
id: 'line-highlight',
source: 'node1',
target: 'node5',
states: ['highlight'],
},
{
id: 'line-inactive',
source: 'node1',
target: 'node6',
states: ['inactive'],
},
],
};
const graph = new Graph({
container: 'container',
data,
edge: {
type: 'line',
style: {
labelText: (d) => d.id,
labelBackground: true,
endArrow: true,
badge: true,
badgeText: '\ue603',
badgeFontFamily: 'iconfont',
badgeBackgroundWidth: 12,
badgeBackgroundHeight: 12,
},
},
layout: {
type: 'radial',
unitRadius: 220,
linkDistance: 220,
},
});
graph.render();
```
Edge Skill
packages/site/docs/manual/element/edge/overview.en.md anthropic-skill ~1,280 tokens---
title: Edge Overview
order: 0
---
## What is an Edge
An edge is one of the basic elements in a graph, used to connect two nodes or combos, representing the relationship between them. In G6, edges are directional, pointing from `source` to `target`, but you can configure them to hide the arrow to represent undirected connections.
You can create edges between any two nodes, combos, or between a node and a combo, and you can express different types of relationships by creating multiple edges.
<image width="300" src="https://mdn.alipayobjects.com/huamei_qa8qxu/afts/img/A*YKN7TasqOh4AAAAAAAAAAAAADmJ7AQ/original" />
G6 provides the following built-in edges:
- `line` Straight line edge
- `polyline` Polyline edge
- `quadratic` Quadratic Bezier curve edge
- `cubic` Cubic Bezier curve edge
- `cubicVertical` Vertical cubic Bezier curve edge
- `cubicHorizontal` Horizontal cubic Bezier curve edge
### Data Structure
When defining an edge, you need to add an `edges` field to the graph's data object. Each edge is an object with the following structure:
| Attribute | Description | Type | Default | Required |
| --------- | ------------------------------------------------------------------------------------------------------------- | -------- | ------- | -------- |
| source | ID of the starting node of the edge | string | - | ✓ |
| target | ID of the target node of the edge | string | - | ✓ |
| id | Unique identifier of the edge | string | - | |
| type | Type of edge, name of built-in edge type or custom edge, such as `line` or `polyline` | string | - | |
| data | Edge data, used to store custom data of the edge, can be accessed in style mapping through callback functions | object | - | |
| style | Edge style, including visual attributes like line color, width, arrow, etc. | object | - | |
| states | Initial states of the edge | string[] | - | |
An example of a data item in the `edges` array:
```json
{
"source": "alice",
"target": "bob",
"type": "line",
"data": { "relationship": "friend", "strength": 5 },
"style": { "stroke": "green", "lineWidth": 2 },
"states": ["hover"]
}
```
### Configuration Methods
There are three ways to configure edges, listed in order of priority from high to low:
- Use `graph.setEdge()` for dynamic configuration
- Global configuration when instantiating the graph
- Dynamic attributes in data
These configuration methods can be used simultaneously. When there are the same configuration items, the method with higher priority will override the one with lower priority.
### Using `graph.setEdge()`
You can dynamically set the style mapping logic of edges using `graph.setEdge()` after the graph instance is created.
This method needs to be called before `graph.render()` to take effect and has the highest priority.
```js
graph.setEdge({
style: {
type: 'line',
style: { stroke: '#5CACEE', lineWidth: 2 },
},
});
graph.render();
```
### Global Configuration When Instantiating the Graph
You can configure edge style mapping globally when instantiating the graph, and this configuration will take effect on all edges.
```js
import { Graph } from '@antv/g6';
const graph = new Graph({
edge: {
type: 'line',
style: { stroke: '#5CACEE', lineWidth: 2 },
},
});
```
### Dynamic Configuration in Data
If you need different configurations for different edges, you can write the configuration into the edge data. This configuration method can be directly written into the data in the form of the following code:
```typescript
const data = {
edges: [
{
source: 'node-1',
target: 'node-2',
type: 'line',
style: { stroke: 'orange' },
},
],
};
```
### Adjusting Priority
If you want the configuration in the data to have a higher priority than the global configuration, you can take the following approach:
```js
const data = {
edges: [
{
source: 'node-1',
target: 'node-2',
type: 'line',
style: { stroke: 'orange' },
},
],
};
const graph = new Graph({
edge: {
type: 'line',
style: {
stroke: (d) => d.style.stroke || '#5CACEE',
lineWidth: 2,
},
},
});
```
## Custom Edges
When built-in edges cannot meet the requirements, G6 provides powerful customization capabilities:
- Extend built-in edges
- Create entirely new edge types
Unlike combos, custom edges need to be registered before use. For detailed tutorials, please refer to the [Custom Edge](/manual/element/edge/custom-edge) documentation.
Edge Skill
packages/site/docs/manual/element/edge/overview.zh.md anthropic-skill ~736 tokens---
title: 边总览
order: 0
---
## 什么是边
边(Edge)是图中的基本元素之一,用于连接两个节点或组合,表示它们之间的关系。在 G6 中,边具有方向性,从 `source` 指向 `target`,也可以通过配置隐藏箭头以表示无方向连接。
你可以在任意两个节点、组合,或节点与组合之间创建边,还可以通过创建多条边来表达不同的关系类型。
<image width="300" src="https://mdn.alipayobjects.com/huamei_qa8qxu/afts/img/A*YKN7TasqOh4AAAAAAAAAAAAADmJ7AQ/original" />
G6 提供了以下内置边:
- `line` 直线边
- `polyline` 折线边
- `quadratic` 二次贝塞尔曲线边
- `cubic` 三次贝塞尔曲线边
- `cubicVertical` 垂直三次贝塞尔曲线边
- `cubicHorizontal` 水平三次贝塞尔曲线边
### 数据结构
定义边时,需要在图的数据对象中添加 `edges` 字段。每条边是一个对象,结构如下:
| 属性 | 描述 | 类型 | 默认值 | 必选 |
| ------ | --------------------------------------------------------------------- | -------- | ------ | ---- |
| source | 边起始节点 ID | string | - | ✓ |
| target | 边目标节点 ID | string | - | ✓ |
| id | 边的唯一标识符 | string | - | |
| type | 边类型,内置边类型名称或者自定义边的名称,比如 `line` 或者 `polyline` | string | - | |
| data | 边数据,用于存储边的自定义数据,可以在样式映射中通过回调函数获取 | object | - | |
| style | 边样式,包括线条颜色、宽度、箭头等视觉属性 | object | - | |
| states | 边初始状态 | string[] | - | |
`edges` 数组中一个数据项的示例:
```json
{
"source": "alice",
"target": "bob",
"type": "line",
"data": { "relationship": "friend", "strength": 5 },
"style": { "stroke": "green", "lineWidth": 2 },
"states": ["hover"]
}
```
### 配置方法
配置边的方式有三种,按优先级从高到低如下:
- 使用 `graph.setEdge()` 动态配置
- 实例化图时全局配置
- 在数据中动态属性
这几个配置方法可以同时使用。有相同的配置项时,优先级高的方式将会覆盖优先级低的。
### 使用 `graph.setEdge()`
可在图实例创建后,使用 `graph.setEdge()` 动态设置边的样式映射逻辑。
该方法需要在 `graph.render()` 之前调用才会生效,并拥有最高优先级。
```js
graph.setEdge({
style: {
type: 'line',
style: { stroke: '#5CACEE', lineWidth: 2 },
},
});
graph.render();
```
### 实例化图时全局配置
在实例化图时可以通过 `edge` 配置边样式映射,这里的配置是全局的配置,将会在所有边上生效。
```js
import { Graph } from '@antv/g6';
const graph = new Graph({
edge: {
type: 'line',
style: { stroke: '#5CACEE', lineWidth: 2 },
},
});
```
### 在数据中动态配置
如果需要为不同边进行不同的配置,可以将配置写入到边数据中。这种配置方式可以通过下面代码的形式直接写入数据:
```typescript
const data = {
edges: [
{
source: 'node-1',
target: 'node-2',
type: 'line',
style: { stroke: 'orange' },
},
],
};
```
### 调整优先级
如果你想让数据中配置的优先级高于全局配置,你可以采取以下方式:
```js
const data = {
edges: [
{
source: 'node-1',
target: 'node-2',
type: 'line',
style: { stroke: 'orange' },
},
],
};
const graph = new Graph({
edge: {
type: 'line',
style: {
stroke: (d) => d.style.stroke || '#5CACEE',
lineWidth: 2,
},
},
});
```
## 自定义边
当内置边无法满足需求时,G6 提供了强大的自定义能力:
- 继承内置边进行扩展
- 创建全新的边类型
与组合不同,自定义边需要先注册后使用。详细教程请参考 [自定义边](/manual/element/edge/custom-edge) 文档。
Edge Skill
packages/site/docs/manual/element/edge/Polyline.en.md anthropic-skill ~2,076 tokens---
title: Polyline Edge
order: 6
---
## Overview
A polyline is an edge composed of multiple straight line segments, suitable for connecting nodes by bypassing obstacles in complex layouts.
Use cases:
- Suitable for graphs with complex layouts, such as circuit diagrams and pipeline diagrams.
- Use when you need to bypass other nodes or obstacles.
## Online Experience
<embed src="@/common/api/elements/edges/polyline.md"></embed>
## Style Configuration
> If the element has specific attributes, we will list them below. For all general style attributes, see [BaseEdge](/en/manual/element/edge/base-edge)
| Attribute | Description | Type | Default | Required |
| ------------- | -------------------------------------------------------------------------- | --------------------------------------------------------------------------------------- | ------- | -------- |
| controlPoints | Array of control points used to define the turning points of the polyline. | [Point](#point)[] | [] | |
| radius | Corner radius of the turning points. | number | 0 | |
| router | Whether to enable routing. | false | [OrthRouter](#orthrouter) | [ShortestPathRouter](#shortestpathrouter) | false | |
### OrthRouter
| Attribute | Description | Type | Default |
| --------- | -------------------------------------------------------------------------------------------------------- | ------------------- | ------- |
| type | Orthogonal routing, adding extra control points on the path to keep each segment horizontal or vertical. | `'orth'` | - |
| padding | Minimum distance between the node connection point and the corner. | [Padding](#padding) | `0` |
### ShortestPathRouter
| Attribute | Description | Type | Default |
| ------------------------- | ------------------------------------------------------------------------------------------------------------------------------------------------------------------------------------------------------------------------------------------------------------------------------------ | ---------------------------------------------------------------------- | ------- |
| type | Shortest path routing, an intelligent version of orthogonal routing `'orth'`. This routing consists of horizontal or vertical orthogonal segments. It uses the A\* algorithm to calculate the shortest path and supports automatic avoidance of other nodes (obstacles) on the path. | `'shortest-path'` | - |
| offset | Minimum distance between the node anchor point and the corner. | [Padding](#padding) | 0 |
| gridSize | Grid cell size. | number | 0 |
| maxAllowedDirectionChange | Maximum allowed rotation angle (radians). | number | 0 |
| startDirections | Possible starting directions of the node. | [Direction](#direction)[] | 0 |
| endDirections | Possible ending directions of the node. | [Direction](#direction)[] | 0 |
| directionMap | Specifies the movable directions. | { [key in [Direction](#direction)]: { stepX: number; stepY: number } } | 0 |
| penalties | Represents additional costs for certain paths during path searching. The key is the radian value, and the value is the cost. | { [key: string]: number } | 0 |
| distFunc | Specifies the function to calculate the distance between two points. | (p1: [Point](#point), p2: [Point](#point)) => number | 0 |
| maximumLoops | Maximum number of iterations. | number | 0 |
| enableObstacleAvoidance | Whether to enable obstacle avoidance. | boolean | false |
#### Direction
```typescript
type Direction = 'left' | 'right' | 'top' | 'bottom';
```
#### Point
```typescript
type Point = [number, number] | [number, number, number] | Float32Array;
```
#### Padding
```typescript
type Padding = number | [number, number] | [number, number, number, number];
```
## Example
### Built-in Polyline Edge Effect
```js | ob { inject: true }
import { Graph } from '@antv/g6';
const data = {
nodes: [
{ id: 'node-1', style: { x: 200, y: 200 } },
{ id: 'node-2', style: { x: 350, y: 120 } },
],
edges: [
{
id: 'edge-1',
source: 'node-1',
target: 'node-2',
controlPoints: [[300, 190]],
},
],
};
const graph = new Graph({
container: 'container',
data,
edge: {
type: 'polyline',
style: {
controlPoints: (d) => d.controlPoints,
},
},
behaviors: [{ type: 'drag-element' }],
});
graph.render();
```
Edge Skill
packages/site/docs/manual/element/edge/Polyline.zh.md anthropic-skill ~1,394 tokens---
title: 折线边 Polyline
order: 6
---
## 概述
折线是由多条直线段组成的边,适合在复杂布局中绕过障碍物连接节点。
使用场景:
- 适用于复杂布局的图,如电路图、管道图。
- 当需要绕过其他节点或障碍物时使用。
## 在线体验
<embed src="@/common/api/elements/edges/polyline.md"></embed>
## 样式配置
> 如果元素有其特定的属性,我们将在下面列出。对于所有的通用样式属性,见 [BaseEdge](/manual/element/edge/base-edge)
| 属性 | 描述 | 类型 | 默认值 | 必选 |
| ------------- | -------------------------------- | --------------------------------------------------------------------------------------- | ------ | ---- |
| controlPoints | 控制点数组,用于定义折线的转折点 | [Point](#point)[] | [] | |
| radius | 转折点圆角半径 | number | 0 | |
| router | 是否启用路由 | false | [OrthRouter](#orthrouter) | [ShortestPathRouter](#shortestpathrouter) | false | |
### OrthRouter
| 属性 | 描述 | 类型 | 默认值 |
| ------- | ---------------------------------------------------------------------- | ------------------- | ------ |
| type | 正交路由,通过在路径上添加额外的控制点,使得边的每一段都保持水平或垂直 | `'orth'` | - |
| padding | 节点连接点与转角的最小距离 | [Padding](#padding) | `0` |
### ShortestPathRouter
| 属性 | 描述 | 类型 | 默认值 |
| ------------------------- | ------------------------------------------------------------------------------------------------------------------------------------------------- | ---------------------------------------------------------------------- | ------ |
| type | 最短路径路由,是正交路由 `'orth'` 的智能版本。该路由由水平或垂直的正交线段组成。采用 A\* 算法计算最短路径,并支持自动避开路径上的其他节点(障碍) | `'shortest-path'` | - |
| offset | 节点锚点与转角的最小距离 | [Padding](#padding) | 0 |
| gridSize | grid 格子大小 | number | 0 |
| maxAllowedDirectionChange | 支持的最大旋转角度(弧度) | number | 0 |
| startDirections | 节点的可能起始方向 | [Direction](#direction)[] | 0 |
| endDirections | 节点的可能结束方向 | [Direction](#direction)[] | 0 |
| directionMap | 指定可移动的方向 | { [key in [Direction](#direction)]: { stepX: number; stepY: number } } | 0 |
| penalties | 表示在路径搜索过程中某些路径的额外代价。key 为弧度值,value 为代价 | { [key: string]: number } | 0 |
| distFunc | 指定计算两点之间距离的函数 | (p1: [Point](#point), p2: [Point](#point)) => number | 0 |
| maximumLoops | 最大迭代次数 | number | 0 |
| enableObstacleAvoidance | 是否开启避障 | boolean | false |
#### Direction
```typescript
type Direction = 'left' | 'right' | 'top' | 'bottom';
```
#### Point
```typescript
type Point = [number, number] | [number, number, number] | Float32Array;
```
#### Padding
```typescript
type Padding = number | [number, number] | [number, number, number, number];
```
## 示例
### 内置折线边效果
```js | ob { inject: true }
import { Graph } from '@antv/g6';
const data = {
nodes: [
{ id: 'node-1', style: { x: 200, y: 200 } },
{ id: 'node-2', style: { x: 350, y: 120 } },
],
edges: [
{
id: 'edge-1',
source: 'node-1',
target: 'node-2',
controlPoints: [[300, 190]],
},
],
};
const graph = new Graph({
container: 'container',
data,
edge: {
type: 'polyline',
style: {
controlPoints: (d) => d.controlPoints,
},
},
behaviors: [{ type: 'drag-element' }],
});
graph.render();
```
Edge Skill
packages/site/docs/manual/element/edge/Quadratic.en.md anthropic-skill ~831 tokens---
title: Quadratic Bezier Curve Edge
order: 6
---
## Overview
A quadratic Bezier curve is a smooth curve whose shape is determined by a start point, an end point, and a control point.
Use cases:
- Suitable for moderately complex graphs, such as relationship graphs and network graphs.
- Use when smooth node connections are needed with limited computational resources.
## Online Experience
<embed src="@/common/api/elements/edges/quadratic.md"></embed>
## Style Configuration
> If the element has specific attributes, we will list them below. For all general style attributes, see [BaseEdge](/en/manual/element/edge/base-edge)
| Attribute | Description | Type | Default | Required |
| ------------- | ----------------------------------------------------------------------------------------------------------------------------------------------------------- | --------------- | ------- | -------- |
| controlPoints | Array of control points used to define the shape of the curve. If not specified, control points will be calculated using `curveOffset` and `curvePosition`. | [Point](#point) | - | |
| curvePosition | Relative position of the control point on the line connecting the two endpoints, ranging from `0-1`. | number | 0.5 | |
| curveOffset | Distance of the control point from the line connecting the two endpoints, understood as the degree of curve bending. | number | 30 | |
#### Point
```typescript
type Point = [number, number] | [number, number, number] | Float32Array;
```
## Example
### Built-in Quadratic Bezier Curve Edge Effect
```js | ob { inject: true }
import { Graph, iconfont } from '@antv/g6';
const style = document.createElement('style');
style.innerHTML = `@import url('${iconfont.css}');`;
document.head.appendChild(style);
const data = {
nodes: [
{
id: 'node1',
},
{
id: 'node2',
},
{
id: 'node3',
},
{
id: 'node4',
},
{
id: 'node5',
},
{
id: 'node6',
},
],
edges: [
{
id: 'line-default',
source: 'node1',
target: 'node2',
},
{
id: 'line-active',
source: 'node1',
target: 'node3',
states: ['active'],
},
{
id: 'line-selected',
source: 'node1',
target: 'node4',
states: ['selected'],
},
{
id: 'line-highlight',
source: 'node1',
target: 'node5',
states: ['highlight'],
},
{
id: 'line-inactive',
source: 'node1',
target: 'node6',
states: ['inactive'],
},
],
};
const graph = new Graph({
container: 'container',
data,
edge: {
type: 'quadratic',
style: {
labelText: (d) => d.id,
labelBackground: true,
endArrow: true,
badge: true,
badgeText: '\ue603',
badgeFontFamily: 'iconfont',
badgeBackgroundWidth: 12,
badgeBackgroundHeight: 12,
},
},
layout: {
type: 'radial',
unitRadius: 220,
linkDistance: 220,
},
});
graph.render();
```
Edge Skill
packages/site/docs/manual/element/edge/Quadratic.zh.md anthropic-skill ~638 tokens---
title: 二次贝塞尔曲线边 Quadratic
order: 6
---
## 概述
二次贝塞尔曲线是一种平滑的曲线,其形状由起点、终点和一个控制点决定。
使用场景:
- 适用于中等复杂度的图,如关系图、网络图。
- 当需要平滑连接节点且计算资源有限时使用。
## 在线体验
<embed src="@/common/api/elements/edges/quadratic.md"></embed>
## 样式配置
> 如果元素有其特定的属性,我们将在下面列出。对于所有的通用样式属性,见 [BaseEdge](/manual/element/edge/base-edge)
| 属性 | 描述 | 类型 | 默认值 | 必选 |
| ------------- | -------------------------------------------------------------------------------------------------- | --------------- | ------ | ---- |
| controlPoints | 控制点数组,用于定义曲线的形状。如果不指定,将会通过 `curveOffset` 和 `curvePosition` 来计算控制点 | [Point](#point) | - | |
| curvePosition | 控制点在两端点连线上的相对位置,范围为`0-1` | number | 0.5 | |
| curveOffset | 控制点距离两端点连线的距离,可理解为控制边的弯曲程度 | number | 30 | |
#### Point
```typescript
type Point = [number, number] | [number, number, number] | Float32Array;
```
## 示例
### 内置二次贝塞尔曲线边效果
```js | ob { inject: true }
import { Graph, iconfont } from '@antv/g6';
const style = document.createElement('style');
style.innerHTML = `@import url('${iconfont.css}');`;
document.head.appendChild(style);
const data = {
nodes: [
{
id: 'node1',
},
{
id: 'node2',
},
{
id: 'node3',
},
{
id: 'node4',
},
{
id: 'node5',
},
{
id: 'node6',
},
],
edges: [
{
id: 'line-default',
source: 'node1',
target: 'node2',
},
{
id: 'line-active',
source: 'node1',
target: 'node3',
states: ['active'],
},
{
id: 'line-selected',
source: 'node1',
target: 'node4',
states: ['selected'],
},
{
id: 'line-highlight',
source: 'node1',
target: 'node5',
states: ['highlight'],
},
{
id: 'line-inactive',
source: 'node1',
target: 'node6',
states: ['inactive'],
},
],
};
const graph = new Graph({
container: 'container',
data,
edge: {
type: 'quadratic',
style: {
labelText: (d) => d.id,
labelBackground: true,
endArrow: true,
badge: true,
badgeText: '\ue603',
badgeFontFamily: 'iconfont',
badgeBackgroundWidth: 12,
badgeBackgroundHeight: 12,
},
},
layout: {
type: 'radial',
unitRadius: 220,
linkDistance: 220,
},
});
graph.render();
```
Node Skill
packages/site/docs/manual/element/node/BaseNode.en.md anthropic-skill ~22,082 tokens---
title: Common Node Configuration
order: 1
---
This document introduces the common configuration properties for built-in nodes.
## NodeOptions
```js {5-9}
import { Graph } from '@antv/g6';
const graph = new Graph({
node: {
type: 'circle', // Node type
style: {}, // Node style
state: {}, // State style
palette: {}, // Palette configuration
animation: {}, // Animation configuration
},
});
```
| Property | Description | Type | Default | Required |
| --------- | -------------------------------------------------------------- | ----------------------- | -------- | -------- |
| type | Node type, built-in node type name or custom node name | [Type](#type) | `circle` | |
| style | Node style configuration, including color, size, etc. | [Style](#style) | - | |
| state | Style configuration for different states | [State](#state) | - | |
| palette | Define node palette for mapping colors based on different data | [Palette](#palette) | - | |
| animation | Define animation effects for nodes | [Animation](#animation) | - | |
## Type
Specifies the node type, built-in node type name or custom node name. Default is `circle`. **⚠️ Note**: This determines the shape of the main graphic.
```js {3}
const graph = new Graph({
node: {
type: 'circle',
},
});
```
**⚠️ Dynamic Configuration**: The `type` property also supports dynamic configuration, allowing you to dynamically select node types based on node data:
```js
const graph = new Graph({
node: {
// Static configuration
type: 'circle',
// Dynamic configuration - arrow function form
type: (datum) => datum.data.nodeType || 'circle',
// Dynamic configuration - regular function form (can access graph instance)
type: function (datum) {
console.log(this); // graph instance
return datum.data.category === 'important' ? 'diamond' : 'circle';
},
},
});
```
Available values:
- `circle`: [Circle Node](/en/manual/element/node/circle)
- `diamond`: [Diamond Node](/en/manual/element/node/diamond)
- `donut`: [Donut Node](/en/manual/element/node/donut)
- `ellipse`: [Ellipse Node](/en/manual/element/node/ellipse)
- `hexagon`: [Hexagon Node](/en/manual/element/node/hexagon)
- `html`: [HTML Node](/en/manual/element/node/html)
- `image`: [Image Node](/en/manual/element/node/image)
- `rect`: [Rectangle Node](/en/manual/element/node/rect)
- `star`: [Star Node](/en/manual/element/node/star)
- `triangle`: [Triangle Node](/en/manual/element/node/triangle)
## Style
Defines the style of nodes, including color, size, etc.
```js {3}
const graph = new Graph({
node: {
style: {},
},
});
```
**⚠️ Dynamic Configuration**: All the following style properties support dynamic configuration, meaning you can pass functions to dynamically calculate property values based on node data:
```js
const graph = new Graph({
node: {
style: {
// Static configuration
fill: '#1783FF',
// Dynamic configuration - arrow function form
stroke: (datum) => (datum.data.isActive ? '#FF0000' : '#000000'),
// Dynamic configuration - regular function form (can access graph instance)
lineWidth: function (datum) {
console.log(this); // graph instance
return datum.data.importance > 5 ? 3 : 1;
},
// Nested properties also support dynamic configuration
labelText: (datum) => `Node: ${datum.id}`,
badges: (datum) => datum.data.tags.map((tag) => ({ text: tag })),
},
},
});
```
Where the `datum` parameter is the node data object (`NodeData`), containing all data information of the node.
A complete node consists of the following parts:
<img width="200" src="https://mdn.alipayobjects.com/huamei_qa8qxu/afts/img/A*Ot4bSbBx97EAAAAAAAAAAAAADmJ7AQ/original" />
- `key`: The main graphic of the node, representing the primary shape of the node, such as rectangle, circle, etc.
- `label`: Text label, usually used to display the name or description of the node
- `icon`: Icon graphic, usually used to display node icons, can be images or text icons
- `badge`: Badge, by default located at the top-right corner of the node
- `halo`: Graphic showing halo effect around the main graphic
- `port`: Connection points on the node, used to connect edges
The following style configurations are explained in order by atomic graphics:
### Main Graphic Style
The main graphic is the core part of the node, defining the basic shape and appearance of the node. Here are common configuration scenarios:
#### Basic Style Configuration
Setting the basic appearance of nodes:
```js | ob { inject: true }
import { Graph } from '@antv/g6';
const graph = new Graph({
container: 'container',
width: 200,
height: 100,
autoFit: 'center',
data: { nodes: [{ id: 'node1' }] },
node: {
style: {
fill: '#5B8FF9', // Blue fill
stroke: '#1A1A1A', // Dark stroke
lineWidth: 2,
size: 40,
},
},
});
graph.render();
```
#### Transparency and Shadow Effects
Adding transparency and shadow effects to nodes:
```js | ob { inject: true }
import { Graph } from '@antv/g6';
const graph = new Graph({
container: 'container',
width: 200,
height: 100,
autoFit: 'center',
data: { nodes: [{ id: 'node1' }] },
node: {
style: {
fill: '#61DDAA',
fillOpacity: 0.85,
shadowColor: 'rgba(97, 221, 170, 0.4)',
shadowBlur: 12,
shadowOffsetX: 2,
shadowOffsetY: 4,
stroke: '#F0F0F0',
lineWidth: 1,
},
},
});
graph.render();
```
#### Dashed Border Style
Creating nodes with dashed borders:
```js | ob { inject: true }
import { Graph } from '@antv/g6';
const graph = new Graph({
container: 'container',
width: 200,
height: 100,
autoFit: 'center',
data: { nodes: [{ id: 'node1' }] },
node: {
style: {
fill: '#FFF1F0',
stroke: '#F5222D',
lineWidth: 2,
lineDash: [6, 4],
lineCap: 'round',
},
},
});
graph.render();
```
The complete main graphic style configuration is as follows:
| Property | Description | Type | Default | Required |
| ------------------------------- | ------------------------------------------------------------------------------------------------------------------------------------------------ | ----------------------------- | --------- | -------- |
| collapsed | Whether the current node/combo is collapsed | boolean | false | |
| cursor | Node mouse hover style, [options](#cursor) | string | default | |
| fill | Node fill color | string | `#1783FF` | |
| fillOpacity | Node fill color transparency | number \| string | 1 | |
| increasedLineWidthForHitTesting | When lineWidth is small, the interactive area also becomes small. Sometimes we want to increase this area to make "thin lines" easier to pick up | number | 0 | |
| lineCap | Node stroke end style | `round` \| `square` \| `butt` | `butt` | |
| lineDash | Node stroke dash style | number[] | - | |
| lineDashOffset | Node stroke dash offset | number | - | |
| lineJoin | Node stroke join style | `round` \| `bevel` \| `miter` | `miter` | |
| lineWidth | Node stroke width | number | 1 | |
| opacity | Node transparency | number \| string | 1 | |
| pointerEvents | How the node responds to pointer events, [options](#pointerevents) | string | `auto` | |
| shadowBlur | Node shadow blur | number | - | |
| shadowColor | Node shadow color | string | - | |
| shadowOffsetX | Node shadow offset in x-axis direction | number \| string | - | |
| shadowOffsetY | Node shadow offset in y-axis direction | number \| string | - | |
| shadowType | Node shadow type | `inner` \| `outer` | `outer` | |
| size | Node size, quick setting for node width and height, [options](#size) | number \| number[] | 32 | |
| stroke | Node stroke color | string | `#000` | |
| strokeOpacity | Node stroke color transparency | number \| string | 1 | |
| transform | Transform property allows you to rotate, scale, skew or translate the given node | string | - | |
| transformOrigin | Rotation and scaling center, also called transformation center | string | - | |
| visibility | Whether the node is visible | `visible` \| `hidden` | `visible` | |
| x | Node x coordinate | number | 0 | |
| y | Node y coordinate | number | 0 | |
| z | Node z coordinate | number | 0 | |
| zIndex | Node rendering level | number | 0 | |
#### Size
Node size, quick setting for node width and height, supports three configuration methods:
- number: Indicates that the node width and height are the same as the specified value
- [number, number]: Indicates that the node width and height are represented by array elements indicating the node's width and height respectively
- [number, number, number]: Indicates that the node width, height, and depth are represented by array elements
#### PointerEvents
The `pointerEvents` property controls how graphics respond to interaction events. You can refer to the [MDN documentation](https://developer.mozilla.org/en-US/docs/Web/CSS/pointer-events).
Available values: `visible` | `visiblepainted` | `visiblestroke` | `non-transparent-pixel` | `visiblefill` | `visible` | `painted` | `fill` | `stroke` | `all` | `none` | `auto` | `inherit` | `initial` | `unset`
In short, `fill`, `stroke`, and `visibility` can independently or in combination affect pick behavior. Currently supports the following keywords:
- **`auto`**: Default value, equivalent to `visiblepainted`
- **`none`**: Will never be a target for responding to events
- **`visiblepainted`**: Will respond to events only if the following conditions are met:
- `visibility` is set to `visible`, i.e., the graphic is visible
- Triggered in the graphic fill area and `fill` takes a non-`none` value; or triggered in the graphic stroke area and `stroke` takes a non-`none` value
- **`visiblefill`**: Will respond to events only if the following conditions are met:
- `visibility` is set to `visible`, i.e., the graphic is visible
- Triggered in the graphic fill area, not affected by the value of `fill`
- **`visiblestroke`**: Will respond to events only if the following conditions are met:
- `visibility` is set to `visible`, i.e., the graphic is visible
- Triggered in the graphic stroke area, not affected by the value of `stroke`
- **`visible`**: Will respond to events only if the following conditions are met:
- `visibility` is set to `visible`, i.e., the graphic is visible
- Triggered in the graphic fill or stroke area, not affected by the values of `fill` and `stroke`
- **`painted`**: Will respond to events only if the following conditions are met:
- Triggered in the graphic fill area and `fill` takes a non-`none` value; or triggered in the graphic stroke area and `stroke` takes a non-`none` value
- Not affected by the value of `visibility`
- **`fill`**: Will respond to events only if the following conditions are met:
- Triggered in the graphic fill area, not affected by the value of `fill`
- Not affected by the value of `visibility`
- **`stroke`**: Will respond to events only if the following conditions are met:
- Triggered in the graphic stroke area, not affected by the value of `stroke`
- Not affected by the value of `visibility`
- **`all`**: Will respond to events as long as entering the fill and stroke areas of the graphic, not affected by the values of `fill`, `stroke`, and `visibility`
**Usage Examples:**
```js
// Example 1: Only stroke area responds to events
const graph = new Graph({
node: {
style: {
fill: 'none',
stroke: '#000',
lineWidth: 2,
pointerEvents: 'stroke', // Only stroke responds to events
},
},
});
// Example 2: Completely unresponsive to events
const graph = new Graph({
node: {
style: {
pointerEvents: 'none', // Node does not respond to any events
},
},
});
```
#### Cursor
Available values: `auto` | `default` | `none` | `context-menu` | `help` | `pointer` | `progress` | `wait` | `cell` | `crosshair` | `text` | `vertical-text` | `alias` | `copy` | `move` | `no-drop` | `not-allowed` | `grab` | `grabbing` | `all-scroll` | `col-resize` | `row-resize` | `n-resize` | `e-resize` | `s-resize` | `w-resize` | `ne-resize` | `nw-resize` | `se-resize` | `sw-resize` | `ew-resize` | `ns-resize` | `nesw-resize` | `nwse-resize` | `zoom-in` | `zoom-out`
### Label Style
Labels are used to display text information of nodes, supporting various style configurations and layout methods. Here are common usage scenarios:
#### Basic Text Label
The simplest text label configuration:
```js | ob { inject: true }
import { Graph } from '@antv/g6';
const graph = new Graph({
container: 'container',
width: 200,
height: 120,
autoFit: 'center',
data: { nodes: [{ id: 'node1' }] },
node: {
style: {
labelText: 'Node Name',
labelFill: '#262626',
labelFontSize: 12,
labelPlacement: 'bottom',
},
},
});
graph.render();
```
#### Multi-line Text Label
When text is long, you can set automatic line wrapping:
```js | ob { inject: true }
import { Graph } from '@antv/g6';
const graph = new Graph({
container: 'container',
width: 200,
height: 120,
autoFit: 'center',
data: { nodes: [{ id: 'node1' }] },
node: {
style: {
labelText: 'This is a very long node name that needs line wrapping',
labelWordWrap: true,
labelMaxWidth: '150%',
labelMaxLines: 3,
labelTextOverflow: 'ellipsis',
labelFill: '#434343',
labelPlacement: 'bottom',
labelTextAlign: 'center',
},
},
});
graph.render();
```
#### Label with Background
Adding background to labels to improve readability:
```js | ob { inject: true }
import { Graph } from '@antv/g6';
const graph = new Graph({
container: 'container',
width: 200,
height: 120,
autoFit: 'center',
data: { nodes: [{ id: 'node1' }] },
node: {
style: {
labelText: 'Important Node',
labelBackground: true,
labelBackgroundFill: 'rgba(250, 140, 22, 0.1)',
labelBackgroundRadius: 6,
labelPadding: [6, 12],
labelFill: '#D4380D',
labelFontWeight: 'bold',
labelPlacement: 'bottom',
},
},
});
graph.render();
```
The complete label style configuration is as follows:
| Property | Description | Type | Default | Required |
| ------------------------ | ---------------------------------------------------------------------------------------------------------------------------------- | --------------------------------------------------------------------------- | --------- | -------- |
| label | Whether to display node label | boolean | true | |
| labelCursor | Style displayed when mouse hovers over node label, [options](#cursor) | string | `default` | |
| labelFill | Node label text color | string | - | |
| labelFontFamily | Node label font family | string | - | |
| labelFontSize | Node label font size | number | 12 | |
| labelFontStyle | Node label font style | `normal` \| `italic` \| `oblique` | - | |
| labelFontVariant | Node label font variant | `normal` \| `small-caps` \| string | - | |
| labelFontWeight | Node label font weight | `normal` \| `bold` \| `bolder` \| `lighter` \| number | - | |
| labelLeading | Line spacing | number | 0 | |
| labelLetterSpacing | Node label letter spacing | number \| string | - | |
| labelLineHeight | Node label line height | number \| string | - | |
| labelMaxLines | Maximum number of lines for node label | number | 1 | |
| labelMaxWidth | Maximum width of node label, [options](#labelmaxwidth) | number \| string | `200%` | |
| labelOffsetX | Node label offset in x-axis direction | number | 0 | |
| labelOffsetY | Node label offset in y-axis direction | number | 0 | |
| labelPadding | Node label padding | number \| number[] | 0 | |
| labelPlacement | Position of node label relative to node main graphic, [options](#labelplacement) | string | `bottom` | |
| labelText | Node label text content | `string` \| `(datum) => string` | - | |
| labelTextAlign | Node label text horizontal alignment | `start` \| `center` \| `middle` \| `end` \| `left` \| `right` | `left` | |
| labelTextBaseline | Node label text baseline | `top` \| `hanging` \| `middle` \| `alphabetic` \| `ideographic` \| `bottom` | - | |
| labelTextDecorationColor | Node label text decoration line color | string | - | |
| labelTextDecorationLine | Node label text decoration line | string | - | |
| labelTextDecorationStyle | Node label text decoration line style | `solid` \| `double` \| `dotted` \| `dashed` \| `wavy` | - | |
| labelTextOverflow | Node label text overflow handling | `clip` \| `ellipsis` \| string | - | |
| labelTextPath | Node label text path | Path | - | |
| labelWordWrap | Whether node label enables automatic line wrapping. After enabling labelWordWrap, parts exceeding labelMaxWidth wrap automatically | boolean | false | |
| labelZIndex | Node label rendering level | number | 0 | |
#### LabelPlacement
Available values: `left` | `right` | `top` | `bottom` | `left-top` | `left-bottom` | `right-top` | `right-bottom` | `top-left` | `top-right` | `bottom-left` | `bottom-right` | `center` | `bottom`
#### LabelMaxWidth
After enabling automatic line wrapping `labelWordWrap`, text wraps when exceeding this width:
- string: Defines maximum width as a percentage relative to node width. For example, `50%` means label width does not exceed half of the node width
- number: Defines maximum width in pixels. For example, 100 means the maximum width of the label is 100 pixels
For example, setting multi-line label text:
```json
{
"labelWordWrap": true,
"labelMaxWidth": 200,
"labelMaxLines": 3
}
```
### Label Background Style
Label background is used to display the background of node labels:
| Property | Description | Type | Default |
| ----------------------------- | ----------------------------------------------------------------------------------------------------------------------------------------------------------------------------------- | ---------------------------------------- | --------- |
| labelBackground | Whether to display node label background | boolean | false |
| labelBackgroundCursor | Node label background mouse hover style, [options](#cursor) | string | `default` |
| labelBackgroundFill | Node label background fill color | string | - |
| labelBackgroundFillOpacity | Node label background transparency | number | 1 |
| labelBackgroundHeight | Node label background height | string \| number | - |
| labelBackgroundLineDash | Node label background dash configuration | number \| string \|(number \| string )[] | - |
| labelBackgroundLineDashOffset | Node label background dash offset | number | - |
| labelBackgroundLineWidth | Node label background stroke line width | number | - |
| labelBackgroundRadius | Node label background border radius <br> - number: Uniform setting for four border radii <br> - number[]: Set four border radii separately, automatically supplement missing values | number \| number[] | 0 |
| labelBackgroundShadowBlur | Node label background shadow blur degree | number | - |
| labelBackgroundShadowColor | Node label background shadow color | string | - |
| labelBackgroundShadowOffsetX | Node label background shadow X direction offset | number | - |
| labelBackgroundShadowOffsetY | Node label background shadow Y direction offset | number | - |
| labelBackgroundStroke | Node label background stroke color | string | - |
| labelBackgroundStrokeOpacity | Node label background stroke transparency | number \| string | 1 |
| labelBackgroundVisibility | Whether node label background is visible | `visible` \| `hidden` | - |
| labelBackgroundZIndex | Node label background rendering level | number | 1 |
### Halo Style
Halo is an effect displayed around the node's main graphic, usually used for highlighting or indicating special states of nodes.
#### Basic Halo Effect
Adding basic halo effect to nodes:
```js | ob { inject: true }
import { Graph } from '@antv/g6';
const graph = new Graph({
container: 'container',
width: 200,
height: 100,
autoFit: 'center',
data: { nodes: [{ id: 'node1' }] },
node: {
style: {
lineWidth: 1.5,
halo: true,
haloStroke: '#1890FF',
haloLineWidth: 6,
haloStrokeOpacity: 0.3,
},
},
});
graph.render();
```
The complete halo style configuration is as follows:
| Property | Description | Type | Default | Required |
| ----------------- | ----------------------------------------------------------------------------------------------------------------------------- | ---------------------- | --------------------------------------- | -------- |
| halo | Whether to display node halo | boolean | false | |
| haloCursor | Node halo mouse hover style, [options](#cursor) | string | `default` | |
| haloDraggable | Whether node halo allows dragging | boolean | true | |
| haloDroppable | Whether node halo allows receiving dragged elements | boolean | true | |
| haloFillRule | Node halo fill rule | `nonzero` \| `evenodd` | - | |
| haloFilter | Node halo filter | string | - | |
| haloLineWidth | Node halo stroke width | number | 3 | |
| haloPointerEvents | Whether node halo effect responds to pointer events, [options](#pointerevents) | string | `none` | |
| haloStroke | Node halo stroke color, **this property is used to set the color of the halo around the node, helping to highlight the node** | string | Consistent with main graphic fill color | |
| haloStrokeOpacity | Node halo stroke color transparency | number | 0.25 | |
| haloVisibility | Node halo visibility | `visible` \| `hidden` | `visible` | |
| haloZIndex | Node halo rendering level | number | -1 | |
### Icon Style
Node icons support three common usage methods: text icons, image icons, and IconFont icons. The configurations for these three methods are shown below:
#### 1. Text Icons
Using text directly as icons, suitable for simple identifiers:
```js | ob { inject: true }
import { Graph } from '@antv/g6';
const graph = new Graph({
container: 'container',
width: 200,
height: 100,
autoFit: 'center',
data: { nodes: [{ id: 'node1' }] },
node: {
style: {
fill: '#FFF0F6',
stroke: '#EB2F96',
lineWidth: 1.5,
iconText: 'A', // Icon text content
iconFill: '#C41D7F', // Deep pink icon
iconFontSize: 16,
iconFontWeight: 'bold',
},
},
});
graph.render();
```
#### 2. Image Icons
Using images as icons, supporting various image formats:
```js | ob { inject: true }
import { Graph } from '@antv/g6';
const graph = new Graph({
container: 'container',
width: 200,
height: 100,
autoFit: 'center',
data: { nodes: [{ id: 'node1' }] },
node: {
style: {
fill: '#F6FFED',
stroke: '#52C41A',
lineWidth: 1.5,
iconSrc:
'data:image/svg+xml;base64,PHN2ZyB3aWR0aD0iMjQiIGhlaWdodD0iMjQiIHZpZXdCb3g9IjAgMCAyNCAyNCIgZmlsbD0ibm9uZSIgeG1sbnM9Imh0dHA6Ly93d3cudzMub3JnLzIwMDAvc3ZnIj4KPHBhdGggZD0iTTEyIDJMMTMuMDkgOC4yNkwyMSA5TDEzLjA5IDE1Ljc4TDEyIDIyTDEwLjkxIDE1Ljc4TDMgOUwxMC45MSA4LjI2TDEyIDJaIiBmaWxsPSIjNTJDNDFBIi8+Cjwvc3ZnPgo=',
iconWidth: 20,
iconHeight: 20,
},
},
});
graph.render();
```
#### 3. IconFont Icons
Using IconFont font icons, you need to import the corresponding font files first:
```js | ob { inject: true }
import { Graph, iconfont } from '@antv/g6';
const style = document.createElement('style');
style.innerHTML = `@import url('${iconfont.css}');`;
document.head.appendChild(style);
const graph = new Graph({
container: 'container',
width: 200,
height: 100,
autoFit: 'center',
data: { nodes: [{ id: 'node1' }] },
node: {
style: {
fill: '#E6F7FF', // Light blue background
stroke: '#1890FF', // Blue border
lineWidth: 1.5,
iconFontFamily: 'iconfont',
iconText: '\ue602',
iconFill: '#1890FF',
},
},
});
graph.render();
```
The complete icon style configuration is as follows:
| Property | Description | Type | Default |
| ----------------------- | ---------------------------------------------------- | --------------------------------------------------------------------------- | --------------------------- |
| icon | Whether to display node icon | boolean | true |
| iconFill | Node icon text color | string | - |
| iconFontFamily | Node icon font family | string | - |
| iconFontSize | Node icon font size | number | 16 |
| iconFontStyle | Node icon font style | `normal` \| `italic` \| `oblique` | `normal` |
| iconFontVariant | Node icon font variant | `normal` \| `small-caps` \| string | `normal` |
| iconFontWeight | Node icon font weight | number \| string | `normal` |
| iconHeight | Node icon height | number | Half of main graphic height |
| iconLetterSpacing | Node icon text letter spacing | number \| string | - |
| iconLineHeight | Node icon text line height | number \| string | - |
| iconMaxLines | Maximum lines for node icon text | number | 1 |
| iconRadius | Node icon border radius | number | 0 |
| iconSrc | Node image source. Has higher priority than iconText | string | - |
| iconText | Node icon text | string | - |
| iconTextAlign | Node icon text horizontal alignment | `start` \| `center` \| `middle` \| `end` \| `left` \| `right` | `left` |
| iconTextBaseline | Node icon text baseline | `top` \| `hanging` \| `middle` \| `alphabetic` \| `ideographic` \| `bottom` | `alphabetic` |
| iconTextDecorationColor | Node icon text decoration line color | string | - |
| iconTextDecorationLine | Node icon text decoration line | string | - |
| iconTextDecorationStyle | Node icon text decoration line style | `solid` \| `double` \| `dotted` \| `dashed` \| `wavy` | `solid` |
| iconTextOverflow | Node icon text overflow handling | `clip` \| `ellipsis` \| string | `clip` |
| iconWidth | Node icon width | number | Half of main graphic width |
| iconWordWrap | Whether node icon text automatically wraps | boolean | - |
### Badge Style
Badges are small markers displayed on nodes, usually used to show status, quantity, or other auxiliary information. Supports displaying multiple badges simultaneously with customizable positions.
#### Single Badge
Adding a simple badge to a node:
```js | ob { inject: true }
import { Graph } from '@antv/g6';
const graph = new Graph({
container: 'container',
width: 200,
height: 100,
autoFit: 'center',
data: { nodes: [{ id: 'node1' }] },
node: {
style: {
badges: [
{ text: 'NEW' }, // Default display at the top
],
},
},
});
graph.render();
```
#### Multiple Badges
Adding multiple badges at different positions to a node:
```js | ob { inject: true }
import { Graph } from '@antv/g6';
const graph = new Graph({
container: 'container',
width: 200,
height: 100,
autoFit: 'center',
data: { nodes: [{ id: 'node1' }] },
node: {
style: {
badge: true, // Whether to display badges
badges: [
{ text: 'A', placement: 'right-top' },
{ text: 'Important', placement: 'right' },
{ text: 'Notice', placement: 'right-bottom' },
],
badgePalette: ['#7E92B5', '#F4664A', '#FFBE3A'], // Badge background color palette
badgeFontSize: 7, // Badge font size
},
},
});
graph.render();
```
#### Custom Badge Style
Completely customizing badge appearance:
```js | ob { inject: true }
import { Graph } from '@antv/g6';
const graph = new Graph({
container: 'container',
width: 200,
height: 100,
autoFit: 'center',
data: { nodes: [{ id: 'node1' }] },
node: {
style: {
badges: [
{
text: '99+',
placement: 'right-top',
backgroundFill: '#FF4D4F', // Red background
fill: '#fff', // White text
fontSize: 10,
padding: [2, 6],
backgroundRadius: 8,
},
],
},
},
});
graph.render();
```
The complete badge style configuration is as follows:
| Property | Description | Type | Default |
| ------------ | -------------------------------- | ------------------------------------- | --------------------------------- |
| badge | Whether the node displays badges | boolean | true |
| badgePalette | Badge background color palette | string[] | [`#7E92B5`, `#F4664A`, `#FFBE3A`] |
| badges | Node badge settings | [BadgeStyleProps](#badgestyleprops)[] | - |
#### BadgeStyleProps
| Property | Description | Type | Default |
| ------------------------ | ------------------------------------------------------------------------------------------------------------------------------------------------------------------------------------------------------------------------------------------------------------------------------------------------------------------- | ---------------------------------------------------------------------------------------------------------------------------------------------------------------------- | ------------ |
| background | Whether node badge displays background | boolean | true |
| backgroundCursor | Node badge background mouse hover style, [options](#cursor) | string | `default` |
| backgroundFill | Node badge background fill color. If not specified, badgePalette is considered for allocation in order | string | - |
| backgroundFillOpacity | Node badge background fill transparency | number | 1 |
| backgroundFilter | Node badge background filter | string | - |
| backgroundHeight | Node badge background height | number \| string | - |
| backgroundLineDash | Node badge background dash configuration | number \| string \|(number \| string )[] | - |
| backgroundLineDashOffset | Node badge background dash offset | number | - |
| backgroundLineWidth | Node badge background stroke line width | number | - |
| backgroundRadius | Node badge background border radius <br> - number: Uniform setting for four border radii <br> - number[]: Set four border radii separately, automatically supplement missing values <br> - string: Similar to [CSS padding](https://developer.mozilla.org/en-US/docs/Web/CSS/padding) property, separated by spaces | number \| number[] \| string | 0 |
| backgroundShadowBlur | Node badge background shadow blur degree | number | - |
| backgroundShadowColor | Node badge background shadow color | string | - |
| backgroundShadowOffsetX | Node badge background shadow X direction offset | number | - |
| backgroundShadowOffsetY | Node badge background shadow Y direction offset | number | - |
| backgroundStroke | Node badge background stroke color | string | - |
| backgroundStrokeOpacity | Node badge background stroke transparency | number \| string | 1 |
| backgroundVisibility | Whether node badge background is visible | `visible` \| `hidden` | - |
| backgroundZIndex | Node badge background rendering level | number | - |
| fill | Node badge text color | string | - |
| fontFamily | Node badge font family | string | - |
| fontSize | Node badge font size | number | 8 |
| fontStyle | Node badge font style | `normal` \| `italic` \| `oblique` | `normal` |
| fontVariant | Node badge font variant | `normal` \| `small-caps` \| string | `normal` |
| fontWeight | Node badge font weight | number \| string | `normal` |
| lineHeight | Node badge line height | string \| number | - |
| lineWidth | Node badge line width | string \| number | - |
| maxLines | Maximum lines for node badge text | number | 1 |
| offsetX | Node badge offset in x-axis direction | number | 0 |
| offsetY | Node badge offset in y-axis direction | number | 0 |
| padding | Node badge padding | number \| number[] | 0 |
| placement | Position of node badge relative to node main graphic. If not specified, defaults to clockwise arrangement starting from top-right corner | `left` \| `right` \| `top` \| `bottom` \| `left-top` \| `left-bottom` \| `right-top` \| `right-bottom` \| `top-left` \| `top-right` \| `bottom-left` \| `bottom-right` | - |
| text | Node badge text content | string | - |
| textAlign | Node badge text horizontal alignment | `start` \| `center` \| `middle` \| `end` \| `left` \| `right` | `left` |
| textBaseline | Node badge text baseline | `top` \| `hanging` \| `middle` \| `alphabetic` \| `ideographic` \| `bottom` | `alphabetic` |
| textDecorationColor | Node badge text decoration line color | string | - |
| textDecorationLine | Node badge text decoration line | string | - |
| textDecorationStyle | Node badge text decoration line style | `solid` \| `double` \| `dotted` \| `dashed` \| `wavy` | `solid` |
| textOverflow | Node badge text overflow handling | `clip` \| `ellipsis` \| string | `clip` |
| visibility | Whether node badge is visible | `visible` \| `hidden` | - |
| wordWrap | Whether node badge text automatically wraps | boolean | - |
| zIndex | Node badge rendering level | number | 3 |
### Port Style
Ports are connection points on nodes, used to connect edges. Supports adding multiple ports at different positions on nodes with customizable styles.
#### Basic Ports
Adding four basic directional ports to a node:
```js | ob { inject: true }
import { Graph } from '@antv/g6';
const graph = new Graph({
container: 'container',
width: 200,
height: 100,
autoFit: 'center',
data: { nodes: [{ id: 'node1' }] },
node: {
style: {
port: true,
ports: [
{ key: 'top', placement: 'top', fill: '#7E92B5' },
{ key: 'right', placement: 'right', fill: '#F4664A' },
{ key: 'bottom', placement: 'bottom', fill: '#FFBE3A' },
{ key: 'left', placement: 'left', fill: '#D580FF' },
],
portR: 3,
portLineWidth: 1,
portStroke: '#fff',
},
},
});
graph.render();
```
#### Custom Position Ports
Using percentages or absolute coordinates to precisely position ports:
```js | ob { inject: true }
import { Graph } from '@antv/g6';
const graph = new Graph({
container: 'container',
width: 200,
height: 100,
autoFit: 'center',
data: { nodes: [{ id: 'node1' }] },
node: {
style: {
ports: [
{ key: 'custom1', placement: [0.2, 0] }, // Relative position: 20% from top-left
{ key: 'custom2', placement: [0.8, 0] }, // Relative position: 80% from top-right
{ key: 'custom3', placement: [1, 0.5] }, // Relative position: right center
],
portR: 4,
portLineWidth: 1,
portStroke: '#fff',
},
},
});
graph.render();
```
#### Differentiated Port Styles
Setting different styles for different ports:
```js | ob { inject: true }
import { Graph } from '@antv/g6';
const graph = new Graph({
container: 'container',
width: 200,
height: 100,
autoFit: 'center',
data: { nodes: [{ id: 'node1' }] },
node: {
style: {
ports: [
{
key: 'input',
placement: 'left',
fill: '#52C41A', // Green input port
r: 4,
},
{
key: 'output',
placement: 'right',
fill: '#FF4D4F', // Red output port
r: 4,
},
],
portStroke: '#fff', // Unified stroke color
portLineWidth: 2,
},
},
});
graph.render();
```
The complete port style configuration is as follows:
| Property | Description | Type | Default | Required |
| -------- | ------------------------------------------------------------ | ----------------------------------- | ------- | -------- |
| port | Whether the node displays ports | boolean | true | |
| ports | Node port configuration, supports configuring multiple ports | [PortStyleProps](#portstyleprops)[] | - | |
#### PortStyleProps
| Property | Description | Type | Default | Required |
| ----------------- | ------------------------------------------------------------------------------------------------------------------------------------------------------------------------------------------------------------------------------------------------------------ | ------------------------------------------------------------------------------------------------------------------------------------------------------------------------------------------------------ | --------- | -------- |
| key | Key value of node port, defaults to the index of the node port | string | - | |
| placement | Position of node port relative to node main graphic | `left` \| `right` \| `top` \| `bottom` \| `center` \| `left-top` \| `left-bottom` \| `right-top` \| `right-bottom` \| `top-left` \| `top-right` \| `bottom-left` \| `bottom-right` \| [number, number] | - | ✓ |
| r | Node port radius <br> - If set to undefined, the port is treated as a point, not displayed on canvas but exists, edges will preferentially connect to the nearest port <br> - If set to a number, the port is treated as a circle with radius specified here | number | - | |
| linkToCenter | Whether edges connect to the center of the node port <br> - If true, edges connect to the center of the node port <br> - If false, edges connect to the edge of the node port | boolean | false | |
| cursor | Node port mouse hover style, [options](#cursor) | string | `default` | |
| fill | Node port fill color | string | - | |
| fillOpacity | Node port fill transparency | number | 1 | |
| isBillboard | Whether node port has Billboard effect | boolean | - | |
| isSizeAttenuation | Whether node port enables size attenuation | boolean | - | |
| lineDash | Node port stroke dash configuration | number \| string \|(number \| string )[] | - | |
| lineDashOffset | Node port stroke dash offset | number | - | |
| lineWidth | Node port stroke line width | number | - | |
| shadowBlur | Node port shadow blur degree | number | - | |
| shadowColor | Node port shadow color | string | - | |
| shadowOffsetX | Node port shadow X direction offset | number | - | |
| shadowOffsetY | Node port shadow Y direction offset | number | - | |
| stroke | Node port stroke color | string | - | |
| strokeOpacity | Node port stroke transparency | number \| string | 1 | |
| visibility | Whether node port is visible | `visible` \| `hidden` | `visible` | |
| zIndex | Node port rendering level | number | 2 | |
## State
In some interactive behaviors, such as clicking to select a node or hovering to activate an edge, only certain state identifications are made on the element. To reflect these states in the visual space seen by end users, we need to set different graphic element styles for different states to respond to changes in the state of the graphic element.
G6 provides several built-in states, including selected, highlight, active, inactive, and disabled. In addition, it also supports custom states to meet more specific needs. For each state, developers can define a set of style rules that will override the element's default styles.
<img width="520" src="https://mdn.alipayobjects.com/huamei_qa8qxu/afts/img/A*t2qvRp92itkAAAAAAAAAAAAADmJ7AQ/original" />
The data structure is as follows:
```typescript
type NodeState = {
[state: string]: NodeStyle;
};
```
For example, when a node is in the `focus` state, you can add a stroke with width 3 and orange color.
```js {4-7}
const graph = new Graph({
node: {
state: {
focus: {
lineWidth: 3, // Stroke width
stroke: 'orange', // Stroke color
},
},
},
});
```
The effect is shown in the figure below:
```js | ob { pin: false, inject: true }
import { Graph } from '@antv/g6';
const graph = new Graph({
container: 'container',
width: 200,
height: 100,
autoFit: 'center',
data: {
nodes: [{ id: 'node1', states: ['focus'] }],
},
node: {
state: {
focus: {
lineWidth: 3,
stroke: 'orange',
},
},
},
});
graph.render();
```
## Animation
Defines animation effects for nodes, supporting the following two configuration methods:
1. Disable all node animations
```json
{
"node": {
"animation": false
}
}
```
2. Configure stage animations
Stage animations refer to animation effects when nodes enter the canvas, update, or leave the canvas. Currently supported stages include:
- `enter`: Animation when nodes enter the canvas
- `update`: Animation when nodes are updated
- `exit`: Animation when nodes leave the canvas
- `show`: Animation when nodes are shown from hidden state
- `hide`: Animation when nodes are hidden
- `collapse`: Animation when nodes are collapsed
- `expand`: Animation when nodes are expanded
You can refer to [Animation Paradigm](/en/manual/animation/animation#animation-paradigm) to use animation syntax to configure nodes, such as:
```json
{
"node": {
"animation": {
"update": [
{
"fields": ["x", "y"], // Only animate x and y properties during updates
"duration": 1000, // Animation duration
"easing": "linear" // Easing function
}
]
}
}
}
```
You can also use built-in animation effects:
```json
{
"node": {
"animation": {
"enter": "fade", // Use fade animation
"update": "translate", // Use translate animation
"exit": "fade" // Use fade animation
}
}
}
```
You can pass false to disable animations for specific stages:
```json
{
"node": {
"animation": {
"enter": false // Disable node entrance animation
}
}
}
```
## Palette
Defines the color palette for nodes, i.e., predefined node color pool, and allocates according to rules, mapping colors to the `fill` property.
> For the definition of palettes, please refer to [Palette](/en/manual/theme/palette).
| Property | Description | Type | Default |
| -------- | --------------------------------------------------------------------------------------------------------------------- | ----------------------------- | ------- |
| color | Palette colors. If the palette is registered, you can directly specify its registration name, or accept a color array | string \| string[] | - |
| field | Specify the grouping field in element data. If not specified, defaults to id as the grouping field | string \| ((datum) => string) | `id` |
| invert | Whether to invert the palette | boolean | false |
| type | Specify the current palette type. <br> - `group`: Discrete palette <br> - `value`: Continuous palette | `group` \| `value` | `group` |
For example, assigning node colors to a group of data by `category` field, so that nodes of the same category have the same color:
```json
{
"node": {
"palette": {
"type": "group",
"field": "category",
"color": ["#1783FF", "#F08F56", "#D580FF", "#00C9C9", "#7863FF"]
}
}
}
```
The effect is shown in the figure below:
```js | ob { pin: false, inject: true }
import { Graph } from '@antv/g6';
const graph = new Graph({
container: 'container',
width: 600,
height: 100,
data: {
nodes: new Array(10)
.fill(0)
.map((_, i) => ({ id: `node-${i}`, data: { category: ['A', 'B', 'C', 'D', 'E'][i % 5] } })),
},
layout: { type: 'grid', cols: 10 },
node: {
palette: {
type: 'group',
field: 'category',
color: ['#1783FF', '#F08F56', '#D580FF', '#00C9C9', '#7863FF'],
},
},
});
graph.render();
```
You can also use default configuration:
```json
{
"node": {
"palette": "tableau" // tableau is the palette name, defaults to assigning colors based on ID
}
}
```
The effect is shown in the figure below:
```js | ob { pin: false, inject: true }
import { Graph } from '@antv/g6';
const graph = new Graph({
container: 'container',
width: 600,
height: 100,
data: {
nodes: new Array(10)
.fill(0)
.map((_, i) => ({ id: `node-${i}`, data: { category: ['A', 'B', 'C', 'D', 'E'][i % 5] } })),
},
layout: { type: 'grid', cols: 10 },
node: {
palette: 'tableau',
},
});
graph.render();
```
Node Skill
packages/site/docs/manual/element/node/BaseNode.zh.md anthropic-skill ~16,794 tokens---
title: 节点通用配置项
order: 1
---
本文介绍内置节点通用属性配置。
## NodeOptions
```js {5-9}
import { Graph } from '@antv/g6';
const graph = new Graph({
node: {
type: 'circle', // 节点类型
style: {}, // 节点样式
state: {}, // 状态样式
palette: {}, // 色板配置
animation: {}, // 动画配置
},
});
```
| 属性 | 描述 | 类型 | 默认值 | 必选 |
| --------- | -------------------------------------------- | ----------------------- | -------- | ---- |
| type | 节点类型,内置节点类型名称或自定义节点的名称 | [Type](#type) | `circle` | |
| style | 节点样式配置,包括颜色、大小等 | [Style](#style) | - | |
| state | 不同状态下的样式配置 | [State](#state) | - | |
| palette | 定义节点的色板,用于根据不同数据映射颜色 | [Palette](#palette) | - | |
| animation | 定义节点的动画效果 | [Animation](#animation) | - | |
## Type
指定节点类型,内置节点类型名称或自定义节点的名称。默认为 `circle`(圆形)。**⚠️ 注意**:这里决定了主图形的形状。
```js {3}
const graph = new Graph({
node: {
type: 'circle',
},
});
```
**⚠️ 动态配置说明**:`type` 属性同样支持动态配置,可以根据节点数据动态选择节点类型:
```js
const graph = new Graph({
node: {
// 静态配置
type: 'circle',
// 动态配置 - 箭头函数形式
type: (datum) => datum.data.nodeType || 'circle',
// 动态配置 - 普通函数形式(可访问 graph 实例)
type: function (datum) {
console.log(this); // graph 实例
return datum.data.category === 'important' ? 'diamond' : 'circle';
},
},
});
```
可选值有:
- `circle`:[圆形节点](/manual/element/node/circle)
- `diamond`:[菱形节点](/manual/element/node/diamond)
- `donut`:[甜甜圈节点](/manual/element/node/donut)
- `ellipse`:[椭圆节点](/manual/element/node/ellipse)
- `hexagon`:[六边形节点](/manual/element/node/hexagon)
- `html`:[HTML 节点](/manual/element/node/html)
- `image`:[图片节点](/manual/element/node/image)
- `rect`:[矩形节点](/manual/element/node/rect)
- `star`:[星形节点](/manual/element/node/star)
- `triangle`:[三角形节点](/manual/element/node/triangle)
## Style
定义节点的样式,包括颜色、大小等。
```js {3}
const graph = new Graph({
node: {
style: {},
},
});
```
**⚠️ 动态配置说明**:以下所有样式属性都支持动态配置,即可以传入函数来根据节点数据动态计算属性值:
```js
const graph = new Graph({
node: {
style: {
// 静态配置
fill: '#1783FF',
// 动态配置 - 箭头函数形式
stroke: (datum) => (datum.data.isActive ? '#FF0000' : '#000000'),
// 动态配置 - 普通函数形式(可访问 graph 实例)
lineWidth: function (datum) {
console.log(this); // graph 实例
return datum.data.importance > 5 ? 3 : 1;
},
// 嵌套属性也支持动态配置
labelText: (datum) => `节点: ${datum.id}`,
badges: (datum) => datum.data.tags.map((tag) => ({ text: tag })),
},
},
});
```
其中 `datum` 参数为节点数据对象 (`NodeData`),包含节点的所有数据信息。
一个完整的节点由以下几部分构成:
<img width="200" src="https://mdn.alipayobjects.com/huamei_qa8qxu/afts/img/A*Ot4bSbBx97EAAAAAAAAAAAAADmJ7AQ/original" />
- `key` :节点的主图形,表示节点的主要形状,例如矩形、圆形等;
- `label` :文本标签,通常用于展示节点的名称或描述;
- `icon` :图标图形,通常用于展示节点的图标,可以是图片或者文本图标;
- `badge` :默认位于节点右上角的徽标;
- `halo` :主图形周围展示的光晕效果的图形;
- `port` :节点上的连接点,用于连接边。
以下样式配置将按原子图形依次说明:
### 主图形样式
主图形是节点的核心部分,定义了节点的基本形状和外观。以下是常见的配置场景:
#### 基础样式配置
设置节点的基本外观:
```js | ob { inject: true }
import { Graph } from '@antv/g6';
const graph = new Graph({
container: 'container',
width: 200,
height: 100,
autoFit: 'center',
data: { nodes: [{ id: 'node1' }] },
node: {
style: {
fill: '#5B8FF9', // 蓝色填充
stroke: '#1A1A1A', // 深色描边
lineWidth: 2,
size: 40,
},
},
});
graph.render();
```
#### 透明度和阴影效果
为节点添加透明度和阴影效果:
```js | ob { inject: true }
import { Graph } from '@antv/g6';
const graph = new Graph({
container: 'container',
width: 200,
height: 100,
autoFit: 'center',
data: { nodes: [{ id: 'node1' }] },
node: {
style: {
fill: '#61DDAA',
fillOpacity: 0.85,
shadowColor: 'rgba(97, 221, 170, 0.4)',
shadowBlur: 12,
shadowOffsetX: 2,
shadowOffsetY: 4,
stroke: '#F0F0F0',
lineWidth: 1,
},
},
});
graph.render();
```
#### 虚线边框样式
创建带虚线边框的节点:
```js | ob { inject: true }
import { Graph } from '@antv/g6';
const graph = new Graph({
container: 'container',
width: 200,
height: 100,
autoFit: 'center',
data: { nodes: [{ id: 'node1' }] },
node: {
style: {
fill: '#FFF1F0',
stroke: '#F5222D',
lineWidth: 2,
lineDash: [6, 4],
lineCap: 'round',
},
},
});
graph.render();
```
以下为完整的主图形样式配置:
| 属性 | 描述 | 类型 | 默认值 | 必选 |
| ------------------------------- | ----------------------------------------------------------------------------------------- | ----------------------------- | --------- | ---- |
| collapsed | 当前节点/组合是否折叠 | boolean | false | |
| cursor | 节点鼠标移入样式,[配置项](#cursor) | string | default | |
| fill | 节点填充色 | string | `#1783FF` | |
| fillOpacity | 节点填充色透明度 | number \| string | 1 | |
| increasedLineWidthForHitTesting | 当 lineWidth 较小时,可交互区域也随之变小,有时我们想增大这个区域,让"细线"更容易被拾取到 | number | 0 | |
| lineCap | 节点描边端点样式 | `round` \| `square` \| `butt` | `butt` | |
| lineDash | 节点描边虚线样式 | number[] | - | |
| lineDashOffset | 节点描边虚线偏移量 | number | - | |
| lineJoin | 节点描边连接处样式 | `round` \| `bevel` \| `miter` | `miter` | |
| lineWidth | 节点描边宽度 | number | 1 | |
| opacity | 节点透明度 | number \| string | 1 | |
| pointerEvents | 节点如何响应指针事件,[配置项](#pointerevents) | string | `auto` | |
| shadowBlur | 节点阴影模糊度 | number | - | |
| shadowColor | 节点阴影颜色 | string | - | |
| shadowOffsetX | 节点阴影在 x 轴方向上的偏移量 | number \| string | - | |
| shadowOffsetY | 节点阴影在 y 轴方向上的偏移量 | number \| string | - | |
| shadowType | 节点阴影类型 | `inner` \| `outer` | `outer` | |
| size | 节点大小,快捷设置节点宽高,[配置项](#size) | number \| number[] | 32 | |
| stroke | 节点描边色 | string | `#000` | |
| strokeOpacity | 节点描边色透明度 | number \| string | 1 | |
| transform | transform 属性允许你旋转、缩放、倾斜或平移给定节点 | string | - | |
| transformOrigin | 旋转与缩放中心,也称作变换中心 | string | - | |
| visibility | 节点是否可见 | `visible` \| `hidden` | `visible` | |
| x | 节点 x 坐标 | number | 0 | |
| y | 节点 y 坐标 | number | 0 | |
| z | 节点 z 坐标 | number | 0 | |
| zIndex | 节点渲染层级 | number | 0 | |
#### Size
节点大小,快捷设置节点宽高,支持三种配置方式:
- number:表示节点宽高相同为指定值
- [number, number]:表示节点宽高分别为数组元素依次表示节点的宽度、高度
- [number, number, number]:表示节点宽高分别为数组元素依次表示节点的宽度、高度以及深度
#### PointerEvents
`pointerEvents` 属性控制图形如何响应交互事件,可参考 [MDN 文档](https://developer.mozilla.org/en-US/docs/Web/CSS/pointer-events)。
可选值有:`visible` | `visiblepainted` | `visiblestroke` | `non-transparent-pixel` | `visiblefill` | `visible` | `painted` | `fill` | `stroke` | `all` | `none` | `auto` | `inherit` | `initial` | `unset`
简而言之,`fill`、`stroke` 和 `visibility` 都可以独立或组合影响拾取判定行为。目前支持以下关键词:
- **`auto`**:默认值,等同于 `visiblepainted`
- **`none`**:永远不会成为响应事件的目标
- **`visiblepainted`**:满足以下条件才会响应事件:
- `visibility` 设置为 `visible`,即图形为可见的
- 在图形填充区域触发同时 `fill` 取非 `none` 的值;或者在图形描边区域触发同时 `stroke` 取非 `none` 的值
- **`visiblefill`**:满足以下条件才会响应事件:
- `visibility` 设置为 `visible`,即图形为可见的
- 在图形填充区域触发,不受 `fill` 取值的影响
- **`visiblestroke`**:满足以下条件才会响应事件:
- `visibility` 设置为 `visible`,即图形为可见的
- 在图形描边区域触发,不受 `stroke` 取值的影响
- **`visible`**:满足以下条件才会响应事件:
- `visibility` 设置为 `visible`,即图形为可见的
- 在图形填充或者描边区域触发,不受 `fill` 和 `stroke` 取值的影响
- **`painted`**:满足以下条件才会响应事件:
- 在图形填充区域触发同时 `fill` 取非 `none` 的值;或者在图形描边区域触发同时 `stroke` 取非 `none` 的值
- 不受 `visibility` 取值的影响
- **`fill`**:满足以下条件才会响应事件:
- 在图形填充区域触发,不受 `fill` 取值的影响
- 不受 `visibility` 取值的影响
- **`stroke`**:满足以下条件才会响应事件:
- 在图形描边区域触发,不受 `stroke` 取值的影响
- 不受 `visibility` 取值的影响
- **`all`**:只要进入图形的填充和描边区域就会响应事件,不会受 `fill`、`stroke`、`visibility` 的取值影响
**使用示例:**
```js
// 示例1:只有描边区域响应事件
const graph = new Graph({
node: {
style: {
fill: 'none',
stroke: '#000',
lineWidth: 2,
pointerEvents: 'stroke', // 只有描边响应事件
},
},
});
// 示例2:完全不响应事件
const graph = new Graph({
node: {
style: {
pointerEvents: 'none', // 节点不响应任何事件
},
},
});
```
#### Cursor
可选值有:`auto` | `default` | `none` | `context-menu` | `help` | `pointer` | `progress` | `wait` | `cell` | `crosshair` | `text` | `vertical-text` | `alias` | `copy` | `move` | `no-drop` | `not-allowed` | `grab` | `grabbing` | `all-scroll` | `col-resize` | `row-resize` | `n-resize` | `e-resize` | `s-resize` | `w-resize` | `ne-resize` | `nw-resize` | `se-resize` | `sw-resize` | `ew-resize` | `ns-resize` | `nesw-resize` | `nwse-resize` | `zoom-in` | `zoom-out`
### 标签样式
标签用于显示节点的文本信息,支持多种样式配置和布局方式。以下是常见的使用场景:
#### 基础文本标签
最简单的文本标签配置:
```js | ob { inject: true }
import { Graph } from '@antv/g6';
const graph = new Graph({
container: 'container',
width: 200,
height: 120,
autoFit: 'center',
data: { nodes: [{ id: 'node1' }] },
node: {
style: {
labelText: '节点名称',
labelFill: '#262626',
labelFontSize: 12,
labelPlacement: 'bottom',
},
},
});
graph.render();
```
#### 多行文本标签
当文本较长时,可以设置自动换行:
```js | ob { inject: true }
import { Graph } from '@antv/g6';
const graph = new Graph({
container: 'container',
width: 200,
height: 120,
autoFit: 'center',
data: { nodes: [{ id: 'node1' }] },
node: {
style: {
labelText: '这是一个很长的节点名称需要换行显示',
labelWordWrap: true,
labelMaxWidth: '150%',
labelMaxLines: 3,
labelTextOverflow: 'ellipsis',
labelFill: '#434343',
labelPlacement: 'bottom',
labelTextAlign: 'center',
},
},
});
graph.render();
```
#### 带背景的标签
为标签添加背景,提高可读性:
```js | ob { inject: true }
import { Graph } from '@antv/g6';
const graph = new Graph({
container: 'container',
width: 200,
height: 120,
autoFit: 'center',
data: { nodes: [{ id: 'node1' }] },
node: {
style: {
labelText: '重要节点',
labelBackground: true,
labelBackgroundFill: 'rgba(250, 140, 22, 0.1)',
labelBackgroundRadius: 6,
labelPadding: [6, 12],
labelFill: '#D4380D',
labelFontWeight: 'bold',
labelPlacement: 'bottom',
},
},
});
graph.render();
```
以下为完整的标签样式配置:
| 属性 | 描述 | 类型 | 默认值 | 必选 |
| ------------------------ | ---------------------------------------------------------------------------------- | --------------------------------------------------------------------------- | --------- | ---- |
| label | 是否显示节点标签 | boolean | true | |
| labelCursor | 鼠标移入节点标签时显示的样式,[配置项](#cursor) | string | `default` | |
| labelFill | 节点标签文字颜色 | string | - | |
| labelFontFamily | 节点标签字体族 | string | - | |
| labelFontSize | 节点标签字体大小 | number | 12 | |
| labelFontStyle | 节点标签字体样式 | `normal` \| `italic` \| `oblique` | - | |
| labelFontVariant | 节点标签字体变种 | `normal` \| `small-caps` \| string | - | |
| labelFontWeight | 节点标签字体粗细 | `normal` \| `bold` \| `bolder` \| `lighter` \| number | - | |
| labelLeading | 行间距 | number | 0 | |
| labelLetterSpacing | 节点标签字间距 | number \| string | - | |
| labelLineHeight | 节点标签行高 | number \| string | - | |
| labelMaxLines | 节点标签最大行数 | number | 1 | |
| labelMaxWidth | 节点标签最大宽度,[配置项](#labelmaxwidth) | number \| string | `200%` | |
| labelOffsetX | 节点标签在 x 轴方向上的偏移量 | number | 0 | |
| labelOffsetY | 节点标签在 y 轴方向上的偏移量 | number | 0 | |
| labelPadding | 节点标签内边距 | number \| number[] | 0 | |
| labelPlacement | 节点标签相对于节点主图形的位置,[配置项](#labelplacement) | string | `bottom` | |
| labelText | 节点标签文字内容 | `string` \| `(datum) => string` | - | |
| labelTextAlign | 节点标签文本水平对齐方式 | `start` \| `center` \| `middle` \| `end` \| `left` \| `right` | `left` | |
| labelTextBaseline | 节点标签文本基线 | `top` \| `hanging` \| `middle` \| `alphabetic` \| `ideographic` \| `bottom` | - | |
| labelTextDecorationColor | 节点标签文本装饰线颜色 | string | - | |
| labelTextDecorationLine | 节点标签文本装饰线 | string | - | |
| labelTextDecorationStyle | 节点标签文本装饰线样式 | `solid` \| `double` \| `dotted` \| `dashed` \| `wavy` | - | |
| labelTextOverflow | 节点标签文本溢出处理方式 | `clip` \| `ellipsis` \| string | - | |
| labelTextPath | 节点标签文本路径 | Path | - | |
| labelWordWrap | 节点标签是否开启自动折行。开启 labelWordWrap 后,超出 labelMaxWidth 的部分自动换行 | boolean | false | |
| labelZIndex | 节点标签渲染层级 | number | 0 | |
#### LabelPlacement
可选值有:`left` | `right` | `top` | `bottom` | `left-top` | `left-bottom` | `right-top` | `right-bottom` | `top-left` | `top-right` | `bottom-left` | `bottom-right` | `center` | `bottom`
#### LabelMaxWidth
开启自动折行 `labelWordWrap` 后,超出该宽度则换行:
- string: 表示以相对于节点宽度的百分比形式定义最大宽度。例如 `50%` 表示标签宽度不超过节点宽度的一半
- number: 表示以像素值为单位定义最大宽度。例如 100 表示标签的最大宽度为 100 像素
比如,设置多行标签文字:
```json
{
"labelWordWrap": true,
"labelMaxWidth": 200,
"labelMaxLines": 3
}
```
### 标签背景样式
标签背景用于显示节点标签的背景:
| 属性 | 描述 | 类型 | 默认值 |
| ----------------------------- | -------------------------------------------------------------------------------------------------------------- | ---------------------------------------- | --------- |
| labelBackground | 节点标签背景是否显示 | boolean | false |
| labelBackgroundCursor | 节点标签背景鼠标移入样式,[配置项](#cursor) | string | `default` |
| labelBackgroundFill | 节点标签背景填充色 | string | - |
| labelBackgroundFillOpacity | 节点标签背景透明度 | number | 1 |
| labelBackgroundHeight | 节点标签背景高度 | string \| number | - |
| labelBackgroundLineDash | 节点标签背景虚线配置 | number \| string \|(number \| string )[] | - |
| labelBackgroundLineDashOffset | 节点标签背景虚线偏移量 | number | - |
| labelBackgroundLineWidth | 节点标签背景描边线宽 | number | - |
| labelBackgroundRadius | 节点标签背景圆角半径 <br> - number: 统一设置四个圆角半径 <br> - number[]: 分别设置四个圆角半径,不足则自动补充 | number \| number[] | 0 |
| labelBackgroundShadowBlur | 节点标签背景阴影模糊程度 | number | - |
| labelBackgroundShadowColor | 节点标签背景阴影颜色 | string | - |
| labelBackgroundShadowOffsetX | 节点标签背景阴影 X 方向偏移 | number | - |
| labelBackgroundShadowOffsetY | 节点标签背景阴影 Y 方向偏移 | number | - |
| labelBackgroundStroke | 节点标签背景描边颜色 | string | - |
| labelBackgroundStrokeOpacity | 节点标签背景描边透明度 | number \| string | 1 |
| labelBackgroundVisibility | 节点标签背景是否可见 | `visible` \| `hidden` | - |
| labelBackgroundZIndex | 节点标签背景渲染层级 | number | 1 |
### 光晕样式
光晕是围绕节点主图形显示的效果,通常用于高亮显示或表示节点的特殊状态。
#### 基础光晕效果
为节点添加基本的光晕效果:
```js | ob { inject: true }
import { Graph } from '@antv/g6';
const graph = new Graph({
container: 'container',
width: 200,
height: 100,
autoFit: 'center',
data: { nodes: [{ id: 'node1' }] },
node: {
style: {
lineWidth: 1.5,
halo: true,
haloStroke: '#1890FF',
haloLineWidth: 6,
haloStrokeOpacity: 0.3,
},
},
});
graph.render();
```
以下为完整的光晕样式配置:
| 属性 | 描述 | 类型 | 默认值 | 必选 |
| ----------------- | ---------------------------------------------------------------------- | ---------------------- | ---------------------------- | ---- |
| halo | 节点光晕是否显示 | boolean | false | |
| haloCursor | 节点光晕鼠标移入样式,[配置项](#cursor) | strig | `default` | |
| haloDraggable | 节点光晕是否允许拖拽 | boolean | true | |
| haloDroppable | 节点光晕是否允许接收被拖拽的元素 | boolean | true | |
| haloFillRule | 节点光晕填充规则 | `nonzero` \| `evenodd` | - | |
| haloFilter | 节点光晕滤镜 | string | - | |
| haloLineWidth | 节点光晕描边宽度 | number | 3 | |
| haloPointerEvents | 节点光晕效果是否响应指针事件,[配置项](#pointerevents) | string | `none` | |
| haloStroke | 节点光晕描边色,**此属性用于设置节点周围光晕的颜色,帮助突出显示节点** | string | 与主图形的填充色 `fill` 一致 | |
| haloStrokeOpacity | 节点光晕描边色透明度 | number | 0.25 | |
| haloVisibility | 节点光晕可见性 | `visible` \| `hidden` | `visible` | |
| haloZIndex | 节点光晕渲染层级 | number | -1 | |
### 图标样式
节点图标支持三种常见的使用方式:文字图标、图片图标和 IconFont 图标。下面分别展示这三种方式的配置:
#### 1. 文字图标
直接使用文字作为图标,适合简单的标识:
```js | ob { inject: true }
import { Graph } from '@antv/g6';
const graph = new Graph({
container: 'container',
width: 200,
height: 100,
autoFit: 'center',
data: { nodes: [{ id: 'node1' }] },
node: {
style: {
fill: '#FFF0F6',
stroke: '#EB2F96',
lineWidth: 1.5,
iconText: 'A', // 图标文字内容
iconFill: '#C41D7F', // 深粉色图标
iconFontSize: 16,
iconFontWeight: 'bold',
},
},
});
graph.render();
```
#### 2. 图片图标
使用图片作为图标,支持各种图片格式:
```js | ob { inject: true }
import { Graph } from '@antv/g6';
const graph = new Graph({
container: 'container',
width: 200,
height: 100,
autoFit: 'center',
data: { nodes: [{ id: 'node1' }] },
node: {
style: {
fill: '#F6FFED',
stroke: '#52C41A',
lineWidth: 1.5,
iconSrc:
'data:image/svg+xml;base64,PHN2ZyB3aWR0aD0iMjQiIGhlaWdodD0iMjQiIHZpZXdCb3g9IjAgMCAyNCAyNCIgZmlsbD0ibm9uZSIgeG1sbnM9Imh0dHA6Ly93d3cudzMub3JnLzIwMDAvc3ZnIj4KPHBhdGggZD0iTTEyIDJMMTMuMDkgOC4yNkwyMSA5TDEzLjA5IDE1Ljc4TDEyIDIyTDEwLjkxIDE1Ljc4TDMgOUwxMC45MSA4LjI2TDEyIDJaIiBmaWxsPSIjNTJDNDFBIi8+Cjwvc3ZnPgo=',
iconWidth: 20,
iconHeight: 20,
},
},
});
graph.render();
```
#### 3. IconFont 图标
使用 IconFont 字体图标,需要先引入相应的字体文件:
```js | ob { inject: true }
import { Graph, iconfont } from '@antv/g6';
const style = document.createElement('style');
style.innerHTML = `@import url('${iconfont.css}');`;
document.head.appendChild(style);
const graph = new Graph({
container: 'container',
width: 200,
height: 100,
autoFit: 'center',
data: { nodes: [{ id: 'node1' }] },
node: {
style: {
fill: '#E6F7FF', // 淡蓝色背景
stroke: '#1890FF', // 蓝色边框
lineWidth: 1.5,
iconFontFamily: 'iconfont',
iconText: '\ue602',
iconFill: '#1890FF',
},
},
});
graph.render();
```
以下为完整的图标样式配置:
| 属性 | 描述 | 类型 | 默认值 |
| ----------------------- | ----------------------------------- | --------------------------------------------------------------------------- | ---------------- |
| icon | 是否显示节点图标 | boolean | true |
| iconFill | 节点图标文字颜色 | string | - |
| iconFontFamily | 节点图标字体族 | string | - |
| iconFontSize | 节点图标字体大小 | number | 16 |
| iconFontStyle | 节点图标字体样式 | `normal` \| `italic` \| `oblique` | `normal` |
| iconFontVariant | 节点图标字体变种 | `normal` \| `small-caps` \| string | `normal` |
| iconFontWeight | 节点图标字体粗细 | number \| string | `normal` |
| iconHeight | 节点图标高度 | number | 主图形高度的一半 |
| iconLetterSpacing | 节点图标文本字间距 | number \| string | - |
| iconLineHeight | 节点图标文本行高 | number \| string | - |
| iconMaxLines | 节点图标文本最大行数 | number | 1 |
| iconRadius | 节点图标圆角半径 | number | 0 |
| iconSrc | 节点图片来源。其优先级高于 iconText | string \| ((datum) => string) | - |
| iconText | 节点图标文字 | string \| ((datum) => string) | - |
| iconTextAlign | 节点图标文本水平对齐方式 | `start` \| `center` \| `middle` \| `end` \| `left` \| `right` | `left` |
| iconTextBaseline | 节点图标文本基线 | `top` \| `hanging` \| `middle` \| `alphabetic` \| `ideographic` \| `bottom` | `alphabetic` |
| iconTextDecorationColor | 节点图标文本装饰线颜色 | string | - |
| iconTextDecorationLine | 节点图标文本装饰线 | string | - |
| iconTextDecorationStyle | 节点图标文本装饰线样式 | `solid` \| `double` \| `dotted` \| `dashed` \| `wavy` | `solid` |
| iconTextOverflow | 节点图标文本溢出处理方式 | `clip` \| `ellipsis` \| string | `clip` |
| iconWidth | 节点图标宽度 | number | 主图形宽度的一半 |
| iconWordWrap | 节点图标文本是否自动换行 | boolean | - |
### 徽标样式
徽标是节点上显示的小标记,通常用于展示状态、数量或其他辅助信息。支持多个徽标同时显示,并可自定义位置。
#### 单个徽标
为节点添加一个简单的徽标:
```js | ob { inject: true }
import { Graph } from '@antv/g6';
const graph = new Graph({
container: 'container',
width: 200,
height: 100,
autoFit: 'center',
data: { nodes: [{ id: 'node1' }] },
node: {
style: {
badges: [
{ text: 'NEW' }, // 默认显示在上方
],
},
},
});
graph.render();
```
#### 多个徽标
为节点添加多个不同位置的徽标:
```js | ob { inject: true }
import { Graph } from '@antv/g6';
const graph = new Graph({
container: 'container',
width: 200,
height: 100,
autoFit: 'center',
data: { nodes: [{ id: 'node1' }] },
node: {
style: {
badge: true, // 是否显示徽标
badges: [
{ text: 'A', placement: 'right-top' },
{ text: 'Important', placement: 'right' },
{ text: 'Notice', placement: 'right-bottom' },
],
badgePalette: ['#7E92B5', '#F4664A', '#FFBE3A'], // 徽标的背景色板
badgeFontSize: 7, // 徽标字体大小
},
},
});
graph.render();
```
#### 自定义徽标样式
完全自定义徽标的外观:
```js | ob { inject: true }
import { Graph } from '@antv/g6';
const graph = new Graph({
container: 'container',
width: 200,
height: 100,
autoFit: 'center',
data: { nodes: [{ id: 'node1' }] },
node: {
style: {
badges: [
{
text: '99+',
placement: 'right-top',
backgroundFill: '#FF4D4F', // 红色背景
fill: '#fff', // 白色文字
fontSize: 10,
padding: [2, 6],
backgroundRadius: 8,
},
],
},
},
});
graph.render();
```
以下为完整的徽标样式配置:
| 属性 | 描述 | 类型 | 默认值 |
| ------------ | ------------------ | ------------------------------------- | --------------------------------- |
| badge | 节点是否显示徽标 | boolean | true |
| badgePalette | 节点徽标的背景色板 | string[] | [`#7E92B5`, `#F4664A`, `#FFBE3A`] |
| badges | 节点徽标设置 | [BadgeStyleProps](#badgestyleprops)[] | - |
#### BadgeStyleProps
| 属性 | 描述 | 类型 | 默认值 |
| ------------------------ | --------------------------------------------------------------------------------------------------------------------------------------------------------------------------------------------------------------------------------- | ---------------------------------------------------------------------------------------------------------------------------------------------------------------------- | ------------ |
| background | 节点徽标是否显示背景 | boolean | true |
| backgroundCursor | 节点徽标背景鼠标移入样式,[配置项](#cursor) | string | `default` |
| backgroundFill | 节点徽标背景填充色。若不指定,优先考虑 badgePalette 按顺序分配 | string | - |
| backgroundFillOpacity | 节点徽标背景填充透明度 | number | 1 |
| backgroundFilter | 节点徽标背景滤镜 | string | - |
| backgroundHeight | 节点徽标背景高度 | number \| string | - |
| backgroundLineDash | 节点徽标背景虚线配置 | number \| string \|(number \| string )[] | - |
| backgroundLineDashOffset | 节点徽标背景虚线偏移量 | number | - |
| backgroundLineWidth | 节点徽标背景描边线宽 | number | - |
| backgroundRadius | 节点徽标背景圆角半径 <br> - number: 统一设置四个圆角半径 <br> - number[]: 分别设置四个圆角半径,会补足缺省的分量 <br> - string: 与 [CSS padding](https://developer.mozilla.org/zh-CN/docs/Web/CSS/padding) 属性类似,使用空格分隔 | number \| number[] \| string | 0 |
| backgroundShadowBlur | 节点徽标背景阴影模糊程度 | number | - |
| backgroundShadowColor | 节点徽标背景阴影颜色 | string | - |
| backgroundShadowOffsetX | 节点徽标背景阴影 X 方向偏移 | number | - |
| backgroundShadowOffsetY | 节点徽标背景阴影 Y 方向偏移 | number | - |
| backgroundStroke | 节点徽标背景描边颜色 | string | - |
| backgroundStrokeOpacity | 节点徽标背景描边透明度 | number \| string | 1 |
| backgroundVisibility | 节点徽标背景是否可见 | `visible` \| `hidden` | - |
| backgroundZIndex | 节点徽标背景渲染层级 | number | - |
| fill | 节点徽标文字颜色 | string | - |
| fontFamily | 节点徽标字体族 | string | - |
| fontSize | 节点徽标字体大小 | number | 8 |
| fontStyle | 节点徽标字体样式 | `normal` \| `italic` \| `oblique` | `normal` |
| fontVariant | 节点徽标字体变种 | `normal` \| `small-caps` \| string | `normal` |
| fontWeight | 节点徽标字体粗细 | number \| string | `normal` |
| lineHeight | 节点徽标行高 | string \| number | - |
| lineWidth | 节点徽标行宽 | string \| number | - |
| maxLines | 节点徽标文本最大行数 | number | 1 |
| offsetX | 节点徽标在 x 轴方向上的偏移量 | number | 0 |
| offsetY | 节点徽标在 y 轴方向上的偏移量 | number | 0 |
| padding | 节点徽标内边距 | number \| number[] | 0 |
| placement | 节点徽标相对于节点主图形的位置。若不指定,默认从右上角顺时针依次排放 | `left` \| `right` \| `top` \| `bottom` \| `left-top` \| `left-bottom` \| `right-top` \| `right-bottom` \| `top-left` \| `top-right` \| `bottom-left` \| `bottom-right` | - |
| text | 节点徽标文字内容 | string | - |
| textAlign | 节点徽标文本水平对齐方式 | `start` \| `center` \| `middle` \| `end` \| `left` \| `right` | `left` |
| textBaseline | 节点徽标文本基线 | `top` \| `hanging` \| `middle` \| `alphabetic` \| `ideographic` \| `bottom` | `alphabetic` |
| textDecorationColor | 节点徽标文本装饰线颜色 | string | - |
| textDecorationLine | 节点徽标文本装饰线 | string | - |
| textDecorationStyle | 节点徽标文本装饰线样式 | `solid` \| `double` \| `dotted` \| `dashed` \| `wavy` | `solid` |
| textOverflow | 节点徽标文本溢出处理方式 | `clip` \| `ellipsis` \| string | `clip` |
| visibility | 节点徽标是否可见 | `visible` \| `hidden` | - |
| wordWrap | 节点徽标文本是否自动换行 | boolean | - |
| zIndex | 节点徽标渲染层级 | number | 3 |
### 连接桩样式
连接桩是节点上的连接点,用于连接边。支持在节点的不同位置添加多个连接桩,并可自定义样式。
#### 基础连接桩
为节点添加四个基本方向的连接桩:
```js | ob { inject: true }
import { Graph } from '@antv/g6';
const graph = new Graph({
container: 'container',
width: 200,
height: 100,
autoFit: 'center',
data: { nodes: [{ id: 'node1' }] },
node: {
style: {
port: true,
ports: [
{ key: 'top', placement: 'top', fill: '#7E92B5' },
{ key: 'right', placement: 'right', fill: '#F4664A' },
{ key: 'bottom', placement: 'bottom', fill: '#FFBE3A' },
{ key: 'left', placement: 'left', fill: '#D580FF' },
],
portR: 3,
portLineWidth: 1,
portStroke: '#fff',
},
},
});
graph.render();
```
#### 自定义位置连接桩
使用百分比或绝对坐标精确定位连接桩:
```js | ob { inject: true }
import { Graph } from '@antv/g6';
const graph = new Graph({
container: 'container',
width: 200,
height: 100,
autoFit: 'center',
data: { nodes: [{ id: 'node1' }] },
node: {
style: {
ports: [
{ key: 'custom1', placement: [0.2, 0] }, // 相对位置:左上角20%处
{ key: 'custom2', placement: [0.8, 0] }, // 相对位置:右上角80%处
{ key: 'custom3', placement: [1, 0.5] }, // 相对位置:右边中央
],
portR: 4,
portLineWidth: 1,
portStroke: '#fff',
},
},
});
graph.render();
```
#### 差异化连接桩样式
为不同的连接桩设置不同的样式:
```js | ob { inject: true }
import { Graph } from '@antv/g6';
const graph = new Graph({
container: 'container',
width: 200,
height: 100,
autoFit: 'center',
data: { nodes: [{ id: 'node1' }] },
node: {
style: {
ports: [
{
key: 'input',
placement: 'left',
fill: '#52C41A', // 绿色输入桩
r: 4,
},
{
key: 'output',
placement: 'right',
fill: '#FF4D4F', // 红色输出桩
r: 4,
},
],
portStroke: '#fff', // 统一的描边颜色
portLineWidth: 2,
},
},
});
graph.render();
```
以下为完整的连接桩样式配置:
| 属性 | 描述 | 类型 | 默认值 | 必选 |
| ----- | ------------------------------------ | ----------------------------------- | ------ | ---- |
| port | 节点是否显示连接桩 | boolean | true | |
| ports | 节点连接桩配置项,支持配置多个连接桩 | [PortStyleProps](#portstyleprops)[] | | |
#### PortStyleProps
| 属性 | 描述 | 类型 | 默认值 | 必选 |
| ----------------- | ---------------------------------------------------------------------------------------------------------------------------------------------------------------------------------- | ------------------------------------------------------------------------------------------------------------------------------------------------------------------------------------------------------ | --------- | ---- |
| key | 节点连接桩的键值,默认为节点连接桩的索引 | string | - | |
| placement | 节点连接桩相对于节点主图形的位置 | `left` \| `right` \| `top` \| `bottom` \| `center` \| `left-top` \| `left-bottom` \| `right-top` \| `right-bottom` \| `top-left` \| `top-right` \| `bottom-left` \| `bottom-right` \| [number, number] | - | ✓ |
| r | 节点连接桩半径 <br> - 如果设置为 undefined,则连接桩被视为一个点,不在画布上显示但存在,边会优先连接到最近的连接桩 <br> - 如果设置为数字,则连接桩被视为一个圆,圆的半径由此处指定 | number | - | |
| linkToCenter | 边是否连接到节点连接桩的中心 <br> - 若为 true,则边连接到节点连接桩的中心 <br> - 若为 false,则边连接到节点连接桩的边缘 | boolean | false | |
| cursor | 节点连接桩鼠标移入样式,[配置项](#cursor) | string | `default` | |
| fill | 节点连接桩填充颜色 | string | - | |
| fillOpacity | 节点连接桩填充透明度 | number | 1 | |
| isBillboard | 节点连接桩是否为Billboard 效果 | boolean | - | |
| isSizeAttenuation | 节点连接桩是否启用大小衰减 | boolean | - | |
| lineDash | 节点连接桩描边虚线配置 | number \| string \|(number \| string )[] | - | |
| lineDashOffset | 节点连接桩描边虚线偏移量 | number | - | |
| lineWidth | 节点连接桩描边线宽 | number | - | |
| shadowBlur | 节点连接桩阴影模糊程度 | number | - | |
| shadowColor | 节点连接桩阴影颜色 | string | - | |
| shadowOffsetX | 节点连接桩阴影 X 方向偏移 | number | - | |
| shadowOffsetY | 节点连接桩阴影 Y 方向偏移 | number | - | |
| stroke | 节点连接桩描边颜色 | string | - | |
| strokeOpacity | 节点连接桩描边透明度 | number \| string | 1 | |
| visibility | 节点连接桩是否可见 | `visible` \| `hidden` | `visible` | |
| zIndex | 节点连接桩渲染层级 | number | 2 | |
## State
在一些交互行为中,比如点击选中一个节点或鼠标悬停激活一个边,仅仅是在该元素做了某些状态的标识。为了将这些状态反应到终端用户所见的视觉空间中,我们需要为不同的状态设置不同的图元素样式,以响应该图元素状态的变化。
G6 提供了几种内置的状态,包括选中(selected)、高亮(highlight)、激活(active)、不活跃(inactive)和禁用(disabled)。此外,它还支持自定义状态,以满足更特定的需求。对于每个状态,开发者可以定义一套样式规则,这些规则会覆盖元素的默认样式。
<img width="520" src="https://mdn.alipayobjects.com/huamei_qa8qxu/afts/img/A*t2qvRp92itkAAAAAAAAAAAAADmJ7AQ/original" />
数据结构如下:
```typescript
type NodeState = {
[state: string]: NodeStyle;
};
```
例如,当节点处于 `focus` 状态时,可以为其添加一个宽度为 3 且颜色为橙色的描边。
```js {4-7}
const graph = new Graph({
node: {
state: {
focus: {
lineWidth: 3, // 描边宽度
stroke: 'orange', // 描边颜色
},
},
},
});
```
效果如下图所示:
```js | ob { pin: false, inject: true }
import { Graph } from '@antv/g6';
const graph = new Graph({
container: 'container',
width: 200,
height: 100,
autoFit: 'center',
data: {
nodes: [{ id: 'node1', states: ['focus'] }],
},
node: {
state: {
focus: {
lineWidth: 3,
stroke: 'orange',
},
},
},
});
graph.render();
```
## Animation
定义节点的动画效果,支持下列两种配置方式:
1. 关闭节点全部动画
```json
{
"node": {
"animation": false
}
}
```
2. 配置阶段动画
阶段动画是指节点在进入画布、更新、离开画布时的动画效果。目前支持的阶段包括:
- `enter`: 节点进入画布时的动画
- `update`: 节点更新时的动画
- `exit`: 节点离开画布时的动画
- `show`: 节点从隐藏状态显示时的动画
- `hide`: 节点隐藏时的动画
- `collapse`: 节点收起时的动画
- `expand`: 节点展开时的动画
你可以参考 [动画范式](/manual/animation/animation#动画范式) 使用动画语法来配置节点,如:
```json
{
"node": {
"animation": {
"update": [
{
"fields": ["x", "y"], // 更新时只对 x 和 y 属性进行动画
"duration": 1000, // 动画持续时间
"easing": "linear" // 缓动函数
}
],
}
}
```
也可以使用内置的动画效果:
```json
{
"node": {
"animation": {
"enter": "fade", // 使用渐变动画
"update": "translate", // 使用平移动画
"exit": "fade" // 使用渐变动画
}
}
}
```
你可以传入 false 来关闭特定阶段的动画:
```json
{
"node": {
"animation": {
"enter": false // 关闭节点入场动画
}
}
}
```
## Palette
定义节点的色板,即预定义节点颜色池,并根据规则进行分配,将颜色映射到 `fill` 属性。
> 有关色板的定义,请参考 [色板](/manual/theme/palette)。
| 属性 | 描述 | 类型 | 默认值 |
| ------ | ------------------------------------------------------------------- | ----------------------------- | ------- |
| color | 色板颜色。如果色板注册过,可以直接指定其注册名,也接受一个颜色数组 | string \| string[] | - |
| field | 指定元素数据中的分组字段。若不指定,默认取 id 作为分组字段 | string \| ((datum) => string) | `id` |
| invert | 是否反转色板 | boolean | false |
| type | 指定当前色板类型。<br> - `group`: 离散色板 <br> - `value`: 连续色板 | `group` \| `value` | `group` |
如将一组数据按 `category` 字段分配节点颜色,使得同类别的节点颜色相同:
```json
{
"node": {
"palette": {
"type": "group",
"field": "category",
"color": ["#1783FF", "#F08F56", "#D580FF", "#00C9C9", "#7863FF"]
}
}
}
```
效果如下图所示:
```js | ob { pin: false, inject: true }
import { Graph } from '@antv/g6';
const graph = new Graph({
container: 'container',
width: 600,
height: 100,
data: {
nodes: new Array(10)
.fill(0)
.map((_, i) => ({ id: `node-${i}`, data: { category: ['A', 'B', 'C', 'D', 'E'][i % 5] } })),
},
layout: { type: 'grid', cols: 10 },
node: {
palette: {
type: 'group',
field: 'category',
color: ['#1783FF', '#F08F56', '#D580FF', '#00C9C9', '#7863FF'],
},
},
});
graph.render();
```
也可以使用默认配置:
```json
{
"node": {
"palette": "tableau" // tableau 为色板名,默认根据 ID 分配颜色
}
}
```
效果如下图所示:
```js | ob { pin: false, inject: true }
import { Graph } from '@antv/g6';
const graph = new Graph({
container: 'container',
width: 600,
height: 100,
data: {
nodes: new Array(10)
.fill(0)
.map((_, i) => ({ id: `node-${i}`, data: { category: ['A', 'B', 'C', 'D', 'E'][i % 5] } })),
},
layout: { type: 'grid', cols: 10 },
node: {
palette: 'tableau',
},
});
graph.render();
```
Node Skill
packages/site/docs/manual/element/node/Circle.en.md anthropic-skill ~576 tokens---
title: Circle Node
order: 2
---
## Overview
A circle is a symmetrical geometric shape with a uniform radius.
Applicable scenarios:
- Used to represent the size or weight of a node (controlled by radius).
- Suitable for representing non-directional relationships, such as user nodes in social networks.
- Commonly used in flowcharts, network diagrams, topology diagrams, etc.
## Online Experience
<embed src="@/common/api/elements/nodes/circle.md"></embed>
## Style Configuration
> If the element has specific attributes, we will list them below. For all general style attributes, see [BaseNode](/en/manual/element/node/base-node))
## Example
### Built-in Circle Node Effect
```js | ob { inject: true }
import { Graph, iconfont } from '@antv/g6';
const style = document.createElement('style');
style.innerHTML = `@import url('${iconfont.css}');`;
document.head.appendChild(style);
const data = {
nodes: [
{ id: 'default' },
{ id: 'halo' },
{ id: 'badges' },
{ id: 'ports' },
{
id: 'active',
states: ['active'],
},
{
id: 'selected',
states: ['selected'],
},
{
id: 'highlight',
states: ['highlight'],
},
{
id: 'inactive',
states: ['inactive'],
},
{
id: 'disabled',
states: ['disabled'],
},
],
};
const graph = new Graph({
container: 'container',
data,
node: {
type: 'circle',
style: {
size: 40,
labelText: (d) => d.id,
iconFontFamily: 'iconfont',
iconText: '\ue602',
halo: (d) => (d.id === 'halo' ? true : false),
badges: (d) =>
d.id === 'badges'
? [
{
text: 'A',
placement: 'right-top',
},
{
text: 'Important',
placement: 'right',
},
{
text: 'Notice',
placement: 'right-bottom',
},
]
: [],
badgeFontSize: 8,
badgePadding: [1, 4],
portR: 3,
ports: (d) =>
d.id === 'ports'
? [{ placement: 'left' }, { placement: 'right' }, { placement: 'top' }, { placement: 'bottom' }]
: [],
},
},
layout: {
type: 'grid',
},
});
graph.render();
```
Node Skill
packages/site/docs/manual/element/node/Circle.zh.md anthropic-skill ~485 tokens---
title: 圆形节点 Circle
order: 2
---
## 概述
圆形是一个对称的几何形状,具有均匀的半径。
适用场景:
- 用于表示节点的大小或权重(通过半径控制)。
- 适合表示无方向性的关系,如社交网络中的用户节点。
- 常用于流程图、网络图、拓扑图等。
## 在线体验
<embed src="@/common/api/elements/nodes/circle.md"></embed>
## 样式配置
> 如果元素有其特定的属性,我们将在下面列出。对于所有的通用样式属性,见[BaseNode](/manual/element/node/base-node)
## 示例
### 内置圆形节点效果
```js | ob { inject: true }
import { Graph, iconfont } from '@antv/g6';
const style = document.createElement('style');
style.innerHTML = `@import url('${iconfont.css}');`;
document.head.appendChild(style);
const data = {
nodes: [
{ id: 'default' },
{ id: 'halo' },
{ id: 'badges' },
{ id: 'ports' },
{
id: 'active',
states: ['active'],
},
{
id: 'selected',
states: ['selected'],
},
{
id: 'highlight',
states: ['highlight'],
},
{
id: 'inactive',
states: ['inactive'],
},
{
id: 'disabled',
states: ['disabled'],
},
],
};
const graph = new Graph({
container: 'container',
data,
node: {
type: 'circle',
style: {
size: 40,
labelText: (d) => d.id,
iconFontFamily: 'iconfont',
iconText: '\ue602',
halo: (d) => (d.id === 'halo' ? true : false),
badges: (d) =>
d.id === 'badges'
? [
{
text: 'A',
placement: 'right-top',
},
{
text: 'Important',
placement: 'right',
},
{
text: 'Notice',
placement: 'right-bottom',
},
]
: [],
badgeFontSize: 8,
badgePadding: [1, 4],
portR: 3,
ports: (d) =>
d.id === 'ports'
? [{ placement: 'left' }, { placement: 'right' }, { placement: 'top' }, { placement: 'bottom' }]
: [],
},
},
layout: {
type: 'grid',
},
});
graph.render();
```
Node Skill
packages/site/docs/manual/element/node/custom-node.en.md anthropic-skill ~5,165 tokens---
title: Custom Node
order: 12
---
G6 provides a series of [built-in nodes](/en/manual/element/node/base-node), including [circle (Circle Node)](/en/manual/element/node/circle), [diamond (Diamond Node)](/en/manual/element/node/diamond), [donut (Donut Node)](/en/manual/element/node/donut), [ellipse (Ellipse Node)](/en/manual/element/node/ellipse), [hexagon (Hexagon Node)](/en/manual/element/node/hexagon), [html (HTML Node)](/en/manual/element/node/html), [image (Image Node)](/en/manual/element/node/image), [rect (Rectangle Node)](/en/manual/element/node/rect), [star (Star Node)](/en/manual/element/node/star), and [triangle (Triangle Node)](/en/manual/element/node/triangle). These built-in nodes can meet most basic scenario requirements.
However, in actual projects, you may encounter needs that these basic nodes cannot satisfy. In such cases, you need to create custom nodes. Don't worry, this is simpler than you might think!
## Ways to Create Custom Nodes <Badge type="warning">Choose the Right Approach</Badge>
There are mainly two approaches to creating custom nodes:
### 1. Inherit from Existing Node Types <Badge type="success">Recommended</Badge>
This is the most commonly used approach, where you can choose to inherit from one of the following types:
- [`BaseNode`](https://github.com/antvis/G6/blob/v5/packages/g6/src/elements/nodes/base-node.ts) - The most basic node class, providing core node functionality
- [`Circle`](https://github.com/antvis/G6/blob/v5/packages/g6/src/elements/nodes/circle.ts) - Circle node
- [`Rect`](https://github.com/antvis/G6/blob/v5/packages/g6/src/elements/nodes/rect.ts) - Rectangle node
- [`Ellipse`](https://github.com/antvis/G6/blob/v5/packages/g6/src/elements/nodes/ellipse.ts) - Ellipse node
- [`Diamond`](https://github.com/antvis/G6/blob/v5/packages/g6/src/elements/nodes/diamond.ts) - Diamond node
- [`Triangle`](https://github.com/antvis/G6/blob/v5/packages/g6/src/elements/nodes/triangle.ts) - Triangle node
- [`Star`](https://github.com/antvis/G6/blob/v5/packages/g6/src/elements/nodes/star.ts) - Star node
- [`Image`](https://github.com/antvis/G6/blob/v5/packages/g6/src/elements/nodes/image.ts) - Image node
- [`Donut`](https://github.com/antvis/G6/blob/v5/packages/g6/src/elements/nodes/donut.ts) - Donut node
- [`Hexagon`](https://github.com/antvis/G6/blob/v5/packages/g6/src/elements/nodes/hexagon.ts) - Hexagon node
**Why choose this approach?**
- 📌 **Less Code**: Reuse properties and methods of existing nodes, only focus on new features
- 📌 **Rapid Development**: Suitable for most project needs, quickly achieve business goals
- 📌 **Easy Maintenance**: Clear code structure with well-defined inheritance relationships
:::tip{title=Get Started Now}
If you choose to inherit from existing node types (recommended), you can jump directly to [Create Your First Custom Node in Three Steps](#create-your-first-custom-node-in-three-steps) to start practicing. Most users will choose this approach!
:::
### 2. Build from Scratch Based on G Graphics System <Badge>Advanced Usage</Badge>
If existing node types don't meet your requirements, you can create nodes from scratch based on G's underlying graphics system.
**Why choose this approach?**
- 📌 **Maximum Freedom**: Complete control over every detail of the node, achieving any complex effects
- 📌 **Special Requirements**: Highly customized scenarios that existing node types cannot satisfy
- 📌 **Performance Optimization**: Performance optimization for specific scenarios
:::warning{title=Important Notes}
Custom nodes built from scratch require handling all details yourself, including graphics rendering, event response, state changes, etc., with higher development difficulty. You can refer directly to the [source code](https://github.com/antvis/G6/blob/v5/packages/g6/src/elements/nodes/base-node.ts) for implementation.
:::
## Create Your First Custom Node in Three Steps
Let's start with a simple example - creating a **rectangle node with main and subtitle**:
```js | ob { pin:false, inject: true }
import { Graph, register, Rect, ExtensionCategory } from '@antv/g6';
// Step 1: Create custom node class
class DualLabelNode extends Rect {
// Subtitle style
getSubtitleStyle(attributes) {
return {
x: 0,
y: 45, // Place below the main title
text: attributes.subtitle || '',
fontSize: 12,
fill: '#666',
textAlign: 'center',
textBaseline: 'middle',
};
}
// Draw subtitle
drawSubtitleShape(attributes, container) {
const subtitleStyle = this.getSubtitleStyle(attributes);
this.upsert('subtitle', 'text', subtitleStyle, container);
}
// Render method
render(attributes = this.parsedAttributes, container) {
// 1. Render basic rectangle and main title
super.render(attributes, container);
// 2. Add subtitle
this.drawSubtitleShape(attributes, container);
}
}
// Step 2: Register custom node
register(ExtensionCategory.NODE, 'dual-label-node', DualLabelNode);
// Step 3: Use custom node
const graph = new Graph({
container: 'container',
height: 200,
data: {
nodes: [
{
id: 'node1',
style: { x: 100, y: 100 },
data: {
title: 'Node A', // Main title
subtitle: 'Your First Custom Node', // Subtitle
},
},
],
},
node: {
type: 'dual-label-node',
style: {
fill: '#7FFFD4',
stroke: '#5CACEE',
lineWidth: 2,
radius: 5,
// Main title style
labelText: (d) => d.data.title,
labelFill: '#222',
labelFontSize: 14,
labelFontWeight: 500,
// Subtitle
subtitle: (d) => d.data.subtitle,
},
},
});
graph.render();
```
### Step 1: Write Custom Node Class
Inherit from G6's `Rect` (rectangle node) and add a subtitle:
```js
import { Rect, register, Graph, ExtensionCategory } from '@antv/g6';
// Create custom node, inheriting from Rect
class DualLabelNode extends Rect {
// Subtitle style
getSubtitleStyle(attributes) {
return {
x: 0,
y: 45, // Place below the main title
text: attributes.subtitle || '',
fontSize: 12,
fill: '#666',
textAlign: 'center',
textBaseline: 'middle',
};
}
// Draw subtitle
drawSubtitleShape(attributes, container) {
const subtitleStyle = this.getSubtitleStyle(attributes);
this.upsert('subtitle', 'text', subtitleStyle, container);
}
// Render method
render(attributes = this.parsedAttributes, container) {
// 1. Render basic rectangle and main title
super.render(attributes, container);
// 2. Add subtitle
this.drawSubtitleShape(attributes, container);
}
}
```
### Step 2: Register Custom Node
Use the `register` method to register the node type so that G6 can recognize your custom node:
```js
register(ExtensionCategory.NODE, 'dual-label-node', DualLabelNode);
```
The `register` method requires three parameters:
- Extension category: `ExtensionCategory.NODE` indicates this is a node type
- Type name: `dual-label-node` is the name we give to this custom node, which will be used in configuration later
- Class definition: `DualLabelNode` is the node class we just created
### Step 3: Apply Custom Node
Use the custom node in graph configuration:
```js
const graph = new Graph({
data: {
nodes: [
{
id: 'node1',
style: { x: 100, y: 100 },
data: {
title: 'Node A', // Main title
subtitle: 'Your First Custom Node', // Subtitle
},
},
],
},
node: {
type: 'dual-label-node',
style: {
fill: '#7FFFD4',
stroke: '#5CACEE',
lineWidth: 2,
radius: 8,
// Main title style
labelText: (d) => d.data.title,
labelFill: '#222',
labelFontSize: 14,
labelFontWeight: 500,
// Subtitle
subtitle: (d) => d.data.subtitle,
},
},
});
graph.render();
```
🎉 Congratulations! You have created your first custom node. It looks simple, but this process contains the core concept of custom nodes: **inherit from a basic node type**, then **override the `render` method** to add custom content.
## Understanding Data Flow: How to Access Data in Custom Nodes
Before creating complex custom nodes, understanding how data flows into custom nodes is very important. G6 provides multiple ways to access data for custom nodes:
### Method 1: Through `attributes` Parameter (Recommended)
The first parameter `attributes` of the `render` method contains processed style attributes, including data-driven styles:
```js
class CustomNode extends Rect {
render(attributes, container) {
// attributes contains all style attributes, including data-driven styles
console.log('All properties of current node:', attributes);
// If customData: (d) => d.data.someValue is defined in style
// Then you can access it through attributes.customData
const customValue = attributes.customData;
super.render(attributes, container);
}
}
```
### Method 2: Through `this.context.graph` to Access Raw Data
When you need to access the node's raw data, you can get it through the graph instance:
```js
class CustomNode extends Rect {
// Convenient data access method
get nodeData() {
return this.context.graph.getNodeData(this.id);
}
get data() {
return this.nodeData.data || {};
}
render(attributes, container) {
// Get complete node data
const nodeData = this.nodeData;
console.log('Complete node data:', nodeData);
// Get business data from data field
const businessData = this.data;
console.log('Business data:', businessData);
super.render(attributes, container);
}
}
```
### Complete Data Flow Process
Let's understand how data flows from graph data to custom nodes through a specific example:
```js | ob { inject: true }
import { Graph, register, Rect, ExtensionCategory } from '@antv/g6';
class DataFlowNode extends Rect {
// Method 2: Get raw data through graph
get nodeData() {
return this.context.graph.getNodeData(this.id);
}
get data() {
return this.nodeData.data || {};
}
render(attributes, container) {
// Method 1: Get processed styles from attributes
console.log('Get from attributes:', {
iconUrl: attributes.iconUrl,
userName: attributes.userName,
});
// Method 2: Get from raw data
console.log('Get from raw data:', {
icon: this.data.icon,
name: this.data.name,
role: this.data.role,
});
// Render basic rectangle
super.render(attributes, container);
// Use data to render custom content
if (attributes.iconUrl) {
this.upsert(
'icon',
'image',
{
x: -25,
y: -12,
width: 20,
height: 20,
src: attributes.iconUrl,
},
container,
);
}
if (attributes.userName) {
this.upsert(
'username',
'text',
{
x: 10,
y: 0,
text: attributes.userName,
fontSize: 10,
fill: '#666',
textAlign: 'center',
textBaseline: 'middle',
},
container,
);
}
}
}
register(ExtensionCategory.NODE, 'data-flow-node', DataFlowNode);
const graph = new Graph({
container: 'container',
height: 200,
data: {
nodes: [
{
id: 'user1',
style: { x: 100, y: 100 },
// This is the node's business data
data: {
name: 'Zhang San',
role: 'Developer',
icon: 'https://api.dicebear.com/7.x/avataaars/svg?seed=Felix',
},
},
],
},
node: {
type: 'data-flow-node',
style: {
size: [80, 40],
fill: '#f0f9ff',
stroke: '#0ea5e9',
lineWidth: 1,
radius: 4,
// Map data from data field to style attributes
iconUrl: (d) => d.data.icon, // This becomes attributes.iconUrl
userName: (d) => d.data.name, // This becomes attributes.userName
// Main title uses role information
labelText: (d) => d.data.role,
labelFontSize: 12,
labelFill: '#0369a1',
},
},
});
graph.render();
```
:::tip{title=Data Flow Summary}
1. **Graph Data Definition**: Define business data in `data.nodes[].data`
2. **Style Mapping**: Use functions in `node.style` to map data to style attributes
3. **Node Access**: Access data in custom nodes through `attributes` or `this.context.graph`
4. **Rendering Usage**: Use the obtained data to render custom graphics
:::
## From Simple to Complex: Gradually Building Feature-Rich Nodes
Let's gradually increase the complexity and functionality of nodes through practical examples.
### Example 1: User Card Node with Icon and Badge
This example shows how to create a user card node containing avatar, name, and status badge:
```js | ob { inject: true }
import { Graph, register, Rect, ExtensionCategory } from '@antv/g6';
class UserCardNode extends Rect {
get nodeData() {
return this.context.graph.getNodeData(this.id);
}
get data() {
return this.nodeData.data || {};
}
// Avatar style
getAvatarStyle(attributes) {
const [width, height] = this.getSize(attributes);
return {
x: -width / 2 + 20,
y: -height / 2 + 15,
width: 30,
height: 30,
src: attributes.avatarUrl || '',
radius: 15, // Circular avatar
};
}
drawAvatarShape(attributes, container) {
if (!attributes.avatarUrl) return;
const avatarStyle = this.getAvatarStyle(attributes);
this.upsert('avatar', 'image', avatarStyle, container);
}
// Status badge style
getBadgeStyle(attributes) {
const [width, height] = this.getSize(attributes);
const status = this.data.status || 'offline';
const colorMap = {
online: '#52c41a',
busy: '#faad14',
offline: '#8c8c8c',
};
return {
x: width / 2 - 8,
y: -height / 2 + 8,
r: 4,
fill: colorMap[status],
stroke: '#fff',
lineWidth: 2,
};
}
drawBadgeShape(attributes, container) {
const badgeStyle = this.getBadgeStyle(attributes);
this.upsert('badge', 'circle', badgeStyle, container);
}
// Username style
getUsernameStyle(attributes) {
const [width, height] = this.getSize(attributes);
return {
x: -width / 2 + 55,
y: -height / 2 + 20,
text: attributes.username || '',
fontSize: 14,
fill: '#262626',
fontWeight: 'bold',
textAlign: 'left',
textBaseline: 'middle',
};
}
drawUsernameShape(attributes, container) {
if (!attributes.username) return;
const usernameStyle = this.getUsernameStyle(attributes);
this.upsert('username', 'text', usernameStyle, container);
}
// Role label style
getRoleStyle(attributes) {
const [width, height] = this.getSize(attributes);
return {
x: -width / 2 + 55,
y: -height / 2 + 35,
text: attributes.userRole || '',
fontSize: 11,
fill: '#8c8c8c',
textAlign: 'left',
textBaseline: 'middle',
};
}
drawRoleShape(attributes, container) {
if (!attributes.userRole) return;
const roleStyle = this.getRoleStyle(attributes);
this.upsert('role', 'text', roleStyle, container);
}
render(attributes, container) {
// Render basic rectangle
super.render(attributes, container);
// Add various components
this.drawAvatarShape(attributes, container);
this.drawBadgeShape(attributes, container);
this.drawUsernameShape(attributes, container);
this.drawRoleShape(attributes, container);
}
}
register(ExtensionCategory.NODE, 'user-card-node', UserCardNode);
const graph = new Graph({
container: 'container',
height: 200,
data: {
nodes: [
{
id: 'user1',
style: { x: 100, y: 100 },
data: {
name: 'Zhang Xiaoming',
role: 'Frontend Engineer',
status: 'online',
avatar: 'https://api.dicebear.com/7.x/avataaars/svg?seed=Zhang',
},
},
],
},
node: {
type: 'user-card-node',
style: {
size: [140, 50],
fill: '#ffffff',
stroke: '#d9d9d9',
lineWidth: 1,
radius: 6,
// Data mapping
avatarUrl: (d) => d.data.avatar,
username: (d) => d.data.name,
userRole: (d) => d.data.role,
},
},
});
graph.render();
```
### Example 2: Node with Clickable Action Button
Add a blue button to the node that triggers events (prints logs or executes callbacks) when clicked.
```js | ob { inject: true }
import { Graph, register, Rect, ExtensionCategory } from '@antv/g6';
class ClickableNode extends Rect {
getButtonStyle(attributes) {
return {
x: 40,
y: -10,
width: 20,
height: 20,
radius: 10,
fill: '#1890ff',
cursor: 'pointer', // Mouse pointer becomes hand
};
}
drawButtonShape(attributes, container) {
const btnStyle = this.getButtonStyle(attributes, container);
const btn = this.upsert('button', 'rect', btnStyle, container);
// Add click event to button
if (!btn.__clickBound) {
btn.addEventListener('click', (e) => {
// Prevent event bubbling to avoid triggering node click event
e.stopPropagation();
// Execute business logic
console.log('Button clicked on node:', this.id);
// If there's a callback function in data, call it
if (typeof attributes.onButtonClick === 'function') {
attributes.onButtonClick(this.id, this.data);
}
});
btn.__clickBound = true; // Mark as bound to avoid duplicate binding
}
}
render(attributes, container) {
super.render(attributes, container);
// Add a button
this.drawButtonShape(attributes, container);
}
}
register(ExtensionCategory.NODE, 'clickable-node', ClickableNode);
const graph = new Graph({
container: 'container',
height: 200,
data: {
nodes: [
{
id: 'node1',
style: { x: 100, y: 100 },
},
],
},
node: {
type: 'clickable-node', // Specify using our custom node
style: {
size: [60, 30],
fill: '#7FFFD4',
stroke: '#5CACEE',
lineWidth: 2,
radius: 5,
onButtonClick: (id, data) => {},
},
},
});
graph.render();
```
### Example 3: Node Responding to State Changes (Click to Change Color)
Common interactions require nodes and edges to provide feedback through style changes, such as when the mouse moves over a node, clicking to select nodes/edges, or activating interactions on edges through interaction. All these require changing the styles of nodes and edges. There are two ways to achieve this effect:
1. Get the current state from `data.states` and handle state changes in the custom node class;
2. Separate interaction state from raw data and node drawing logic, only update the node.
We recommend users use the second approach to implement node state adjustments, which can be achieved through the following steps:
1. Implement custom node;
2. Configure node state styles in graph configuration;
3. Set node state through the `graph.setElementState()` method.
Based on rect, extend a hole shape with default white fill color that turns orange when clicked. The sample code to achieve this effect is as follows:
```js | ob { inject: true }
import { Rect, register, Graph, ExtensionCategory } from '@antv/g6';
// 1. Define node class
class SelectableNode extends Rect {
getHoleStyle(attributes) {
return {
x: 20,
y: -10,
radius: 10,
width: 20,
height: 20,
fill: attributes.holeFill,
};
}
drawHoleShape(attributes, container) {
const holeStyle = this.getHoleStyle(attributes, container);
this.upsert('hole', 'rect', holeStyle, container);
}
render(attributes, container) {
super.render(attributes, container);
this.drawHoleShape(attributes, container);
}
}
// 2. Register node
register(ExtensionCategory.NODE, 'selectable-node', SelectableNode, true);
// 3. Create graph instance
const graph = new Graph({
container: 'container',
height: 200,
data: {
nodes: [{ id: 'node-1', style: { x: 100, y: 100 } }],
},
node: {
type: 'selectable-node',
style: {
size: [120, 60],
radius: 6,
fill: '#7FFFD4',
stroke: '#5CACEE',
lineWidth: 2,
holeFill: '#fff',
},
state: {
// Mouse selected state
selected: {
holeFill: 'orange',
},
},
},
});
// 4. Add node interaction
graph.on('node:click', (evt) => {
const nodeId = evt.target.id;
graph.setElementState(nodeId, ['selected']);
});
graph.render();
```
Node Skill
packages/site/docs/manual/element/node/custom-node.zh.md anthropic-skill ~4,008 tokens---
title: 自定义节点
order: 12
---
G6 提供了一系列 [内置节点](/manual/element/node/base-node),包含 [circle(圆形节点)](/manual/element/node/circle)、[diamond(菱形节点)](/manual/element/node/diamond)、[donut(甜甜圈节点)](/manual/element/node/donut)、[ellipse(椭圆节点)](/manual/element/node/ellipse)、[hexagon(六边形节点)](/manual/element/node/hexagon)、[html(HTML节点)](/manual/element/node/html)、[image(图片节点)](/manual/element/node/image)、[rect(矩形节点)](/manual/element/node/rect)、[star(星形节点)](/manual/element/node/star) 和 [triangle(三角形节点)](/manual/element/node/triangle)。这些内置节点能够满足大部分基础场景需求。
但在实际项目中,你可能会遇到这些基础节点无法满足的需求。这时,你需要创建自定义节点。别担心,这比你想象的要简单!
## 自定义节点的方式 <Badge type="warning">选择合适的方式</Badge>
创建自定义节点的方式主要有两种途径:
### 1. 继承现有节点类型 <Badge type="success">推荐</Badge>
这是最常用的方式,你可以选择继承以下类型之一:
- [`BaseNode`](https://github.com/antvis/G6/blob/v5/packages/g6/src/elements/nodes/base-node.ts) - 最基础的节点类,提供节点的核心功能
- [`Circle`](https://github.com/antvis/G6/blob/v5/packages/g6/src/elements/nodes/circle.ts) - 圆形节点
- [`Rect`](https://github.com/antvis/G6/blob/v5/packages/g6/src/elements/nodes/rect.ts) - 矩形节点
- [`Ellipse`](https://github.com/antvis/G6/blob/v5/packages/g6/src/elements/nodes/ellipse.ts) - 椭圆节点
- [`Diamond`](https://github.com/antvis/G6/blob/v5/packages/g6/src/elements/nodes/diamond.ts) - 菱形节点
- [`Triangle`](https://github.com/antvis/G6/blob/v5/packages/g6/src/elements/nodes/triangle.ts) - 三角形节点
- [`Star`](https://github.com/antvis/G6/blob/v5/packages/g6/src/elements/nodes/star.ts) - 星形节点
- [`Image`](https://github.com/antvis/G6/blob/v5/packages/g6/src/elements/nodes/image.ts) - 图片节点
- [`Donut`](https://github.com/antvis/G6/blob/v5/packages/g6/src/elements/nodes/donut.ts) - 甜甜圈节点
- [`Hexagon`](https://github.com/antvis/G6/blob/v5/packages/g6/src/elements/nodes/hexagon.ts) - 六边形节点
**为什么选择这种方式?**
- 📌 **代码量少**:复用现有节点的属性和方法,只需专注于新增功能
- 📌 **开发迅速**:适合大多数项目需求,快速实现业务目标
- 📌 **易于维护**:代码结构清晰,继承关系明确
:::tip{title=立即开始}
如果你选择继承现有节点类型(推荐),可以直接跳到 [三步创建你的第一个自定义节点](#三步创建你的第一个自定义节点) 开始实践。大部分用户都会选择这种方式!
:::
### 2. 基于 G 图形系统从零开发 <Badge>高级用法</Badge>
如果现有节点类型都不满足需求,你可以基于 G 的底层图形系统从零创建节点。
**为什么选择这种方式?**
- 📌 **最大自由度**:完全控制节点的每个细节,实现任意复杂效果
- 📌 **特殊需求**:现有节点类型无法满足的高度定制场景
- 📌 **性能优化**:针对特定场景的性能优化
:::warning{title=注意事项}
从零开发的自定义节点需要自行处理所有细节,包括图形绘制、事件响应、状态变化等,开发难度较大。这里可以直接参考 [源码](https://github.com/antvis/G6/blob/v5/packages/g6/src/elements/nodes/base-node.ts) 进行实现。
:::
## 三步创建你的第一个自定义节点
让我们从一个简单的例子开始 - 创建一个 **带有主副标题的矩形节点**:
```js | ob { pin:false, inject: true }
import { Graph, register, Rect, ExtensionCategory } from '@antv/g6';
// 第一步:创建自定义节点类
class DualLabelNode extends Rect {
// 副标题样式
getSubtitleStyle(attributes) {
return {
x: 0,
y: 45, // 放在主标题下方
text: attributes.subtitle || '',
fontSize: 12,
fill: '#666',
textAlign: 'center',
textBaseline: 'middle',
};
}
// 绘制副标题
drawSubtitleShape(attributes, container) {
const subtitleStyle = this.getSubtitleStyle(attributes);
this.upsert('subtitle', 'text', subtitleStyle, container);
}
// 渲染方法
render(attributes = this.parsedAttributes, container) {
// 1. 渲染基础矩形和主标题
super.render(attributes, container);
// 2. 添加副标题
this.drawSubtitleShape(attributes, container);
}
}
// 第二步:注册自定义节点
register(ExtensionCategory.NODE, 'dual-label-node', DualLabelNode);
// 第三步:使用自定义节点
const graph = new Graph({
container: 'container',
height: 200,
data: {
nodes: [
{
id: 'node1',
style: { x: 100, y: 100 },
data: {
title: '节点 A', // 主标题
subtitle: '你的第一个自定义节点', // 副标题
},
},
],
},
node: {
type: 'dual-label-node',
style: {
fill: '#7FFFD4',
stroke: '#5CACEE',
lineWidth: 2,
radius: 5,
// 主标题样式
labelText: (d) => d.data.title,
labelFill: '#222',
labelFontSize: 14,
labelFontWeight: 500,
// 副标题
subtitle: (d) => d.data.subtitle,
},
},
});
graph.render();
```
### 第一步:编写自定义节点类
继承 G6 的 `Rect`(矩形节点),并添加一个副标题:
```js
import { Rect, register, Graph, ExtensionCategory } from '@antv/g6';
// 创建自定义节点,继承自 Rect
class DualLabelNode extends Rect {
// 副标题样式
getSubtitleStyle(attributes) {
return {
x: 0,
y: 45, // 放在主标题下方
text: attributes.subtitle || '',
fontSize: 12,
fill: '#666',
textAlign: 'center',
textBaseline: 'middle',
};
}
// 绘制副标题
drawSubtitleShape(attributes, container) {
const subtitleStyle = this.getSubtitleStyle(attributes);
this.upsert('subtitle', 'text', subtitleStyle, container);
}
// 渲染方法
render(attributes = this.parsedAttributes, container) {
// 1. 渲染基础矩形和主标题
super.render(attributes, container);
// 2. 添加副标题
this.drawSubtitleShape(attributes, container);
}
}
```
### 第二步:注册自定义节点
使用 `register` 方法注册节点类型,这样 G6 才能识别你的自定义节点:
```js
register(ExtensionCategory.NODE, 'dual-label-node', DualLabelNode);
```
`register` 方法需要三个参数:
- 扩展类别:`ExtensionCategory.NODE` 表示这是一个节点类型
- 类型名称:`dual-label-node` 是我们给这个自定义节点起的名字,后续会在配置中使用
- 类定义:`DualLabelNode` 是我们刚刚创建的节点类
### 第三步:应用自定义节点
在图配置中使用自定义节点:
```js
const graph = new Graph({
data: {
nodes: [
{
id: 'node1',
style: { x: 100, y: 100 },
data: {
title: '节点 A', // 主标题
subtitle: '你的第一个自定义节点', // 副标题
},
},
],
},
node: {
type: 'dual-label-node',
style: {
fill: '#7FFFD4',
stroke: '#5CACEE',
lineWidth: 2,
radius: 8,
// 主标题样式
labelText: (d) => d.data.title,
labelFill: '#222',
labelFontSize: 14,
labelFontWeight: 500,
// 副标题
subtitle: (d) => d.data.subtitle,
},
},
});
graph.render();
```
🎉 恭喜!你已经创建了第一个自定义节点。它看起来很简单,但这个过程包含了自定义节点的核心思想:**继承一个基础节点类型**,然后 **重写 `render` 方法** 来添加自定义内容。
## 理解数据流:如何在自定义节点中获取数据
在创建复杂的自定义节点之前,理解数据如何流入自定义节点是非常重要的。G6 为自定义节点提供了多种数据获取方式:
### 方式一:通过 `attributes` 参数(推荐)
`render` 方法的第一个参数 `attributes` 包含了经过处理的样式属性,包括数据驱动的样式:
```js
class CustomNode extends Rect {
render(attributes, container) {
// attributes 包含了所有样式属性,包括数据驱动的样式
console.log('当前节点的所有属性:', attributes);
// 如果在 style 中定义了 customData: (d) => d.data.someValue
// 那么可以通过 attributes.customData 获取
const customValue = attributes.customData;
super.render(attributes, container);
}
}
```
### 方式二:通过 `this.context.graph` 获取原始数据
当你需要访问节点的原始数据时,可以通过图实例获取:
```js
class CustomNode extends Rect {
// 便捷的数据获取方法
get nodeData() {
return this.context.graph.getNodeData(this.id);
}
get data() {
return this.nodeData.data || {};
}
render(attributes, container) {
// 获取节点的完整数据
const nodeData = this.nodeData;
console.log('节点完整数据:', nodeData);
// 获取 data 字段中的业务数据
const businessData = this.data;
console.log('业务数据:', businessData);
super.render(attributes, container);
}
}
```
### 数据传递的完整流程
让我们通过一个具体例子来理解数据是如何从图数据传递到自定义节点的:
```js | ob { inject: true }
import { Graph, register, Rect, ExtensionCategory } from '@antv/g6';
class DataFlowNode extends Rect {
// 方式二:通过 graph 获取原始数据
get nodeData() {
return this.context.graph.getNodeData(this.id);
}
get data() {
return this.nodeData.data || {};
}
render(attributes, container) {
// 方式一:从 attributes 获取处理后的样式
console.log('从 attributes 获取:', {
iconUrl: attributes.iconUrl,
userName: attributes.userName,
});
// 方式二:从原始数据获取
console.log('从原始数据获取:', {
icon: this.data.icon,
name: this.data.name,
role: this.data.role,
});
// 渲染基础矩形
super.render(attributes, container);
// 使用数据渲染自定义内容
if (attributes.iconUrl) {
this.upsert(
'icon',
'image',
{
x: -25,
y: -12,
width: 20,
height: 20,
src: attributes.iconUrl,
},
container,
);
}
if (attributes.userName) {
this.upsert(
'username',
'text',
{
x: 10,
y: 0,
text: attributes.userName,
fontSize: 10,
fill: '#666',
textAlign: 'center',
textBaseline: 'middle',
},
container,
);
}
}
}
register(ExtensionCategory.NODE, 'data-flow-node', DataFlowNode);
const graph = new Graph({
container: 'container',
height: 200,
data: {
nodes: [
{
id: 'user1',
style: { x: 100, y: 100 },
// 这里是节点的业务数据
data: {
name: '张三',
role: '开发者',
icon: 'https://api.dicebear.com/7.x/avataaars/svg?seed=Felix',
},
},
],
},
node: {
type: 'data-flow-node',
style: {
size: [80, 40],
fill: '#f0f9ff',
stroke: '#0ea5e9',
lineWidth: 1,
radius: 4,
// 将 data 中的数据映射到样式属性
iconUrl: (d) => d.data.icon, // 这会变成 attributes.iconUrl
userName: (d) => d.data.name, // 这会变成 attributes.userName
// 主标题使用角色信息
labelText: (d) => d.data.role,
labelFontSize: 12,
labelFill: '#0369a1',
},
},
});
graph.render();
```
:::tip{title=数据流总结}
1. **图数据定义**:在 `data.nodes[].data` 中定义业务数据
2. **样式映射**:在 `node.style` 中使用函数将数据映射到样式属性
3. **节点获取**:在自定义节点中通过 `attributes` 或 `this.context.graph` 获取数据
4. **渲染使用**:使用获取到的数据渲染自定义图形
:::
## 从简单到复杂:逐步构建功能丰富的节点
让我们通过实际例子,逐步增加节点的复杂度和功能。
### 示例一:带图标和徽章的用户卡片节点
这个例子展示如何创建一个包含头像、姓名、状态徽章的用户卡片节点:
```js | ob { inject: true }
import { Graph, register, Rect, ExtensionCategory } from '@antv/g6';
class UserCardNode extends Rect {
get nodeData() {
return this.context.graph.getNodeData(this.id);
}
get data() {
return this.nodeData.data || {};
}
// 头像样式
getAvatarStyle(attributes) {
const [width, height] = this.getSize(attributes);
return {
x: -width / 2 + 20,
y: -height / 2 + 15,
width: 30,
height: 30,
src: attributes.avatarUrl || '',
radius: 15, // 圆形头像
};
}
drawAvatarShape(attributes, container) {
if (!attributes.avatarUrl) return;
const avatarStyle = this.getAvatarStyle(attributes);
this.upsert('avatar', 'image', avatarStyle, container);
}
// 状态徽章样式
getBadgeStyle(attributes) {
const [width, height] = this.getSize(attributes);
const status = this.data.status || 'offline';
const colorMap = {
online: '#52c41a',
busy: '#faad14',
offline: '#8c8c8c',
};
return {
x: width / 2 - 8,
y: -height / 2 + 8,
r: 4,
fill: colorMap[status],
stroke: '#fff',
lineWidth: 2,
};
}
drawBadgeShape(attributes, container) {
const badgeStyle = this.getBadgeStyle(attributes);
this.upsert('badge', 'circle', badgeStyle, container);
}
// 用户名样式
getUsernameStyle(attributes) {
const [width, height] = this.getSize(attributes);
return {
x: -width / 2 + 55,
y: -height / 2 + 20,
text: attributes.username || '',
fontSize: 14,
fill: '#262626',
fontWeight: 'bold',
textAlign: 'left',
textBaseline: 'middle',
};
}
drawUsernameShape(attributes, container) {
if (!attributes.username) return;
const usernameStyle = this.getUsernameStyle(attributes);
this.upsert('username', 'text', usernameStyle, container);
}
// 角色标签样式
getRoleStyle(attributes) {
const [width, height] = this.getSize(attributes);
return {
x: -width / 2 + 55,
y: -height / 2 + 35,
text: attributes.userRole || '',
fontSize: 11,
fill: '#8c8c8c',
textAlign: 'left',
textBaseline: 'middle',
};
}
drawRoleShape(attributes, container) {
if (!attributes.userRole) return;
const roleStyle = this.getRoleStyle(attributes);
this.upsert('role', 'text', roleStyle, container);
}
render(attributes, container) {
// 渲染基础矩形
super.render(attributes, container);
// 添加各个组件
this.drawAvatarShape(attributes, container);
this.drawBadgeShape(attributes, container);
this.drawUsernameShape(attributes, container);
this.drawRoleShape(attributes, container);
}
}
register(ExtensionCategory.NODE, 'user-card-node', UserCardNode);
const graph = new Graph({
container: 'container',
height: 200,
data: {
nodes: [
{
id: 'user1',
style: { x: 100, y: 100 },
data: {
name: '张小明',
role: '前端工程师',
status: 'online',
avatar: 'https://api.dicebear.com/7.x/avataaars/svg?seed=Zhang',
},
},
],
},
node: {
type: 'user-card-node',
style: {
size: [140, 50],
fill: '#ffffff',
stroke: '#d9d9d9',
lineWidth: 1,
radius: 6,
// 数据映射
avatarUrl: (d) => d.data.avatar,
username: (d) => d.data.name,
userRole: (d) => d.data.role,
},
},
});
graph.render();
```
### 示例二:可点击操作按钮的节点
给节点加一个蓝色按钮,点击后触发事件(打印日志或执行回调)。
```js | ob { inject: true }
import { Graph, register, Rect, ExtensionCategory } from '@antv/g6';
class ClickableNode extends Rect {
getButtonStyle(attributes) {
return {
x: 40,
y: -10,
width: 20,
height: 20,
radius: 10,
fill: '#1890ff',
cursor: 'pointer', // 鼠标指针变为手型
};
}
drawButtonShape(attributes, container) {
const btnStyle = this.getButtonStyle(attributes, container);
const btn = this.upsert('button', 'rect', btnStyle, container);
// 为按钮添加点击事件
if (!btn.__clickBound) {
btn.addEventListener('click', (e) => {
// 阻止事件冒泡,避免触发节点的点击事件
e.stopPropagation();
// 执行业务逻辑
console.log('Button clicked on node:', this.id);
// 如果数据中有回调函数,则调用
if (typeof attributes.onButtonClick === 'function') {
attributes.onButtonClick(this.id, this.data);
}
});
btn.__clickBound = true; // 标记已绑定事件,避免重复绑定
}
}
render(attributes, container) {
super.render(attributes, container);
// 添加一个按钮
this.drawButtonShape(attributes, container);
}
}
register(ExtensionCategory.NODE, 'clickable-node', ClickableNode);
const graph = new Graph({
container: 'container',
height: 200,
data: {
nodes: [
{
id: 'node1',
style: { x: 100, y: 100 },
},
],
},
node: {
type: 'clickable-node', // 指定使用我们的自定义节点
style: {
size: [60, 30],
fill: '#7FFFD4',
stroke: '#5CACEE',
lineWidth: 2,
radius: 5,
onButtonClick: (id, data) => {},
},
},
});
graph.render();
```
### 示例三:响应状态变化的节点(点击变色)
常见的交互都需要节点和边通过样式变化做出反馈,例如鼠标移动到节点上、点击选中节点/边、通过交互激活边上的交互等,都需要改变节点和边的样式,有两种方式来实现这种效果:
1. 从 `data.states` 获取当前状态,在自定义节点类中处理状态变化;
2. 将交互状态同原始数据和绘制节点的逻辑分开,仅更新节点。
我们推荐用户使用第二种方式来实现节点的状态调整,可以通过以下方式来实现:
1. 实现自定义节点;
2. 在图配置项中配置节点状态样式;
3. 通过 `graph.setElementState()` 方法来设置节点状态。
基于 rect 扩展出一个 hole 图形,默认填充色为白色,当鼠标点击时变成橙色,实现这一效果的示例代码如下:
```js | ob { inject: true }
import { Rect, register, Graph, ExtensionCategory } from '@antv/g6';
// 1. 定义节点类
class SelectableNode extends Rect {
getHoleStyle(attributes) {
return {
x: 20,
y: -10,
radius: 10,
width: 20,
height: 20,
fill: attributes.holeFill,
};
}
drawHoleShape(attributes, container) {
const holeStyle = this.getHoleStyle(attributes, container);
this.upsert('hole', 'rect', holeStyle, container);
}
render(attributes, container) {
super.render(attributes, container);
this.drawHoleShape(attributes, container);
}
}
// 2. 注册节点
register(ExtensionCategory.NODE, 'selectable-node', SelectableNode, true);
// 3. 创建图实例
const graph = new Graph({
container: 'container',
height: 200,
data: {
nodes: [{ id: 'node-1', style: { x: 100, y: 100 } }],
},
node: {
type: 'selectable-node',
style: {
size: [120, 60],
radius: 6,
fill: '#7FFFD4',
stroke: '#5CACEE',
lineWidth: 2,
holeFill: '#fff',
},
state: {
// 鼠标选中状态
selected: {
holeFill: 'orange',
},
},
},
});
// 4. 添加节点交互
graph.on('node:click', (evt) => {
const nodeId = evt.target.id;
graph.setElementState(nodeId, ['selected']);
});
graph.render();
```
Node Skill
packages/site/docs/manual/element/node/Diamond.en.md anthropic-skill ~574 tokens---
title: Diamond Node
order: 3
---
## Overview
A diamond is a geometric shape with four equal sides and diagonal symmetry.
Applicable scenarios:
- Used to represent decision nodes, conditional judgments, or critical paths.
- Suitable for representing decision nodes or key steps in flowcharts.
- Commonly used in flowcharts, decision trees, network diagrams, etc.
## Online Experience
<embed src="@/common/api/elements/nodes/diamond.md"></embed>
## Style Configuration
> If the element has specific attributes, we will list them below. For all general style attributes, see [BaseNode](/en/manual/element/node/base-node)
## Example
### Built-in Diamond Node Effect
```js | ob { inject: true }
import { Graph, iconfont } from '@antv/g6';
const style = document.createElement('style');
style.innerHTML = `@import url('${iconfont.css}');`;
document.head.appendChild(style);
const data = {
nodes: [
{ id: 'default' },
{ id: 'halo' },
{ id: 'badges' },
{ id: 'ports' },
{
id: 'active',
states: ['active'],
},
{
id: 'selected',
states: ['selected'],
},
{
id: 'highlight',
states: ['highlight'],
},
{
id: 'inactive',
states: ['inactive'],
},
{
id: 'disabled',
states: ['disabled'],
},
],
};
const graph = new Graph({
container: 'container',
data,
node: {
type: 'diamond',
style: {
size: 40,
labelText: (d) => d.id,
iconFontFamily: 'iconfont',
iconText: '\ue602',
halo: (d) => (d.id === 'halo' ? true : false),
badges: (d) =>
d.id === 'badges'
? [
{
text: 'A',
placement: 'right-top',
},
{
text: 'Important',
placement: 'right',
},
{
text: 'Notice',
placement: 'right-bottom',
},
]
: [],
badgeFontSize: 8,
badgePadding: [1, 4],
portR: 3,
ports: (d) =>
d.id === 'ports'
? [{ placement: 'left' }, { placement: 'right' }, { placement: 'top' }, { placement: 'bottom' }]
: [],
},
},
layout: {
type: 'grid',
},
});
graph.render();
```
Node Skill
packages/site/docs/manual/element/node/Diamond.zh.md anthropic-skill ~486 tokens---
title: 菱形节点 Diamond
order: 3
---
## 概述
菱形是一个四边相等的几何形状,具有对角线对称性。
适用场景:
- 用于表示决策节点、条件判断或关键路径。
- 适合表示流程图中的判断节点或关键步骤。
- 常用于流程图、决策树、网络图等。
## 在线体验
<embed src="@/common/api/elements/nodes/diamond.md"></embed>
## 样式配置
> 如果元素有其特定的属性,我们将在下面列出。对于所有的通用样式属性,见 [BaseNode](/manual/element/node/base-node)
## 示例
### 内置菱形节点效果
```js | ob { inject: true }
import { Graph, iconfont } from '@antv/g6';
const style = document.createElement('style');
style.innerHTML = `@import url('${iconfont.css}');`;
document.head.appendChild(style);
const data = {
nodes: [
{ id: 'default' },
{ id: 'halo' },
{ id: 'badges' },
{ id: 'ports' },
{
id: 'active',
states: ['active'],
},
{
id: 'selected',
states: ['selected'],
},
{
id: 'highlight',
states: ['highlight'],
},
{
id: 'inactive',
states: ['inactive'],
},
{
id: 'disabled',
states: ['disabled'],
},
],
};
const graph = new Graph({
container: 'container',
data,
node: {
type: 'diamond',
style: {
size: 40,
labelText: (d) => d.id,
iconFontFamily: 'iconfont',
iconText: '\ue602',
halo: (d) => (d.id === 'halo' ? true : false),
badges: (d) =>
d.id === 'badges'
? [
{
text: 'A',
placement: 'right-top',
},
{
text: 'Important',
placement: 'right',
},
{
text: 'Notice',
placement: 'right-bottom',
},
]
: [],
badgeFontSize: 8,
badgePadding: [1, 4],
portR: 3,
ports: (d) =>
d.id === 'ports'
? [{ placement: 'left' }, { placement: 'right' }, { placement: 'top' }, { placement: 'bottom' }]
: [],
},
},
layout: {
type: 'grid',
},
});
graph.render();
```
Node Skill
packages/site/docs/manual/element/node/Donut.en.md anthropic-skill ~2,005 tokens---
title: Donut Node
order: 4
---
## Overview
The donut node is a ring-shaped geometric figure composed of two concentric circles.
Applicable scenarios:
- Used to represent proportional data, such as completion progress and ratio analysis.
- Suitable for representing multi-layered data, such as nested ring charts.
- Commonly used in data visualization, dashboards, progress charts, etc.
## Online Experience
<embed src="@/common/api/elements/nodes/donut.md"></embed>
## Style Configuration
> If the element has specific attributes, we will list them below. For all general style attributes, see [BaseNode](/en/manual/element/node/base-node)
| Attribute | Description | Type | Default | Required |
| ------------------- | ----------------------------------- | --------------------------------------- | --------- | -------- |
| donutFill | Fill color | string | `#1783FF` | |
| donutFillOpacity | Fill color opacity | number \| string | 1 | |
| donutLineCap | Stroke end style | `round` \| `square` \| `butt` | `butt` | |
| donutLineDash | Stroke dash style | number[] | - | |
| donutLineDashOffset | Stroke dash offset | number | - | |
| donutLineJoin | Stroke join style | `round` \| `bevel` \| `miter` | `miter` | |
| donutLineWidth | Stroke width | number | 1 | |
| donutOpacity | Opacity | number \| string | 1 | |
| donutPalette | Color or palette name | string \| string[] | `tableau` | |
| donuts | Donut data | number[] \| [DonutRound](#donutround)[] | - | |
| donutShadowBlur | Shadow blur | number | - | |
| donutShadowColor | Shadow color | string | - | |
| donutShadowOffsetX | Shadow offset in x-axis direction | number \| string | - | |
| donutShadowOffsetY | Shadow offset in y-axis direction | number \| string | - | |
| donutShadowType | Shadow type | `inner` \| `outer` | `outer` | |
| donutStroke | Stroke color | string | `#000` | |
| donutStrokeOpacity | Stroke color opacity | number \| string | 1 | |
| donutVisibility | Visibility of the shape | `visible` \| `hidden` | `visible` | |
| innerR | Inner ring radius, percentage or px | string \| number | 50% | |
### DonutRound
| Attribute | Description | Type | Default | Required |
| -------------- | --------------------------------- | ----------------------------- | --------- | -------- |
| color | Color | string | - | |
| fill | Fill color | string | `#1783FF` | |
| fillOpacity | Fill color opacity | number \| string | 1 | |
| lineCap | Stroke end style | `round` \| `square` \| `butt` | `butt` | |
| lineDash | Stroke dash style | number[] | - | |
| lineDashOffset | Stroke dash offset | number | - | |
| lineJoin | Stroke join style | `round` \| `bevel` \| `miter` | `miter` | |
| lineWidth | Stroke width | number | 1 | |
| opacity | Opacity | number \| string | 1 | |
| shadowBlur | Shadow blur | number | - | |
| shadowColor | Shadow color | string | - | |
| shadowOffsetX | Shadow offset in x-axis direction | number \| string | - | |
| shadowOffsetY | Shadow offset in y-axis direction | number \| string | - | |
| shadowType | Shadow type | `inner` \| `outer` | `outer` | |
| stroke | Stroke color | string | `#000` | |
| strokeOpacity | Stroke color opacity | number \| string | 1 | |
| value | Value for ratio calculation | number | - | ✓ |
| visibility | Visibility of the shape | `visible` \| `hidden` | `visible` | |
## Example
### Built-in Donut Node Effect
```js | ob { inject: true }
import { Graph, iconfont } from '@antv/g6';
const style = document.createElement('style');
style.innerHTML = `@import url('${iconfont.css}');`;
document.head.appendChild(style);
const data = {
nodes: [
{ id: 'default', index: 0 },
{ id: 'halo', index: 1 },
{ id: 'badges', index: 2 },
{ id: 'ports', index: 3 },
{
id: 'active',
states: ['active'],
index: 4,
},
{
id: 'selected',
states: ['selected'],
index: 5,
},
{
id: 'highlight',
states: ['highlight'],
index: 6,
},
{
id: 'inactive',
states: ['inactive'],
index: 7,
},
{
id: 'disabled',
states: ['disabled'],
index: 8,
},
],
};
const graph = new Graph({
container: 'container',
animation: false,
data,
node: {
type: 'donut',
style: {
size: 80,
fill: '#DB9D0D',
innerR: 20,
donuts: (item) => {
const { index } = item;
if (index === 0) return [1, 2, 3]; // donuts数据类型为number[]时,根据值的大小决定环的占比
if (index === 1) {
return [
{ value: 50, color: 'red' },
{ value: 150, color: 'green' },
{ value: 100, color: 'blue' },
];
}
if (index === 4) {
return [
{ value: 150, fill: 'pink', stroke: '#fff', lineWidth: 1 },
{ value: 250, stroke: '#fff', lineWidth: 1 },
{ value: 200, stroke: '#fff', lineWidth: 1 },
];
}
return [100, 200, 100, 200];
},
labelText: (d) => d.id,
iconFontFamily: 'iconfont',
iconText: '\ue602',
halo: (d) => (d.id === 'halo' ? true : false),
badges: (d) =>
d.id === 'badges'
? [
{
text: 'A',
placement: 'right-top',
},
{
text: 'Important',
placement: 'right',
},
{
text: 'Notice',
placement: 'right-bottom',
},
]
: [],
badgeFontSize: 8,
badgePadding: [1, 4],
portR: 3,
ports: (d) =>
d.id === 'ports'
? [{ placement: 'left' }, { placement: 'right' }, { placement: 'top' }, { placement: 'bottom' }]
: [],
},
},
layout: {
type: 'grid',
},
});
graph.render();
```
Node Skill
packages/site/docs/manual/element/node/Donut.zh.md anthropic-skill ~1,765 tokens---
title: 甜甜圈节点 Donut
order: 4
---
## 概述
甜甜圈节点是一个环形几何形状,由内外两个同心圆组成。
适用场景:
- 用于表示比例数据,如完成进度、占比分析。
- 适合表示多层数据,如嵌套的环形图。
- 常用于数据可视化、仪表盘、进度图等。
## 在线体验
<embed src="@/common/api/elements/nodes/donut.md"></embed>
## 样式配置
> 如果元素有其特定的属性,我们将在下面列出。对于所有的通用样式属性,见 [BaseNode](/manual/element/node/base-node)
| 属性 | 描述 | 类型 | 默认值 | 必选 |
| ------------------- | ------------------------------ | ------------------------------------------- | --------- | ---- |
| donutFill | 填充色 | string | `#1783FF` | |
| donutFillOpacity | 填充色透明度 | number \| string | 1 | |
| donutLineCap | 描边端点样式 | `round` \| `square` \| `butt` | `butt` | |
| donutLineDash | 描边虚线样式 | number[] | - | |
| donutLineDashOffset | 描边虚线偏移量 | number | - | |
| donutLineJoin | 描边连接处样式 | `round` \| `bevel` \| `miter` | `miter` | |
| donutLineWidth | 描边宽度 | number | 1 | |
| donutOpacity | 透明度 | number \| string | 1 | |
| donutPalette | 颜色或者色板名 | string | string[] | `tableau` | |
| donuts | 圆环数据 | number[] | [DonutRound](#donutround)[] | - | |
| donutShadowBlur | 阴影模糊度 | number | - | |
| donutShadowColor | 阴影颜色 | string | - | |
| donutShadowOffsetX | 阴影在 x 轴方向上的偏移量 | number \| string | - | |
| donutShadowOffsetY | 阴影在 y 轴方向上的偏移量 | number \| string | - | |
| donutShadowType | 阴影类型 | `inner` \| `outer` | `outer` | |
| donutStroke | 描边色 | string | `#000` | |
| donutStrokeOpacity | 描边色透明度 | number \| string | 1 | |
| donutVisibility | 图形是否可见 | `visible` \| `hidden` | `visible` | |
| innerR | 内环半径,使用百分比或者像素值 | string | number | 50% | |
### DonutRound
| 属性 | 描述 | 类型 | 默认值 | 必选 |
| -------------- | ------------------------- | ----------------------------- | --------- | ---- |
| color | 颜色 | string | - | |
| fill | 填充色 | string | `#1783FF` | |
| fillOpacity | 填充色透明度 | number \| string | 1 | |
| lineCap | 描边端点样式 | `round` \| `square` \| `butt` | `butt` | |
| lineDash | 描边虚线样式 | number[] | - | |
| lineDashOffset | 描边虚线偏移量 | number | - | |
| lineJoin | 描边连接处样式 | `round` \| `bevel` \| `miter` | `miter` | |
| lineWidth | 描边宽度 | number | 1 | |
| opacity | 透明度 | number \| string | 1 | |
| shadowBlur | 阴影模糊度 | number | - | |
| shadowColor | 阴影颜色 | string | - | |
| shadowOffsetX | 阴影在 x 轴方向上的偏移量 | number \| string | - | |
| shadowOffsetY | 阴影在 y 轴方向上的偏移量 | number \| string | - | |
| shadowType | 阴影类型 | `inner` \| `outer` | `outer` | |
| stroke | 描边色 | string | `#000` | |
| strokeOpacity | 描边色透明度 | number \| string | 1 | |
| value | 数值,用于计算比例 | number | - | ✓ |
| visibility | 图形是否可见 | `visible` \| `hidden` | `visible` | |
## 示例
### 内置甜甜圈节点效果
```js | ob { inject: true }
import { Graph, iconfont } from '@antv/g6';
const style = document.createElement('style');
style.innerHTML = `@import url('${iconfont.css}');`;
document.head.appendChild(style);
const data = {
nodes: [
{ id: 'default', index: 0 },
{ id: 'halo', index: 1 },
{ id: 'badges', index: 2 },
{ id: 'ports', index: 3 },
{
id: 'active',
states: ['active'],
index: 4,
},
{
id: 'selected',
states: ['selected'],
index: 5,
},
{
id: 'highlight',
states: ['highlight'],
index: 6,
},
{
id: 'inactive',
states: ['inactive'],
index: 7,
},
{
id: 'disabled',
states: ['disabled'],
index: 8,
},
],
};
const graph = new Graph({
container: 'container',
animation: false,
data,
node: {
type: 'donut',
style: {
size: 80,
fill: '#DB9D0D',
innerR: 20,
donuts: (item) => {
const { index } = item;
if (index === 0) return [1, 2, 3]; // donuts数据类型为number[]时,根据值的大小决定环的占比
if (index === 1) {
return [
{ value: 50, color: 'red' },
{ value: 150, color: 'green' },
{ value: 100, color: 'blue' },
];
}
if (index === 4) {
return [
{ value: 150, fill: 'pink', stroke: '#fff', lineWidth: 1 },
{ value: 250, stroke: '#fff', lineWidth: 1 },
{ value: 200, stroke: '#fff', lineWidth: 1 },
];
}
return [100, 200, 100, 200];
},
labelText: (d) => d.id,
iconFontFamily: 'iconfont',
iconText: '\ue602',
halo: (d) => (d.id === 'halo' ? true : false),
badges: (d) =>
d.id === 'badges'
? [
{
text: 'A',
placement: 'right-top',
},
{
text: 'Important',
placement: 'right',
},
{
text: 'Notice',
placement: 'right-bottom',
},
]
: [],
badgeFontSize: 8,
badgePadding: [1, 4],
portR: 3,
ports: (d) =>
d.id === 'ports'
? [{ placement: 'left' }, { placement: 'right' }, { placement: 'top' }, { placement: 'bottom' }]
: [],
},
},
layout: {
type: 'grid',
},
});
graph.render();
```
Node Skill
packages/site/docs/manual/element/node/Ellipse.en.md anthropic-skill ~578 tokens---
title: Ellipse Node
order: 5
---
## Overview
An ellipse is a geometric shape with asymmetrical major and minor axes.
Applicable scenarios:
- Used to represent dynamic nodes, asymmetric relationships, or special shapes.
- Suitable for representing flowcharts, network diagrams, or topology diagrams.
- Commonly used in flowcharts, network diagrams, topology diagrams, etc.
## Online Experience
<embed src="@/common/api/elements/nodes/ellipse.md"></embed>
## Style Configuration
> If the element has specific attributes, we will list them below. For all general style attributes, see [BaseNode](/en/manual/element/node/base-node)
## Example
### Built-in Ellipse Node Effect
```js | ob { inject: true }
import { Graph, iconfont } from '@antv/g6';
const style = document.createElement('style');
style.innerHTML = `@import url('${iconfont.css}');`;
document.head.appendChild(style);
const data = {
nodes: [
{ id: 'default' },
{ id: 'halo' },
{ id: 'badges' },
{ id: 'ports' },
{
id: 'active',
states: ['active'],
},
{
id: 'selected',
states: ['selected'],
},
{
id: 'highlight',
states: ['highlight'],
},
{
id: 'inactive',
states: ['inactive'],
},
{
id: 'disabled',
states: ['disabled'],
},
],
};
const graph = new Graph({
container: 'container',
data,
node: {
type: 'ellipse',
style: {
size: [45, 35],
labelText: (d) => d.id,
iconFontFamily: 'iconfont',
iconText: '\ue602',
halo: (d) => (d.id === 'halo' ? true : false),
badges: (d) =>
d.id === 'badges'
? [
{
text: 'A',
placement: 'right-top',
},
{
text: 'Important',
placement: 'right',
},
{
text: 'Notice',
placement: 'right-bottom',
},
]
: [],
badgeFontSize: 8,
badgePadding: [1, 4],
portR: 3,
ports: (d) =>
d.id === 'ports'
? [{ placement: 'left' }, { placement: 'right' }, { placement: 'top' }, { placement: 'bottom' }]
: [],
},
},
layout: {
type: 'grid',
},
});
graph.render();
```
Node Skill
packages/site/docs/manual/element/node/Ellipse.zh.md anthropic-skill ~486 tokens---
title: 椭圆形节点 Ellipse
order: 5
---
## 概述
椭圆是一个长轴和短轴不对称的几何形状。
适用场景:
- 用于表示动态节点、非对称关系或特殊形状。
- 适合表示流程图、网络图或拓扑图。
- 常用于流程图、网络图、拓扑图等。
## 在线体验
<embed src="@/common/api/elements/nodes/ellipse.md"></embed>
## 样式配置
> 如果元素有其特定的属性,我们将在下面列出。对于所有的通用样式属性,见 [BaseNode](/manual/element/node/base-node)
## 示例
### 内置椭圆形节点效果
```js | ob { inject: true }
import { Graph, iconfont } from '@antv/g6';
const style = document.createElement('style');
style.innerHTML = `@import url('${iconfont.css}');`;
document.head.appendChild(style);
const data = {
nodes: [
{ id: 'default' },
{ id: 'halo' },
{ id: 'badges' },
{ id: 'ports' },
{
id: 'active',
states: ['active'],
},
{
id: 'selected',
states: ['selected'],
},
{
id: 'highlight',
states: ['highlight'],
},
{
id: 'inactive',
states: ['inactive'],
},
{
id: 'disabled',
states: ['disabled'],
},
],
};
const graph = new Graph({
container: 'container',
data,
node: {
type: 'ellipse',
style: {
size: [45, 35],
labelText: (d) => d.id,
iconFontFamily: 'iconfont',
iconText: '\ue602',
halo: (d) => (d.id === 'halo' ? true : false),
badges: (d) =>
d.id === 'badges'
? [
{
text: 'A',
placement: 'right-top',
},
{
text: 'Important',
placement: 'right',
},
{
text: 'Notice',
placement: 'right-bottom',
},
]
: [],
badgeFontSize: 8,
badgePadding: [1, 4],
portR: 3,
ports: (d) =>
d.id === 'ports'
? [{ placement: 'left' }, { placement: 'right' }, { placement: 'top' }, { placement: 'bottom' }]
: [],
},
},
layout: {
type: 'grid',
},
});
graph.render();
```
Node Skill
packages/site/docs/manual/element/node/Hexagon.en.md anthropic-skill ~697 tokens---
title: Hexagon Node
order: 6
---
## Overview
A hexagon is a geometric shape with six equal sides, featuring a honeycomb structure.
Applicable scenarios:
- Used to represent honeycomb networks, molecular structures, or tightly packed nodes.
- Suitable for representing network topology, molecular diagrams, or game maps.
- Commonly used in network diagrams, topology diagrams, game design, etc.
## Online Experience
<embed src="@/common/api/elements/nodes/hexagon.md"></embed>
## Style Configuration
> If the element has specific attributes, we will list them below. For all general style attributes, see [BaseNode](/en/manual/element/node/base-node)
| Attribute | Description | Type | Default | Required |
| --------- | ------------------------------------------------------------------ | ------ | --------------------------------------- | -------- |
| outerR | Outer radius, the distance from the hexagon's center to any vertex | number | Half of the minimum of width and height | |
## Example
### Built-in Hexagon Node Effect
```js | ob { inject: true }
import { Graph, iconfont } from '@antv/g6';
const style = document.createElement('style');
style.innerHTML = `@import url('${iconfont.css}');`;
document.head.appendChild(style);
const data = {
nodes: [
{ id: 'default' },
{ id: 'halo' },
{ id: 'badges' },
{ id: 'ports' },
{
id: 'active',
states: ['active'],
},
{
id: 'selected',
states: ['selected'],
},
{
id: 'highlight',
states: ['highlight'],
},
{
id: 'inactive',
states: ['inactive'],
},
{
id: 'disabled',
states: ['disabled'],
},
],
};
const graph = new Graph({
container: 'container',
data,
node: {
type: 'hexagon',
style: {
size: 40,
labelText: (d) => d.id,
iconFontFamily: 'iconfont',
iconText: '\ue602',
halo: (d) => (d.id === 'halo' ? true : false),
badges: (d) =>
d.id === 'badges'
? [
{
text: 'A',
placement: 'right-top',
},
{
text: 'Important',
placement: 'right',
},
{
text: 'Notice',
placement: 'right-bottom',
},
]
: [],
badgeFontSize: 8,
badgePadding: [1, 4],
outerR: 30, // 外半径
portR: 3,
ports: (d) =>
d.id === 'ports'
? [{ placement: 'left' }, { placement: 'right' }, { placement: 'top' }, { placement: 'bottom' }]
: [],
},
},
layout: {
type: 'grid',
},
});
graph.render();
```
Node Skill
packages/site/docs/manual/element/node/Hexagon.zh.md anthropic-skill ~556 tokens---
title: 六边形节点 Hexagon
order: 6
---
## 概述
六边形是一个六边相等的几何形状,具有蜂窝状结构。
适用场景:
- 用于表示蜂窝网络、分子结构或紧密排列的节点。
- 适合表示网络拓扑、分子图或游戏地图。
- 常用于网络图、拓扑图、游戏设计等。
## 在线体验
<embed src="@/common/api/elements/nodes/hexagon.md"></embed>
## 样式配置
> 如果元素有其特定的属性,我们将在下面列出。对于所有的通用样式属性,见 [BaseNode](/manual/element/node/base-node)
| 属性 | 描述 | 类型 | 默认值 | 必选 |
| ------ | ---------------------------------------- | ------ | ------------------------ | ---- |
| outerR | 外半径,是指从六边形中心到任意顶点的距离 | number | 默认为宽高的最小值的一半 | |
## 示例
### 内置六边形节点效果
```js | ob { inject: true }
import { Graph, iconfont } from '@antv/g6';
const style = document.createElement('style');
style.innerHTML = `@import url('${iconfont.css}');`;
document.head.appendChild(style);
const data = {
nodes: [
{ id: 'default' },
{ id: 'halo' },
{ id: 'badges' },
{ id: 'ports' },
{
id: 'active',
states: ['active'],
},
{
id: 'selected',
states: ['selected'],
},
{
id: 'highlight',
states: ['highlight'],
},
{
id: 'inactive',
states: ['inactive'],
},
{
id: 'disabled',
states: ['disabled'],
},
],
};
const graph = new Graph({
container: 'container',
data,
node: {
type: 'hexagon',
style: {
size: 40,
labelText: (d) => d.id,
iconFontFamily: 'iconfont',
iconText: '\ue602',
halo: (d) => (d.id === 'halo' ? true : false),
badges: (d) =>
d.id === 'badges'
? [
{
text: 'A',
placement: 'right-top',
},
{
text: 'Important',
placement: 'right',
},
{
text: 'Notice',
placement: 'right-bottom',
},
]
: [],
badgeFontSize: 8,
badgePadding: [1, 4],
outerR: 30, // 外半径
portR: 3,
ports: (d) =>
d.id === 'ports'
? [{ placement: 'left' }, { placement: 'right' }, { placement: 'top' }, { placement: 'bottom' }]
: [],
},
},
layout: {
type: 'grid',
},
});
graph.render();
```
Node Skill
packages/site/docs/manual/element/node/Html.en.md anthropic-skill ~3,089 tokens---
title: HTML Node
order: 7
---
## Overview
HTML node is a custom rectangular area used to display HTML content. It allows you to embed arbitrary HTML elements within graph nodes, providing great flexibility for creating complex custom nodes.
Use Cases:
- Used to represent complex custom nodes such as tables, charts, or rich text
- Suitable for representing custom visual elements or interactive components
- Commonly used in custom charts, UI design, dashboards, and other scenarios
- When you need to embed interactive elements like forms and buttons in nodes
## Framework Support
> **💡 Tips**:
>
> - **React Projects**: Recommended to use [React Node](/en/manual/element/node/react-node) for better component-based development experience
> - **Vue Projects**: Vue Node is not currently supported, community contributions are welcome
> - **Native HTML**: The HTML node introduced in this document is suitable for native HTML development
## Online Demo
<embed src="@/common/api/elements/nodes/html.md"></embed>
## Style Configuration
> If the element has specific properties, we will list them below. For all common style properties, see [BaseNode](/en/manual/element/node/base-node)
| Property | Description | Type | Default | Required |
| --------- | ----------------------------------------------------------------------------------------------------- | --------------------------- | ------- | -------- |
| dx | Horizontal offset. HTML container defaults to top-left corner as origin, use dx for horizontal offset | number | 0 | |
| dy | Vertical offset. HTML container defaults to top-left corner as origin, use dy for vertical offset | number | 0 | |
| innerHTML | HTML content, can be string or `HTMLElement` | string | `HTMLElement` | - | ✓ |
## Examples
### Basic HTML Node
```js | ob { inject: true }
import { Graph } from '@antv/g6';
const graph = new Graph({
container: 'container',
data: {
nodes: [
{ id: 'node-1', data: { location: 'East', status: 'error', ip: '192.168.1.2' } },
{ id: 'node-2', data: { location: 'West', status: 'overload', ip: '192.168.1.3' } },
{ id: 'node-3', data: { location: 'South', status: 'running', ip: '192.168.1.4' } },
],
},
node: {
type: 'html',
style: {
size: [240, 80],
dx: -120,
dy: -40,
innerHTML: (d) => {
const ICON_MAP = {
error: '❌',
overload: '⚡',
running: '✅',
};
const COLOR_MAP = {
error: '#f5222d',
overload: '#faad14',
running: '#52c41a',
};
const {
data: { location, status, ip },
} = d;
const color = COLOR_MAP[status];
return `
<div
style="
width:100%;
height: 100%;
background: ${color}bb;
border: 1px solid ${color};
color: #fff;
user-select: none;
display: flex;
padding: 10px;
border-radius: 8px;
"
>
<div style="display: flex;flex-direction: column;flex: 1;">
<div style="font-weight: bold; font-size: 14px;">
${location} Node
</div>
<div style="font-size: 12px; margin-top: 4px;">
status: ${status} ${ICON_MAP[status]}
</div>
</div>
<div>
<span style="border: 1px solid white; padding: 2px 6px; border-radius: 4px; font-size: 12px;">
${ip}
</span>
</div>
</div>`;
},
},
},
layout: {
type: 'grid',
},
behaviors: ['drag-element', 'zoom-canvas'],
});
graph.render();
```
### HTML Node with Interactive Buttons
```js | ob { inject: true }
import { Graph } from '@antv/g6';
const graph = new Graph({
container: 'container',
data: {
nodes: [
{ id: 'server-1', data: { name: 'Web Server', cpu: 45, memory: 67, status: 'online' } },
{ id: 'server-2', data: { name: 'Database', cpu: 78, memory: 89, status: 'warning' } },
{ id: 'server-3', data: { name: 'Cache Server', cpu: 23, memory: 34, status: 'offline' } },
],
},
node: {
type: 'html',
style: {
size: [280, 210],
dx: -140,
dy: -105,
innerHTML: (d) => {
const { data } = d;
const statusColors = {
online: '#52c41a',
warning: '#faad14',
offline: '#f5222d',
};
return `
<div style="
width: 100%;
height: 100%;
background: #fff;
border: 2px solid ${statusColors[data.status]};
border-radius: 12px;
padding: 16px;
box-shadow: 0 4px 12px rgba(0,0,0,0.1);
font-family: -apple-system, BlinkMacSystemFont, 'Segoe UI', Roboto, sans-serif;
">
<div style="display: flex; justify-content: space-between; align-items: center; margin-bottom: 12px;">
<h3 style="margin: 0; font-size: 16px; color: #333;">${data.name}</h3>
<span style="
background: ${statusColors[data.status]};
color: white;
padding: 2px 8px;
border-radius: 12px;
font-size: 12px;
font-weight: bold;
">${data.status.toUpperCase()}</span>
</div>
<div style="margin-bottom: 12px;">
<div style="display: flex; justify-content: space-between; margin-bottom: 4px;">
<span style="font-size: 12px; color: #666;">CPU</span>
<span style="font-size: 12px; color: #333;">${data.cpu}%</span>
</div>
<div style="background: #f0f0f0; height: 6px; border-radius: 3px; overflow: hidden;">
<div style="background: ${data.cpu > 70 ? '#f5222d' : '#52c41a'}; height: 100%; width: ${data.cpu}%; transition: width 0.3s;"></div>
</div>
</div>
<div style="margin-bottom: 12px;">
<div style="display: flex; justify-content: space-between; margin-bottom: 4px;">
<span style="font-size: 12px; color: #666;">Memory</span>
<span style="font-size: 12px; color: #333;">${data.memory}%</span>
</div>
<div style="background: #f0f0f0; height: 6px; border-radius: 3px; overflow: hidden;">
<div style="background: ${data.memory > 80 ? '#f5222d' : '#1890ff'}; height: 100%; width: ${data.memory}%; transition: width 0.3s;"></div>
</div>
</div>
<div style="display: flex; gap: 8px;">
<button
onclick="handleRestart('${d.id}')"
style="
flex: 1;
padding: 6px 12px;
background: #1890ff;
color: white;
border: none;
border-radius: 6px;
font-size: 12px;
cursor: pointer;
transition: background 0.2s;
"
onmouseover="this.style.background='#40a9ff'"
onmouseout="this.style.background='#1890ff'"
>Restart</button>
<button
onclick="handleMonitor('${d.id}')"
style="
flex: 1;
padding: 6px 12px;
background: #52c41a;
color: white;
border: none;
border-radius: 6px;
font-size: 12px;
cursor: pointer;
transition: background 0.2s;
"
onmouseover="this.style.background='#73d13d'"
onmouseout="this.style.background='#52c41a'"
>Monitor</button>
</div>
</div>`;
},
},
},
layout: {
type: 'grid',
cols: 2,
},
behaviors: ['drag-element', 'zoom-canvas'],
});
// Global functions to handle button clicks
window.handleRestart = (nodeId) => {
console.log(`Restarting server: ${nodeId}`);
alert(`Restarting server ${nodeId}...`);
};
window.handleMonitor = (nodeId) => {
console.log(`Opening monitoring panel: ${nodeId}`);
alert(`Opening monitoring panel for server ${nodeId}`);
};
graph.render();
```
### Form Input HTML Node
```js | ob { inject: true }
import { Graph } from '@antv/g6';
const graph = new Graph({
container: 'container',
data: {
nodes: [
{ id: 'form-1', data: { title: 'User Information', type: 'user-form' } },
{ id: 'form-2', data: { title: 'Configuration Panel', type: 'config-form' } },
],
},
node: {
type: 'html',
style: {
size: [300, 400],
dx: -150,
dy: -200,
innerHTML: (d) => {
const { data } = d;
return `
<div style="
width: 100%;
height: 100%;
background: #fff;
border: 1px solid #d9d9d9;
border-radius: 8px;
padding: 20px;
box-shadow: 0 2px 8px rgba(0,0,0,0.1);
font-family: -apple-system, BlinkMacSystemFont, 'Segoe UI', Roboto, sans-serif;
">
<h3 style="margin: 0 0 16px 0; color: #333; font-size: 16px;">${data.title}</h3>
<div style="margin-bottom: 12px;">
<label style="display: block; margin-bottom: 4px; font-size: 14px; color: #666;">Name</label>
<input
type="text"
placeholder="Enter name"
style="
width: 100%;
padding: 8px 12px;
border: 1px solid #d9d9d9;
border-radius: 4px;
font-size: 14px;
box-sizing: border-box;
"
/>
</div>
<div style="margin-bottom: 12px;">
<label style="display: block; margin-bottom: 4px; font-size: 14px; color: #666;">Email</label>
<input
type="email"
placeholder="Enter email"
style="
width: 100%;
padding: 8px 12px;
border: 1px solid #d9d9d9;
border-radius: 4px;
font-size: 14px;
box-sizing: border-box;
"
/>
</div>
<div style="margin-bottom: 16px;">
<label style="display: block; margin-bottom: 4px; font-size: 14px; color: #666;">Role</label>
<select style="
width: 100%;
padding: 8px 12px;
border: 1px solid #d9d9d9;
border-radius: 4px;
font-size: 14px;
box-sizing: border-box;
">
<option>Administrator</option>
<option>User</option>
<option>Guest</option>
</select>
</div>
<div style="display: flex; gap: 8px;">
<button
onclick="handleSave('${d.id}')"
style="
flex: 1;
padding: 8px 16px;
background: #1890ff;
color: white;
border: none;
border-radius: 4px;
font-size: 14px;
cursor: pointer;
"
>Save</button>
<button
onclick="handleCancel('${d.id}')"
style="
flex: 1;
padding: 8px 16px;
background: #f5f5f5;
color: #333;
border: 1px solid #d9d9d9;
border-radius: 4px;
font-size: 14px;
cursor: pointer;
"
>Cancel</button>
</div>
</div>`;
},
},
},
layout: {
type: 'grid',
cols: 2,
},
behaviors: ['drag-element', 'zoom-canvas'],
});
// Global functions to handle form operations
window.handleSave = (nodeId) => {
console.log(`Saving form: ${nodeId}`);
alert(`Form ${nodeId} saved`);
};
window.handleCancel = (nodeId) => {
console.log(`Canceling form: ${nodeId}`);
alert(`Form ${nodeId} operation canceled`);
};
graph.render();
```
## Usage Notes
### 1. Performance Optimization
- HTML nodes have higher rendering costs compared to regular graphic nodes, recommend using when node count is small
- Complex HTML structures will affect performance, recommend keeping structure simple
- Avoid using too many animation effects in HTML
### 2. Event Handling
- Event handling in HTML nodes needs to be implemented through global functions or event delegation
- Recommend mounting event handling functions to the `window` object to ensure accessibility in HTML strings
- Be careful to prevent event bubbling from affecting graph interaction behavior
### 3. Style Isolation
- HTML node styles may be affected by global page styles
- Recommend using inline styles or ensuring sufficient style specificity
- Consider using CSS-in-JS or style namespaces to avoid style conflicts
### 4. Responsive Design
- HTML node dimensions are fixed and do not automatically adapt to content
- Need to dynamically calculate node dimensions based on content or use responsive layouts
- Consider display effects at different zoom levels
### 5. Framework Integration Recommendations
- **React Projects**: Recommended to use [React Node](/en/manual/element/node/react-node), which allows direct use of React components as node content
- **Vue Projects**: Vue Node is not currently supported, community contributions are welcome if needed
- **Native Projects**: HTML nodes are the best choice, providing maximum flexibility
Node Skill
packages/site/docs/manual/element/node/Html.zh.md anthropic-skill ~2,564 tokens---
title: HTML节点 Html
order: 7
---
## 概述
HTML 节点是一个自定义的矩形区域,用于显示 HTML 内容。它允许您在图形节点中嵌入任意的 HTML 元素,提供了极大的灵活性来创建复杂的自定义节点。
适用场景:
- 用于表示复杂的自定义节点,如表格、图表或富文本
- 适合表示自定义的可视化元素或交互组件
- 常用于自定义图表、UI 设计、仪表板等场景
- 需要在节点中嵌入表单、按钮等交互元素时
## 框架支持说明
> **💡 提示**:
>
> - **React 项目**:推荐使用 [React Node](/manual/element/node/react-node) 来实现更好的组件化开发体验
> - **Vue 项目**:目前暂不支持 Vue Node,欢迎社区共建贡献
> - **原生 HTML**:本文档介绍的 HTML 节点适用于原生 HTML 开发
## 在线体验
<embed src="@/common/api/elements/nodes/html.md"></embed>
## 样式配置
> 如果元素有其特定的属性,我们将在下面列出。对于所有的通用样式属性,见 [BaseNode](/manual/element/node/base-node)
| 属性 | 描述 | 类型 | 默认值 | 必选 |
| --------- | --------------------------------------------------------------- | --------------------------- | ------ | ---- |
| dx | 横行偏移量。HTML 容器默认以左上角为原点,通过 dx 来进行横向偏移 | number | 0 | |
| dy | 纵向偏移量。HTML 容器默认以左上角为原点,通过 dy 来进行纵向偏移 | number | 0 | |
| innerHTML | HTML 内容,可以为字符串或者 `HTMLElement` | string | `HTMLElement` | - | ✓ |
## 示例
### 基础HTML节点
```js | ob { inject: true }
import { Graph } from '@antv/g6';
const graph = new Graph({
container: 'container',
data: {
nodes: [
{ id: 'node-1', data: { location: 'East', status: 'error', ip: '192.168.1.2' } },
{ id: 'node-2', data: { location: 'West', status: 'overload', ip: '192.168.1.3' } },
{ id: 'node-3', data: { location: 'South', status: 'running', ip: '192.168.1.4' } },
],
},
node: {
type: 'html',
style: {
size: [240, 80],
dx: -120,
dy: -40,
innerHTML: (d) => {
const ICON_MAP = {
error: '❌',
overload: '⚡',
running: '✅',
};
const COLOR_MAP = {
error: '#f5222d',
overload: '#faad14',
running: '#52c41a',
};
const {
data: { location, status, ip },
} = d;
const color = COLOR_MAP[status];
return `
<div
style="
width:100%;
height: 100%;
background: ${color}bb;
border: 1px solid ${color};
color: #fff;
user-select: none;
display: flex;
padding: 10px;
border-radius: 8px;
"
>
<div style="display: flex;flex-direction: column;flex: 1;">
<div style="font-weight: bold; font-size: 14px;">
${location} Node
</div>
<div style="font-size: 12px; margin-top: 4px;">
status: ${status} ${ICON_MAP[status]}
</div>
</div>
<div>
<span style="border: 1px solid white; padding: 2px 6px; border-radius: 4px; font-size: 12px;">
${ip}
</span>
</div>
</div>`;
},
},
},
layout: {
type: 'grid',
},
behaviors: ['drag-element', 'zoom-canvas'],
});
graph.render();
```
### 带交互按钮的HTML节点
```js | ob { inject: true }
import { Graph } from '@antv/g6';
const graph = new Graph({
container: 'container',
data: {
nodes: [
{ id: 'server-1', data: { name: 'Web Server', cpu: 45, memory: 67, status: 'online' } },
{ id: 'server-2', data: { name: 'Database', cpu: 78, memory: 89, status: 'warning' } },
{ id: 'server-3', data: { name: 'Cache Server', cpu: 23, memory: 34, status: 'offline' } },
],
},
node: {
type: 'html',
style: {
size: [280, 210],
dx: -140,
dy: -105,
innerHTML: (d) => {
const { data } = d;
const statusColors = {
online: '#52c41a',
warning: '#faad14',
offline: '#f5222d',
};
return `
<div style="
width: 100%;
height: 100%;
background: #fff;
border: 2px solid ${statusColors[data.status]};
border-radius: 12px;
padding: 16px;
box-shadow: 0 4px 12px rgba(0,0,0,0.1);
font-family: -apple-system, BlinkMacSystemFont, 'Segoe UI', Roboto, sans-serif;
">
<div style="display: flex; justify-content: space-between; align-items: center; margin-bottom: 12px;">
<h3 style="margin: 0; font-size: 16px; color: #333;">${data.name}</h3>
<span style="
background: ${statusColors[data.status]};
color: white;
padding: 2px 8px;
border-radius: 12px;
font-size: 12px;
font-weight: bold;
">${data.status.toUpperCase()}</span>
</div>
<div style="margin-bottom: 12px;">
<div style="display: flex; justify-content: space-between; margin-bottom: 4px;">
<span style="font-size: 12px; color: #666;">CPU</span>
<span style="font-size: 12px; color: #333;">${data.cpu}%</span>
</div>
<div style="background: #f0f0f0; height: 6px; border-radius: 3px; overflow: hidden;">
<div style="background: ${data.cpu > 70 ? '#f5222d' : '#52c41a'}; height: 100%; width: ${data.cpu}%; transition: width 0.3s;"></div>
</div>
</div>
<div style="margin-bottom: 12px;">
<div style="display: flex; justify-content: space-between; margin-bottom: 4px;">
<span style="font-size: 12px; color: #666;">Memory</span>
<span style="font-size: 12px; color: #333;">${data.memory}%</span>
</div>
<div style="background: #f0f0f0; height: 6px; border-radius: 3px; overflow: hidden;">
<div style="background: ${data.memory > 80 ? '#f5222d' : '#1890ff'}; height: 100%; width: ${data.memory}%; transition: width 0.3s;"></div>
</div>
</div>
<div style="display: flex; gap: 8px;">
<button
onclick="handleRestart('${d.id}')"
style="
flex: 1;
padding: 6px 12px;
background: #1890ff;
color: white;
border: none;
border-radius: 6px;
font-size: 12px;
cursor: pointer;
transition: background 0.2s;
"
onmouseover="this.style.background='#40a9ff'"
onmouseout="this.style.background='#1890ff'"
>重启</button>
<button
onclick="handleMonitor('${d.id}')"
style="
flex: 1;
padding: 6px 12px;
background: #52c41a;
color: white;
border: none;
border-radius: 6px;
font-size: 12px;
cursor: pointer;
transition: background 0.2s;
"
onmouseover="this.style.background='#73d13d'"
onmouseout="this.style.background='#52c41a'"
>监控</button>
</div>
</div>`;
},
},
},
layout: {
type: 'grid',
cols: 2,
},
behaviors: ['drag-element', 'zoom-canvas'],
});
// 全局函数处理按钮点击
window.handleRestart = (nodeId) => {
console.log(`重启服务器: ${nodeId}`);
alert(`正在重启服务器 ${nodeId}...`);
};
window.handleMonitor = (nodeId) => {
console.log(`打开监控面板: ${nodeId}`);
alert(`打开服务器 ${nodeId} 的监控面板`);
};
graph.render();
```
### 表单输入HTML节点
```js | ob { inject: true }
import { Graph } from '@antv/g6';
const graph = new Graph({
container: 'container',
data: {
nodes: [
{ id: 'form-1', data: { title: '用户信息', type: 'user-form' } },
{ id: 'form-2', data: { title: '配置面板', type: 'config-form' } },
],
},
node: {
type: 'html',
style: {
size: [300, 400],
dx: -150,
dy: -200,
innerHTML: (d) => {
const { data } = d;
return `
<div style="
width: 100%;
height: 100%;
background: #fff;
border: 1px solid #d9d9d9;
border-radius: 8px;
padding: 20px;
box-shadow: 0 2px 8px rgba(0,0,0,0.1);
font-family: -apple-system, BlinkMacSystemFont, 'Segoe UI', Roboto, sans-serif;
">
<h3 style="margin: 0 0 16px 0; color: #333; font-size: 16px;">${data.title}</h3>
<div style="margin-bottom: 12px;">
<label style="display: block; margin-bottom: 4px; font-size: 14px; color: #666;">姓名</label>
<input
type="text"
placeholder="请输入姓名"
style="
width: 100%;
padding: 8px 12px;
border: 1px solid #d9d9d9;
border-radius: 4px;
font-size: 14px;
box-sizing: border-box;
"
/>
</div>
<div style="margin-bottom: 12px;">
<label style="display: block; margin-bottom: 4px; font-size: 14px; color: #666;">邮箱</label>
<input
type="email"
placeholder="请输入邮箱"
style="
width: 100%;
padding: 8px 12px;
border: 1px solid #d9d9d9;
border-radius: 4px;
font-size: 14px;
box-sizing: border-box;
"
/>
</div>
<div style="margin-bottom: 16px;">
<label style="display: block; margin-bottom: 4px; font-size: 14px; color: #666;">角色</label>
<select style="
width: 100%;
padding: 8px 12px;
border: 1px solid #d9d9d9;
border-radius: 4px;
font-size: 14px;
box-sizing: border-box;
">
<option>管理员</option>
<option>用户</option>
<option>访客</option>
</select>
</div>
<div style="display: flex; gap: 8px;">
<button
onclick="handleSave('${d.id}')"
style="
flex: 1;
padding: 8px 16px;
background: #1890ff;
color: white;
border: none;
border-radius: 4px;
font-size: 14px;
cursor: pointer;
"
>保存</button>
<button
onclick="handleCancel('${d.id}')"
style="
flex: 1;
padding: 8px 16px;
background: #f5f5f5;
color: #333;
border: 1px solid #d9d9d9;
border-radius: 4px;
font-size: 14px;
cursor: pointer;
"
>取消</button>
</div>
</div>`;
},
},
},
layout: {
type: 'grid',
cols: 2,
},
behaviors: ['drag-element', 'zoom-canvas'],
});
// 全局函数处理表单操作
window.handleSave = (nodeId) => {
console.log(`保存表单: ${nodeId}`);
alert(`表单 ${nodeId} 已保存`);
};
window.handleCancel = (nodeId) => {
console.log(`取消表单: ${nodeId}`);
alert(`取消表单 ${nodeId} 操作`);
};
graph.render();
```
## 使用注意事项
### 1. 性能优化
- HTML 节点相比普通图形节点有更高的渲染成本,建议在节点数量较少时使用
- 复杂的 HTML 结构会影响性能,建议保持结构简洁
- 避免在 HTML 中使用过多的动画效果
### 2. 事件处理
- HTML 节点中的事件处理需要通过全局函数或事件委托来实现
- 建议将事件处理函数挂载到 `window` 对象上,确保在 HTML 字符串中可以访问
- 注意防止事件冒泡影响图的交互行为
### 3. 样式隔离
- HTML 节点的样式可能会受到页面全局样式的影响
- 建议使用内联样式或确保样式的特异性足够高
- 考虑使用 CSS-in-JS 或样式命名空间来避免样式冲突
### 4. 响应式设计
- HTML 节点的尺寸是固定的,不会自动适应内容
- 需要根据内容动态计算节点尺寸,或使用响应式布局
- 考虑在不同缩放级别下的显示效果
### 5. 框架集成建议
- **React 项目**:推荐使用 [React Node](/manual/element/node/react-node),可以直接使用 React 组件作为节点内容
- **Vue 项目**:目前暂不支持 Vue Node,如有需求欢迎社区贡献
- **原生项目**:HTML 节点是最佳选择,提供了最大的灵活性
Node Skill
packages/site/docs/manual/element/node/Image.en.md anthropic-skill ~700 tokens---
title: Image Node
order: 8
---
## Overview
The image node is a rectangular area used to display images.
Applicable scenarios:
- Used to represent user avatars, product images, or icons.
- Suitable for representing social networks, product catalogs, or icon collections.
- Commonly used in social network graphs, product images, UI design, etc.
## Online Experience
<embed src="@/common/api/elements/nodes/image.md"></embed>
## Style Configuration
> If the element has specific attributes, we will list them below. For all general style attributes, see [BaseNode](/en/manual/element/node/base-node)
| Attribute | Description | Type | Default | Required |
| --------- | ------------------------------------ | ------ | ------- | -------- |
| img | Alias for the img attribute | string | - | |
| src | Image source, i.e., image URL string | string | - | ✓ |
## Example
### Built-in Image Node Effect
```js | ob { inject: true }
import { Graph, iconfont } from '@antv/g6';
const style = document.createElement('style');
style.innerHTML = `@import url('${iconfont.css}');`;
document.head.appendChild(style);
const data = {
nodes: [
{ id: 'default' },
{ id: 'halo' },
{ id: 'badges' },
{ id: 'ports' },
{
id: 'active',
states: ['active'],
},
{
id: 'selected',
states: ['selected'],
},
{
id: 'highlight',
states: ['highlight'],
},
{
id: 'inactive',
states: ['inactive'],
},
{
id: 'disabled',
states: ['disabled'],
},
],
};
const graph = new Graph({
container: 'container',
data,
node: {
type: 'image',
style: {
size: 40,
labelText: (d) => d.id,
src: 'https://gw.alipayobjects.com/mdn/rms_6ae20b/afts/img/A*N4ZMS7gHsUIAAAAAAAAAAABkARQnAQ',
haloStroke: '#227eff',
halo: (d) => (d.id === 'halo' ? true : false),
badges: (d) =>
d.id === 'badges'
? [
{
text: 'A',
placement: 'right-top',
},
{
text: 'Important',
placement: 'right',
},
{
text: 'Notice',
placement: 'right-bottom',
},
]
: [],
badgeFontSize: 8,
badgePadding: [1, 4],
portR: 3,
ports: (d) =>
d.id === 'ports'
? [{ placement: 'left' }, { placement: 'right' }, { placement: 'top' }, { placement: 'bottom' }]
: [],
},
state: {
inactive: {
fillOpacity: 0.5,
},
disabled: {
fillOpacity: 0.2,
},
},
},
layout: {
type: 'grid',
},
});
graph.render();
```
Node Skill
packages/site/docs/manual/element/node/Image.zh.md anthropic-skill ~588 tokens---
title: 图片节点 Image
order: 8
---
## 概述
图片节点是一个矩形区域,用于显示图像。
适用场景:
- 用于表示用户头像、产品图片或图标。
- 适合表示社交网络、产品目录或图标集合。
- 常用于社交网络图、产品图、UI 设计等。
## 在线体验
<embed src="@/common/api/elements/nodes/image.md"></embed>
## 样式配置
> 如果元素有其特定的属性,我们将在下面列出。对于所有的通用样式属性,见 [BaseNode](/manual/element/node/base-node)
| 属性 | 描述 | 类型 | 默认值 | 必选 |
| ---- | -------------------------- | ------ | ------ | ---- |
| img | 该属性为 img 的别名 | string | - | |
| src | 图片来源,即图片地址字符串 | string | - | ✓ |
## 示例
### 内置图片节点效果
```js | ob { inject: true }
import { Graph, iconfont } from '@antv/g6';
const style = document.createElement('style');
style.innerHTML = `@import url('${iconfont.css}');`;
document.head.appendChild(style);
const data = {
nodes: [
{ id: 'default' },
{ id: 'halo' },
{ id: 'badges' },
{ id: 'ports' },
{
id: 'active',
states: ['active'],
},
{
id: 'selected',
states: ['selected'],
},
{
id: 'highlight',
states: ['highlight'],
},
{
id: 'inactive',
states: ['inactive'],
},
{
id: 'disabled',
states: ['disabled'],
},
],
};
const graph = new Graph({
container: 'container',
data,
node: {
type: 'image',
style: {
size: 40,
labelText: (d) => d.id,
src: 'https://gw.alipayobjects.com/mdn/rms_6ae20b/afts/img/A*N4ZMS7gHsUIAAAAAAAAAAABkARQnAQ',
haloStroke: '#227eff',
halo: (d) => (d.id === 'halo' ? true : false),
badges: (d) =>
d.id === 'badges'
? [
{
text: 'A',
placement: 'right-top',
},
{
text: 'Important',
placement: 'right',
},
{
text: 'Notice',
placement: 'right-bottom',
},
]
: [],
badgeFontSize: 8,
badgePadding: [1, 4],
portR: 3,
ports: (d) =>
d.id === 'ports'
? [{ placement: 'left' }, { placement: 'right' }, { placement: 'top' }, { placement: 'bottom' }]
: [],
},
state: {
inactive: {
fillOpacity: 0.5,
},
disabled: {
fillOpacity: 0.2,
},
},
},
layout: {
type: 'grid',
},
});
graph.render();
```
Node Skill
packages/site/docs/manual/element/node/overview.en.md anthropic-skill ~2,146 tokens---
title: Node Overview
order: 0
---
## What is a Node
A node is one of the basic elements in a graph, representing an entity or an abstract concept, such as a person, a place, an organization, etc. Nodes can contain attributes like ID, name, type, etc. In G6, nodes can have various shapes and styles, and support rich interactions and customization.
You can create any number of nodes in a graph and connect them with edges to represent relationships.
## Node System
The G6 node system includes three main categories: built-in nodes, extended nodes, and custom nodes. **In most cases, built-in nodes are sufficient.**
### Built-in Nodes
G6 provides a variety of built-in node types, **which can be used directly without registration**:
<image width="300" src="https://mdn.alipayobjects.com/huamei_qa8qxu/afts/img/A*TZt2S7Z0d-8AAAAAAAAAAAAADmJ7AQ/original" />
| Node Type | Registration Name | Description |
| -------------- | ----------------- | ----------------------------------------------- |
| Circle Node | `circle` | Commonly used for entities |
| Rectangle Node | `rect` | Suitable for more text and details |
| Ellipse Node | `ellipse` | A variant of the circle |
| Diamond Node | `diamond` | Often used for decision points or special nodes |
| Triangle Node | `triangle` | Can indicate direction or special marks |
| Hexagon Node | `hexagon` | Suitable for grid layouts and honeycomb charts |
| Star Node | `star` | Highlights important nodes |
| Donut Node | `donut` | Can display proportions or progress |
| Image Node | `image` | Uses an image as the node body |
| HTML Node | `html` | Supports custom HTML content |
### 3D Nodes
<image width="200" src="https://mdn.alipayobjects.com/huamei_qa8qxu/afts/img/A*ShNXTp0u3vkAAAAAAAAAAAAADmJ7AQ/original" />
`@antv/g6-extension-3d` provides 3D nodes:
- `Capsule` - Capsule-shaped node
- `Cone` - Cone-shaped node
- `Cube` - Cube-shaped node
- `Cylinder` - Cylinder-shaped node
- `Plane` - Plane node
- `Sphere` - Sphere node
- `Torus` - Torus node
### React Nodes
<image width="350" src="https://mdn.alipayobjects.com/huamei_qa8qxu/afts/img/A*7jypQbkp00wAAAAAAAAAAAAADmJ7AQ/original" />
`@antv/g6-extension-react` provides React nodes, supporting the use of React components as the node body. For detailed tutorials, please refer to the [Using React to Define Nodes](/en/manual/element/node/react-node) document.
### Custom Nodes
When built-in and extended nodes cannot meet the requirements, G6 offers powerful customization capabilities:
- Extend built-in nodes
- Create entirely new node types
Unlike built-in nodes, **custom nodes need to be registered before use**. For detailed tutorials, please refer to the [Custom Nodes](/en/manual/element/node/custom-node) document.
## Data Structure
When defining nodes, you need to add a `nodes` field to the graph's data object. Each node is an object with the following structure:
| Property | Description | Type | Default | Required |
| -------- | --------------------------------------------------------------------------------------------------------------------------------------- | -------------- | ------- | -------- |
| id | Unique identifier for the node, used to distinguish different nodes | string | - | ✓ |
| type | Node type, either a built-in node type name or a custom node name | string | - | |
| data | Node data, used to store custom data such as the node's name, description, etc. Can be accessed via callback functions in style mapping | object | - | |
| style | Node style, including visual attributes like position, size, color, etc. | object | - | |
| states | Initial states of the node, such as selected, active, hover, etc. | string[] | - | |
| combo | The ID of the combo to which the node belongs, used to organize hierarchical relationships. If none, it is null | string \| null | - | |
| children | Collection of child node IDs, used only in tree graph scenarios | string[] | - | |
An example of a data item in the `nodes` array:
```json
{
"id": "node-1",
"type": "circle",
"data": { "name": "alice", "role": "Admin" },
"style": { "x": 100, "y": 200, "size": 32, "fill": "violet" },
"states": ["selected"],
"combo": null
}
```
## Configuration Methods
There are three ways to configure nodes, listed in order of priority from high to low:
- Use `graph.setNode()` for dynamic configuration
- Global configuration during graph instantiation
- Dynamic properties in data
These configuration methods can be used simultaneously. When there are identical configuration items, the method with higher priority will override the one with lower priority.
### Using `graph.setNode()`
After creating the graph instance, you can use `graph.setNode()` to dynamically set the node's style mapping logic.
This method must be called before `graph.render()` to take effect and has the highest priority.
```js
graph.setNode({
style: {
type: 'circle',
style: { size: 60, fill: '#7FFFD4', stroke: '#5CACEE', lineWidth: 2 },
},
});
graph.render();
```
### Global Configuration During Graph Instantiation
When instantiating the graph, you can configure node style mapping through `node`, which is a global configuration and will apply to all nodes.
```js
import { Graph } from '@antv/g6';
const graph = new Graph({
node: {
type: 'circle',
style: { size: 60, fill: '#7FFFD4', stroke: '#5CACEE', lineWidth: 2 },
},
});
```
### Dynamic Configuration in Data
If you need different configurations for different nodes, you can write the configuration into the node data. This configuration method can be directly written into the data in the following form:
```typescript
const data = {
nodes: [
{
id: 'node-1',
type: 'circle',
style: { size: 60, fill: '#7FFFD4', stroke: '#5CACEE', lineWidth: 2 },
},
],
};
```
### Adjusting Priority
If you want the configuration in the data to have a higher priority than the global configuration, you can do so as follows:
```js
const data = {
nodes: [
{
id: 'node-1',
type: 'circle',
style: { size: 60, fill: '#7FFFD4', stroke: '#5CACEE', lineWidth: 2 },
},
],
};
const graph = new Graph({
node: {
type: 'circle',
style: {
stroke: (d) => d.style.stroke || '#5CACEE',
lineWidth: 2,
},
},
});
```
### Dynamically Updating Nodes
G6 supports dynamically updating the style and state of nodes at runtime:
```typescript
// Update the style of a single node
graph.updateNodeData([
{
id: 'node-1',
style: {
fill: 'red',
size: 80,
},
},
]);
graph.draw();
// Set node state
graph.setElementState('node-1', ['selected']);
```
:::warning{title=Note}
When updating nodes, only the specified attributes will be updated, and unspecified attributes will remain unchanged.
:::
For more node-related APIs, please refer to [API - Element Operations](/en/api/element).
## Node States
Nodes can have different states, such as selected, highlighted, disabled, etc. You can define the display effect of nodes in different states by configuring state styles:
```typescript
const graph = new Graph({
node: {
style: {
// Default style
fill: '#C6E5FF',
},
// State styles
state: {
selected: {
fill: '#ffa940',
stroke: '#ff7a00',
haloStroke: '#ff7a00',
},
highlight: {
stroke: '#1890ff',
lineWidth: 3,
},
},
},
});
```
The state system is the foundation for implementing node interaction effects. For more information on states, please refer to [Element States](/en/manual/element/state).
Node Skill
packages/site/docs/manual/element/node/overview.zh.md anthropic-skill ~1,283 tokens---
title: 节点总览
order: 0
---
## 什么是节点
节点(Node)是图中的基本元素之一,表示图中的实体或者抽象概念,例如一个人、一个地点、一个组织等,节点可以包含一些属性,例如节点的 ID、名称、类型等。在 G6 中,节点可以具有多种形状和样式,并支持丰富的交互和自定义功能。
你可以在图中创建任意数量的节点,并通过边连接它们以表示关系。
## 节点体系
G6 的节点体系包括三大类:内置节点、扩展节点和自定义节点。**大多数场景下,内置节点即可满足需求**。
### 内置节点
G6 提供了丰富的内置节点类型,**无需注册,直接配置即可使用**:
<image width="300" src="https://mdn.alipayobjects.com/huamei_qa8qxu/afts/img/A*TZt2S7Z0d-8AAAAAAAAAAAAADmJ7AQ/original" />
| 节点类型 | 注册名称 | 描述 |
| ---------- | ---------- | ------------------------ |
| 圆形节点 | `circle` | 常用于表示普通实体 |
| 矩形节点 | `rect` | 适合展示更多文本和细节 |
| 椭圆节点 | `ellipse` | 类似圆形的变体 |
| 菱形节点 | `diamond` | 常用于决策点或特殊节点 |
| 三角形节点 | `triangle` | 可用于指示方向或特殊标记 |
| 六边形节点 | `hexagon` | 适合网格布局和蜂窝图 |
| 星形节点 | `star` | 突出显示重要节点 |
| 甜甜圈节点 | `donut` | 可展示比例或进度信息 |
| 图片节点 | `image` | 使用图片作为节点主体 |
| HTML节点 | `html` | 支持自定义HTML内容 |
### 3D 节点
<image width="200" src="https://mdn.alipayobjects.com/huamei_qa8qxu/afts/img/A*ShNXTp0u3vkAAAAAAAAAAAAADmJ7AQ/original" />
`@antv/g6-extension-3d` 提供了 3D 节点:
- `Capsule` - 胶囊型节点
- `Cone` - 圆锥型节点
- `Cube` - 立方体节点
- `Cylinder` - 圆柱型节点
- `Plane` - 平面节点
- `Sphere` - 球体节点
- `Torus` - 圆环节点
### React 节点
<image width="350" src="https://mdn.alipayobjects.com/huamei_qa8qxu/afts/img/A*7jypQbkp00wAAAAAAAAAAAAADmJ7AQ/original" />
`@antv/g6-extension-react` 提供了 React 节点,支持使用 React 组件作为节点的主体,详细教程请查看 [使用 React 定义节点](/manual/element/node/react-node) 文档。
### 自定义节点
当内置节点和扩展节点无法满足需求时,G6提供了强大的自定义能力:
- 继承内置节点进行扩展
- 创建全新的节点类型
与内置节点不同,**自定义节点需要先注册后使用**。详细教程请参考 [自定义节点](/manual/element/node/custom-node) 文档。
## 数据结构
定义节点时,需要在图的数据对象中添加 `nodes` 字段。每个节点是一个对象,结构如下:
| 属性 | 描述 | 类型 | 默认值 | 必选 |
| -------- | -------------------------------------------------------------------------------------------- | -------------- | ------ | ---- |
| id | 节点的唯一标识符,用于区分不同的节点 | string | - | ✓ |
| type | 节点类型,内置节点类型名称或者自定义节点的名称 | string | - | |
| data | 节点数据,用于存储节点的自定义数据,例如节点的名称、描述等。可以在样式映射中通过回调函数获取 | object | - | |
| style | 节点样式,包括位置、大小、颜色等视觉属性 | object | - | |
| states | 节点初始状态,如选中、激活、悬停等 | string[] | - | |
| combo | 所属的组合 ID,用于组织节点的层级关系,如果没有则为 null | string \| null | - | |
| children | 子节点 ID 集合,仅在树图场景下使用 | string[] | - | |
`nodes` 数组中一个数据项的示例:
```json
{
"id": "node-1",
"type": "circle",
"data": { "name": "alice", "role": "Admin" },
"style": { "x": 100, "y": 200, "size": 32, "fill": "violet" },
"states": ["selected"],
"combo": null
}
```
## 配置方法
配置节点的方式有三种,按优先级从高到低如下:
- 使用 `graph.setNode()` 动态配置
- 实例化图时全局配置
- 在数据中动态属性
这几个配置方法可以同时使用。有相同的配置项时,优先级高的方式将会覆盖优先级低的。
### 使用 `graph.setNode()`
可在图实例创建后,使用 `graph.setNode()` 动态设置节点的样式映射逻辑。
该方法需要在 `graph.render()` 之前调用才会生效,并拥有最高优先级。
```js
graph.setNode({
style: {
type: 'circle',
style: { size: 60, fill: '#7FFFD4', stroke: '#5CACEE', lineWidth: 2 },
},
});
graph.render();
```
### 实例化图时全局配置
在实例化图时可以通过 `node` 配置节点样式映射,这里的配置是全局的配置,将会在所有节点上生效。
```js
import { Graph } from '@antv/g6';
const graph = new Graph({
node: {
type: 'circle',
style: { size: 60, fill: '#7FFFD4', stroke: '#5CACEE', lineWidth: 2 },
},
});
```
### 在数据中动态配置
如果需要为不同节点进行不同的配置,可以将配置写入到节点数据中。这种配置方式可以通过下面代码的形式直接写入数据:
```typescript
const data = {
nodes: [
{
id: 'node-1',
type: 'circle',
style: { size: 60, fill: '#7FFFD4', stroke: '#5CACEE', lineWidth: 2 },
},
],
};
```
### 调整优先级
如果你想让数据中配置的优先级高于全局配置,你可以采取以下方式:
```js
const data = {
nodes: [
{
id: 'node-1',
type: 'circle',
style: { size: 60, fill: '#7FFFD4', stroke: '#5CACEE', lineWidth: 2 },
},
],
};
const graph = new Graph({
node: {
type: 'circle',
style: {
stroke: (d) => d.style.stroke || '#5CACEE',
lineWidth: 2,
},
},
});
```
### 动态更新节点
G6 支持在运行时动态更新节点的样式和状态:
```typescript
// 更新单个节点样式
graph.updateNodeData([
{
id: 'node-1',
style: {
fill: 'red',
size: 80,
},
},
]);
graph.draw();
// 设置节点状态
graph.setElementState('node-1', ['selected']);
```
:::warning{title=注意}
更新节点时,只有指定的属性会被更新,未指定的属性保持不变。
:::
更多与节点相关的 API 请参考 [API - 元素操作](/api/element)。
## 节点状态
节点可以拥有不同的状态,例如选中、高亮、禁用等。可以通过配置状态样式来定义节点在不同状态下的显示效果:
```typescript
const graph = new Graph({
node: {
style: {
// 默认样式
fill: '#C6E5FF',
},
// 状态样式
state: {
selected: {
fill: '#ffa940',
stroke: '#ff7a00',
haloStroke: '#ff7a00',
},
highlight: {
stroke: '#1890ff',
lineWidth: 3,
},
},
},
});
```
状态系统是实现节点交互效果的基础,更多状态的介绍,请参考 [元素状态](/manual/element/state)。
Node Skill
packages/site/docs/manual/element/node/react-node.en.md anthropic-skill ~3,601 tokens---
title: Define Nodes with React
order: 13
---
In G6, custom nodes typically require manipulating DOM or Canvas elements, but with the help of the `@antv/g6-extension-react` ecosystem library, you can directly use React components as node content, enhancing development efficiency and maintainability.
## Choosing a Custom Node Solution
### G6 Node
<img src="https://mdn.alipayobjects.com/huamei_qa8qxu/afts/img/A*sEaLR7Q_hmoAAAAAAAAAAAAAemJ7AQ/fmt.avif" width="300" />
✅ **Recommended Scenarios:**
- Nodes are simple geometric shapes
- Scenarios requiring efficient rendering of more than 2,000 nodes
- Need to directly manipulate graphic instances for fine control
> For detailed information on how to customize nodes using Canvas graphics, please refer to the [Custom Node](/en/manual/element/node/custom-node) documentation
### React Node
<img src="https://mdn.alipayobjects.com/huamei_qa8qxu/afts/img/A*9oz-R7bIkd0AAAAAAAAAAAAADmJ7AQ/original" width="350" />
✅ **Recommended Scenarios:**
- Business systems that need to integrate UI libraries like Ant Design
- Nodes contain interactive logic such as form input, state switching
- Scenarios where an existing React design system needs to be reused
## Quick Start
### Environment Preparation
Before starting, please ensure you have:
- **Installed a React project**: Ensure a React project is installed and created.
- **React version requirement**: Ensure the React version used is >=16.8.0.
### Install Dependencies
To use `@antv/g6-extension-react`, run the following command:
:::code-group
```bash [npm]
npm install @antv/g6-extension-react
```
```bash [yarn]
yarn add @antv/g6-extension-react
```
```bash [pnpm]
pnpm add @antv/g6-extension-react
```
:::
### Component Integration
#### 1. Register React Node Type
Register the React node type through the extension mechanism:
```jsx
import { ExtensionCategory, register } from '@antv/g6';
import { ReactNode } from '@antv/g6-extension-react';
register(ExtensionCategory.NODE, 'react-node', ReactNode);
```
The `register` method requires three parameters:
- Extension category: `ExtensionCategory.NODE` indicates this is a node type
- Type name: `react-node` is the name we give to this custom node, which will be used in the configuration later
- Class definition: ReactNode is the implementation class exported by `@antv/g6-extension-react`
#### 2. Define Business Component
Define a simple React component as the content of the node:
```jsx
const MyReactNode = () => {
return <div>node</div>;
};
```
#### 3. Use the Component
Use the custom React node in the graph configuration. Specify the node type and style in the graph configuration to use the custom React component.
- `type`: Specify the node type as `react-node` (use the name given during registration)
- `style.component`: Define the React component content of the node
```jsx
const graph = new Graph({
node: {
type: 'react-node',
style: {
component: () => <MyReactNode />,
},
},
});
graph.render();
```
## Advanced Features
### State Management
In complex graph visualization scenarios, nodes need to dynamically respond to interaction states. We provide two complementary state management solutions:
#### Respond to Built-in Interaction States
G6 provides built-in interaction state management states, such as `hover-activate` and `click-select`. You can get the current node state through the `data.states` field in the node data and adjust the node style based on the state.
**Example**: Change the background color when the node is hovered.
```jsx
import { ExtensionCategory, register, Graph } from '@antv/g6';
import { ReactNode } from '@antv/g6-extension-react';
register(ExtensionCategory.NODE, 'react-node', ReactNode);
const StatefulNode = ({ data }) => {
const isActive = data.states?.includes('active');
return (
<div
style={{
width: 100,
padding: 5,
border: '1px solid #eee',
boxShadow: isActive ? '0 0 8px rgba(24,144,255,0.8)' : 'none',
transform: `scale(${isActive ? 1.05 : 1})`,
}}
>
{data.data.label}
</div>
);
};
const graph = new Graph({
data: {
nodes: [
{ id: 'node1', style: { x: 100, y: 200 }, data: { label: 'node1' } },
{ id: 'node2', style: { x: 300, y: 200 }, data: { label: 'node2' } },
],
},
node: {
type: 'react-node',
style: {
component: (data) => <StatefulNode data={data} />,
},
},
behaviors: ['hover-activate'],
});
graph.render();
```
#### Custom Business State
When you need to manage business-related states (such as approval status, risk level), you can extend node data to achieve this:
**Example**: Add a `selected` variable through data to achieve style changes for node selection and deselection.
```jsx
import { ExtensionCategory, register, Graph } from '@antv/g6';
import { ReactNode } from '@antv/g6-extension-react';
register(ExtensionCategory.NODE, 'react-node', ReactNode);
const MyReactNode = ({ data, graph }) => {
const handleClick = () => {
graph.updateNodeData([{ id: data.id, data: { selected: !data.data.selected } }]);
graph.draw();
};
return (
<div
style={{
width: 200,
padding: 10,
border: '1px solid red',
borderColor: data.data.selected ? 'orange' : '#ddd', // Set border color based on selection state
cursor: 'pointer', // Add mouse pointer style
}}
onClick={handleClick}
>
Node
</div>
);
};
const graph = new Graph({
data: {
nodes: [
{
id: 'node1',
style: { x: 100, y: 100 },
data: { selected: true },
},
],
},
node: {
type: 'react-node',
style: {
component: (data) => <MyReactNode data={data} graph={graph} />,
},
},
});
graph.render();
```
### Event Interaction
Achieve two-way communication between nodes and graph instances, allowing nodes and graph instances to update each other.
**Example**: Operate graph data through custom nodes and re-render the graph.
```jsx
const IDCardNode = ({ id, selected, graph }) => {
const handleSelect = () => {
graph.updateNodeData([{ id, data: { selected: true } }]);
graph.draw();
};
return <Select onChange={handleSelect} style={{ background: selected ? 'orange' : '#eee' }} />;
};
const graph = new Graph({
node: {
type: 'react-node',
style: {
component: ({ id, data }) => <IDCardNode id={id} selected={data.selected} graph={graph} />,
},
},
});
```
## Real Cases
```js | ob { inject: true }
import { DatabaseFilled } from '@ant-design/icons';
import { ExtensionCategory, Graph, register } from '@antv/g6';
import { ReactNode } from '@antv/g6-extension-react';
import { Badge, Flex, Input, Tag, Typography } from 'antd';
import { useEffect, useRef } from 'react';
import { createRoot } from 'react-dom/client';
const { Text } = Typography;
register(ExtensionCategory.NODE, 'react', ReactNode);
const Node = ({ data, onChange }) => {
const { status, type } = data.data;
return (
<Flex
style={{
width: '100%',
height: '100%',
background: '#fff',
padding: 10,
borderRadius: 5,
border: '1px solid gray',
}}
vertical
>
<Flex align="center" justify="space-between">
<Text>
<DatabaseFilled />
Server
<Tag>{type}</Tag>
</Text>
<Badge status={status} />
</Flex>
<Text type="secondary">{data.id}</Text>
<Flex align="center">
<Text style={{ flexShrink: 0 }}>
<Text type="danger">*</Text>URL:
</Text>
<Input
style={{ borderRadius: 0, borderBottom: '1px solid #d9d9d9' }}
variant="borderless"
value={data.data?.url}
onChange={(event) => {
const url = event.target.value;
onChange?.(url);
}}
/>
</Flex>
</Flex>
);
};
export const ReactNodeDemo = () => {
const containerRef = useRef();
useEffect(() => {
const graph = new Graph({
container: containerRef.current,
data: {
nodes: [
{
id: 'local-server-1',
data: { status: 'success', type: 'local', url: 'http://localhost:3000' },
style: { x: 50, y: 50 },
},
{
id: 'remote-server-1',
data: { status: 'warning', type: 'remote' },
style: { x: 350, y: 50 },
},
],
edges: [{ source: 'local-server-1', target: 'remote-server-1' }],
},
node: {
type: 'react',
style: {
size: [240, 100],
component: (data) => <Node data={data} />,
},
},
behaviors: ['drag-element', 'zoom-canvas', 'drag-canvas'],
});
graph.render();
}, []);
return <div style={{ width: '100%', height: '100%' }} ref={containerRef}></div>;
};
const root = createRoot(document.getElementById('container'));
root.render(<ReactNodeDemo />);
```
<br/>
```js | ob { inject: true }
import { UserOutlined } from '@ant-design/icons';
import { ExtensionCategory, Graph, register } from '@antv/g6';
import { ReactNode } from '@antv/g6-extension-react';
import { Avatar, Button, Card, Descriptions, Select, Space, Typography } from 'antd';
import React, { useEffect, useRef } from 'react';
import { createRoot } from 'react-dom/client';
const { Title, Text } = Typography;
const { Option } = Select;
register(ExtensionCategory.NODE, 'react-node', ReactNode);
const IDCardNode = ({ id, data }) => {
const { name, idNumber, address, expanded, selected, graph } = data;
const toggleExpand = (e) => {
e.stopPropagation();
graph.updateNodeData([
{
id,
data: { expanded: !expanded },
},
]);
graph.render();
};
const handleSelect = (value) => {
graph.updateNodeData([
{
id,
data: { selected: value !== 0 },
},
]);
if (value === 2) {
// 获取与当前节点相连的所有节点
const connectedNodes = graph.getNeighborNodesData(id);
connectedNodes.forEach((node) => {
graph.updateNodeData([
{
id: node.id,
data: { selected: true },
},
]);
});
}
graph.render();
};
const CardTitle = (
<div style={{ display: 'flex', justifyContent: 'space-between', alignItems: 'center' }}>
<Space>
<Avatar shape="square" size="small" icon={<UserOutlined />} />
<Title level={5} style={{ margin: 0 }}>
{name}
</Title>
<Select
value={selected ? data.selectedOption || 1 : 0}
style={{ width: 150, marginRight: 8 }}
onChange={handleSelect}
>
<Option value={0}>None</Option>
<Option value={1}>Node</Option>
<Option value={2}>Connected</Option>
</Select>
</Space>
<Button type="link" onClick={toggleExpand} style={{ padding: 0 }}>
{expanded ? 'fold' : 'expand'}
</Button>
</div>
);
return (
<Card
size="small"
title={CardTitle}
style={{
width: 340,
padding: 10,
borderRadius: 8,
borderWidth: 2,
borderColor: selected ? 'orange' : '#eee', // 根据选中状态设置边框颜色
cursor: 'pointer',
}}
>
{expanded ? (
<Descriptions bordered column={1} style={{ width: '100%', textAlign: 'center' }}>
<Descriptions.Item label="ID Number">{idNumber}</Descriptions.Item>
<Descriptions.Item label="Address">{address}</Descriptions.Item>
</Descriptions>
) : (
<Text style={{ textAlign: 'center' }}>IDCard Information</Text>
)}
</Card>
);
};
// 定义 Graph 数据
const data = {
nodes: [
{
id: 'node1',
data: {
name: 'Alice',
idNumber: 'IDUSAASD2131734',
address: '1234 Broadway, Apt 5B, New York, NY 10001',
expanded: false, // 初始状态为收缩
selected: false, // 初始状态为未选中
selectedOption: 1, // 初始选择本节点
},
style: { x: 50, y: 50 },
},
{
id: 'node2',
data: {
name: 'Bob',
idNumber: 'IDUSAASD1431920',
address: '3030 Chestnut St, Philadelphia, PA 19104',
expanded: false, // 初始状态为收缩
selected: false, // 初始状态为未选中
selectedOption: 0, // 初始不选择
},
style: { x: 700, y: 100 },
},
{
id: 'node3',
data: {
name: 'Charlie',
idNumber: 'IDUSAASD1431921',
address: '4040 Elm St, Chicago, IL 60611',
expanded: false,
selected: true,
selectedOption: 0,
},
},
{
id: 'node4',
data: {
name: 'David',
idNumber: 'IDUSAASD1431922',
address: '5050 Oak St, Houston, TX 77002',
expanded: false,
selected: false,
selectedOption: 0,
},
},
{
id: 'node5',
data: {
name: 'Eve',
idNumber: 'IDUSAASD1431923',
address: '6060 Pine St, Phoenix, AZ 85001',
expanded: false,
selected: false,
selectedOption: 0,
},
},
],
edges: [
{ source: 'node1', target: 'node2' },
{ source: 'node2', target: 'node3' },
{ source: 'node3', target: 'node4' },
{ source: 'node4', target: 'node5' },
],
};
export const ReactNodeDemo = () => {
const containerRef = useRef();
const graphRef = useRef(null);
useEffect(() => {
// 创建 Graph 实例
const graph = new Graph({
autoFit: 'view',
container: containerRef.current,
data,
node: {
type: 'react-node',
style: {
size: (datum) => (datum.data.expanded ? [340, 236] : [340, 105]), // 调整大小以适应内容
component: (data) => <IDCardNode id={data.id} data={{ ...data.data, graph: graph }} />,
},
},
behaviors: ['drag-element', 'zoom-canvas', 'drag-canvas'],
layout: {
type: 'snake',
cols: 2,
rowGap: 100,
colGap: 220,
},
});
// 渲染 Graph
graph.render();
// 保存 graph 实例
graphRef.current = graph;
return () => {
graph.destroy();
};
}, []);
return <div style={{ width: '100%', height: '100%' }} ref={containerRef}></div>;
};
// 渲染 React 组件到 DOM
const root = createRoot(document.getElementById('container'));
root.render(<ReactNodeDemo />);
```
Node Skill
packages/site/docs/manual/element/node/react-node.zh.md anthropic-skill ~3,124 tokens---
title: 使用 React 定义节点
order: 13
---
在 G6 中,自定义节点通常需要操作 DOM 或 Canvas 元素,但借助 `@antv/g6-extension-react` 一方生态库,可以直接使用 React 组件作为节点内容,提升开发效率与可维护性。
## 自定义节点方案选择
### G6 节点
<img src="https://mdn.alipayobjects.com/huamei_qa8qxu/afts/img/A*sEaLR7Q_hmoAAAAAAAAAAAAAemJ7AQ/fmt.avif" width="300" />
✅ **推荐场景:**
- 节点只是简单的几何图形
- 需要高效渲染超过 2,000 个节点的场景
- 需要直接操作图形实例进行精细控制
> 有关如何使用 Canvas 图形自定义节点的详细信息,请参阅 [自定义节点](/manual/element/node/custom-node) 文档
### React Node
<img src="https://mdn.alipayobjects.com/huamei_qa8qxu/afts/img/A*9oz-R7bIkd0AAAAAAAAAAAAADmJ7AQ/original" width="350" />
✅ **推荐场景:**
- 需要集成 Ant Design 等 UI 库的业务系统
- 节点包含表单输入、状态切换等交互逻辑
- 已有 React 设计系统需要复用的场景
## 快速入门
### 环境准备
在开始之前,请确保您已经:
- **安装 React 项目**:确保已安装并创建 React 项目。
- **React 版本要求**:确保使用的 React 版本 >=16.8.0。
### 安装依赖
要使用 `@antv/g6-extension-react`,请运行以下命令:
:::code-group
```bash [npm]
npm install @antv/g6-extension-react
```
```bash [yarn]
yarn add @antv/g6-extension-react
```
```bash [pnpm]
pnpm add @antv/g6-extension-react
```
:::
### 组件集成
#### 1. 注册 React 节点类型
通过扩展机制注册 React 节点类型:
```jsx
import { ExtensionCategory, register } from '@antv/g6';
import { ReactNode } from '@antv/g6-extension-react';
register(ExtensionCategory.NODE, 'react-node', ReactNode);
```
`register` 方法需要三个参数:
- 扩展类别:`ExtensionCategory.NODE` 表示这是一个节点类型
- 类型名称:`react-node` 是我们给这个自定义节点起的名字,后续会在配置中使用
- 类定义:ReactNode 是 `@antv/g6-extension-react` 导出的实现类
#### 2. 定义业务组件
定义一个简单的 React 组件作为节点的内容:
```jsx
const MyReactNode = () => {
return <div>node</div>;
};
```
#### 3. 使用组件
在图配置中使用自定义的 React 节点。通过在图配置中指定节点类型和样式,来使用自定义的 React 组件。
- `type`:指定节点类型为 `react-node` (使用与注册时起的名字)
- `style.component`:定义节点的 React 组件内容
```jsx
const graph = new Graph({
node: {
type: 'react-node',
style: {
component: () => <MyReactNode />,
},
},
});
graph.render();
```
## 高级功能
### 状态管理
在复杂图可视化场景中,节点需要动态响应交互状态。我们提供两种互补的状态管理方案:
#### 响应内置交互状态
G6 提供内置的交互状态管理状态,如 `hover-activate` 和 `click-select`。可以通过节点数据中的 `data.states` 字段获取当前节点状态,并根据状态调整节点样式。
**示例**:在节点被 hover 时改变背景颜色。
```jsx
import { ExtensionCategory, register, Graph } from '@antv/g6';
import { ReactNode } from '@antv/g6-extension-react';
register(ExtensionCategory.NODE, 'react-node', ReactNode);
const StatefulNode = ({ data }) => {
const isActive = data.states?.includes('active');
return (
<div
style={{
width: 100,
padding: 5,
border: '1px solid #eee',
boxShadow: isActive ? '0 0 8px rgba(24,144,255,0.8)' : 'none',
transform: `scale(${isActive ? 1.05 : 1})`,
}}
>
{data.data.label}
</div>
);
};
const graph = new Graph({
data: {
nodes: [
{ id: 'node1', style: { x: 100, y: 200 }, data: { label: 'node1' } },
{ id: 'node2', style: { x: 300, y: 200 }, data: { label: 'node2' } },
],
},
node: {
type: 'react-node',
style: {
component: (data) => <StatefulNode data={data} />,
},
},
behaviors: ['hover-activate'],
});
graph.render();
```
#### 自定义业务状态
当需要管理业务相关状态(如审批状态、风险等级)时,可通过扩展节点数据实现:
**示例**:通过 data 添加 `selected` 变量,实现节点选中和取消选中的样式变化。
```jsx
import { ExtensionCategory, register, Graph } from '@antv/g6';
import { ReactNode } from '@antv/g6-extension-react';
register(ExtensionCategory.NODE, 'react-node', ReactNode);
const MyReactNode = ({ data, graph }) => {
const handleClick = () => {
graph.updateNodeData([{ id: data.id, data: { selected: !data.data.selected } }]);
graph.draw();
};
return (
<div
style={{
width: 200,
padding: 10,
border: '1px solid red',
borderColor: data.data.selected ? 'orange' : '#ddd', // 根据选中状态设置边框颜色
cursor: 'pointer', // 添加鼠标指针样式
}}
onClick={handleClick}
>
Node
</div>
);
};
const graph = new Graph({
data: {
nodes: [
{
id: 'node1',
style: { x: 100, y: 100 },
data: { selected: true },
},
],
},
node: {
type: 'react-node',
style: {
component: (data) => <MyReactNode data={data} graph={graph} />,
},
},
});
graph.render();
```
### 事件交互
实现节点与图实例的双向通信,使节点和图实例可以相互更新。
**示例**:通过自定义节点操作图数据,并重新渲染图形。
```jsx
const IDCardNode = ({ id, selected, graph }) => {
const handleSelect = () => {
graph.updateNodeData([{ id, data: { selected: true } }]);
graph.draw();
};
return <Select onChange={handleSelect} style={{ background: selected ? 'orange' : '#eee' }} />;
};
const graph = new Graph({
node: {
type: 'react-node',
style: {
component: ({ id, data }) => <IDCardNode id={id} selected={data.selected} graph={graph} />,
},
},
});
```
## 实际案例
```js | ob { inject: true }
import { DatabaseFilled } from '@ant-design/icons';
import { ExtensionCategory, Graph, register } from '@antv/g6';
import { ReactNode } from '@antv/g6-extension-react';
import { Badge, Flex, Input, Tag, Typography } from 'antd';
import { useEffect, useRef } from 'react';
import { createRoot } from 'react-dom/client';
const { Text } = Typography;
register(ExtensionCategory.NODE, 'react', ReactNode);
const Node = ({ data, onChange }) => {
const { status, type } = data.data;
return (
<Flex
style={{
width: '100%',
height: '100%',
background: '#fff',
padding: 10,
borderRadius: 5,
border: '1px solid gray',
}}
vertical
>
<Flex align="center" justify="space-between">
<Text>
<DatabaseFilled />
Server
<Tag>{type}</Tag>
</Text>
<Badge status={status} />
</Flex>
<Text type="secondary">{data.id}</Text>
<Flex align="center">
<Text style={{ flexShrink: 0 }}>
<Text type="danger">*</Text>URL:
</Text>
<Input
style={{ borderRadius: 0, borderBottom: '1px solid #d9d9d9' }}
variant="borderless"
value={data.data?.url}
onChange={(event) => {
const url = event.target.value;
onChange?.(url);
}}
/>
</Flex>
</Flex>
);
};
export const ReactNodeDemo = () => {
const containerRef = useRef();
useEffect(() => {
const graph = new Graph({
container: containerRef.current,
data: {
nodes: [
{
id: 'local-server-1',
data: { status: 'success', type: 'local', url: 'http://localhost:3000' },
style: { x: 50, y: 50 },
},
{
id: 'remote-server-1',
data: { status: 'warning', type: 'remote' },
style: { x: 350, y: 50 },
},
],
edges: [{ source: 'local-server-1', target: 'remote-server-1' }],
},
node: {
type: 'react',
style: {
size: [240, 100],
component: (data) => <Node data={data} />,
},
},
behaviors: ['drag-element', 'zoom-canvas', 'drag-canvas'],
});
graph.render();
}, []);
return <div style={{ width: '100%', height: '100%' }} ref={containerRef}></div>;
};
const root = createRoot(document.getElementById('container'));
root.render(<ReactNodeDemo />);
```
<br/>
```js | ob { inject: true }
import { UserOutlined } from '@ant-design/icons';
import { ExtensionCategory, Graph, register } from '@antv/g6';
import { ReactNode } from '@antv/g6-extension-react';
import { Avatar, Button, Card, Descriptions, Select, Space, Typography } from 'antd';
import React, { useEffect, useRef } from 'react';
import { createRoot } from 'react-dom/client';
const { Title, Text } = Typography;
const { Option } = Select;
register(ExtensionCategory.NODE, 'react-node', ReactNode);
const IDCardNode = ({ id, data }) => {
const { name, idNumber, address, expanded, selected, graph } = data;
const toggleExpand = (e) => {
e.stopPropagation();
graph.updateNodeData([
{
id,
data: { expanded: !expanded },
},
]);
graph.render();
};
const handleSelect = (value) => {
graph.updateNodeData([
{
id,
data: { selected: value !== 0 },
},
]);
if (value === 2) {
// 获取与当前节点相连的所有节点
const connectedNodes = graph.getNeighborNodesData(id);
connectedNodes.forEach((node) => {
graph.updateNodeData([
{
id: node.id,
data: { selected: true },
},
]);
});
}
graph.render();
};
const CardTitle = (
<div style={{ display: 'flex', justifyContent: 'space-between', alignItems: 'center' }}>
<Space>
<Avatar shape="square" size="small" icon={<UserOutlined />} />
<Title level={5} style={{ margin: 0 }}>
{name}
</Title>
<Select
value={selected ? data.selectedOption || 1 : 0}
style={{ width: 150, marginRight: 8 }}
onChange={handleSelect}
>
<Option value={0}>None</Option>
<Option value={1}>Node</Option>
<Option value={2}>Connected</Option>
</Select>
</Space>
<Button type="link" onClick={toggleExpand} style={{ padding: 0 }}>
{expanded ? 'fold' : 'expand'}
</Button>
</div>
);
return (
<Card
size="small"
title={CardTitle}
style={{
width: 340,
padding: 10,
borderRadius: 8,
borderWidth: 2,
borderColor: selected ? 'orange' : '#eee', // 根据选中状态设置边框颜色
cursor: 'pointer',
}}
>
{expanded ? (
<Descriptions bordered column={1} style={{ width: '100%', textAlign: 'center' }}>
<Descriptions.Item label="ID Number">{idNumber}</Descriptions.Item>
<Descriptions.Item label="Address">{address}</Descriptions.Item>
</Descriptions>
) : (
<Text style={{ textAlign: 'center' }}>IDCard Information</Text>
)}
</Card>
);
};
// 定义 Graph 数据
const data = {
nodes: [
{
id: 'node1',
data: {
name: 'Alice',
idNumber: 'IDUSAASD2131734',
address: '1234 Broadway, Apt 5B, New York, NY 10001',
expanded: false, // 初始状态为收缩
selected: false, // 初始状态为未选中
selectedOption: 1, // 初始选择本节点
},
style: { x: 50, y: 50 },
},
{
id: 'node2',
data: {
name: 'Bob',
idNumber: 'IDUSAASD1431920',
address: '3030 Chestnut St, Philadelphia, PA 19104',
expanded: false, // 初始状态为收缩
selected: false, // 初始状态为未选中
selectedOption: 0, // 初始不选择
},
style: { x: 700, y: 100 },
},
{
id: 'node3',
data: {
name: 'Charlie',
idNumber: 'IDUSAASD1431921',
address: '4040 Elm St, Chicago, IL 60611',
expanded: false,
selected: true,
selectedOption: 0,
},
},
{
id: 'node4',
data: {
name: 'David',
idNumber: 'IDUSAASD1431922',
address: '5050 Oak St, Houston, TX 77002',
expanded: false,
selected: false,
selectedOption: 0,
},
},
{
id: 'node5',
data: {
name: 'Eve',
idNumber: 'IDUSAASD1431923',
address: '6060 Pine St, Phoenix, AZ 85001',
expanded: false,
selected: false,
selectedOption: 0,
},
},
],
edges: [
{ source: 'node1', target: 'node2' },
{ source: 'node2', target: 'node3' },
{ source: 'node3', target: 'node4' },
{ source: 'node4', target: 'node5' },
],
};
export const ReactNodeDemo = () => {
const containerRef = useRef();
const graphRef = useRef(null);
useEffect(() => {
// 创建 Graph 实例
const graph = new Graph({
autoFit: 'view',
container: containerRef.current,
data,
node: {
type: 'react-node',
style: {
size: (datum) => (datum.data.expanded ? [340, 236] : [340, 105]), // 调整大小以适应内容
component: (data) => <IDCardNode id={data.id} data={{ ...data.data, graph: graph }} />,
},
},
behaviors: ['drag-element', 'zoom-canvas', 'drag-canvas'],
layout: {
type: 'snake',
cols: 2,
rowGap: 100,
colGap: 220,
},
});
// 渲染 Graph
graph.render();
// 保存 graph 实例
graphRef.current = graph;
return () => {
graph.destroy();
};
}, []);
return <div style={{ width: '100%', height: '100%' }} ref={containerRef}></div>;
};
// 渲染 React 组件到 DOM
const root = createRoot(document.getElementById('container'));
root.render(<ReactNodeDemo />);
```
Node Skill
packages/site/docs/manual/element/node/Rect.en.md anthropic-skill ~573 tokens---
title: Rect Node
order: 9
---
## Overview
A rectangle is a geometric shape with four equal sides and defined boundaries.
Applicable scenarios:
- Used to represent modules, components, or containers.
- Suitable for representing hierarchies, such as organizational charts, file directory trees.
- Commonly used in flowcharts, architecture diagrams, UML diagrams, etc.
## Online Experience
<embed src="@/common/api/elements/nodes/rect.md"></embed>
## Style Configuration
> If the element has specific attributes, we will list them below. For all general style attributes, see [BaseNode](/en/manual/element/node/base-node)
## Example
### Built-in Rect Node Effect
```js | ob { inject: true }
import { Graph, iconfont } from '@antv/g6';
const style = document.createElement('style');
style.innerHTML = `@import url('${iconfont.css}');`;
document.head.appendChild(style);
const data = {
nodes: [
{ id: 'default' },
{ id: 'halo' },
{ id: 'badges' },
{ id: 'ports' },
{
id: 'active',
states: ['active'],
},
{
id: 'selected',
states: ['selected'],
},
{
id: 'highlight',
states: ['highlight'],
},
{
id: 'inactive',
states: ['inactive'],
},
{
id: 'disabled',
states: ['disabled'],
},
],
};
const graph = new Graph({
container: 'container',
data,
node: {
type: 'rect',
style: {
size: 40,
labelText: (d) => d.id,
iconFontFamily: 'iconfont',
iconText: '\ue602',
halo: (d) => (d.id === 'halo' ? true : false),
badges: (d) =>
d.id === 'badges'
? [
{
text: 'A',
placement: 'right-top',
},
{
text: 'Important',
placement: 'right',
},
{
text: 'Notice',
placement: 'right-bottom',
},
]
: [],
badgeFontSize: 8,
badgePadding: [1, 4],
portR: 3,
ports: (d) =>
d.id === 'ports'
? [{ placement: 'left' }, { placement: 'right' }, { placement: 'top' }, { placement: 'bottom' }]
: [],
},
},
layout: {
type: 'grid',
},
});
graph.render();
```
Node Skill
packages/site/docs/manual/element/node/Rect.zh.md anthropic-skill ~483 tokens---
title: 矩形节点 Rect
order: 9
---
## 概述
矩形是一个四边相等的几何形状,具有明确的边界。
适用场景:
- 用于表示模块、组件或容器。
- 适合表示层次结构,如组织结构图、文件目录树。
- 常用于流程图、架构图、UML 图等。
## 在线体验
<embed src="@/common/api/elements/nodes/rect.md"></embed>
## 样式配置
> 如果元素有其特定的属性,我们将在下面列出。对于所有的通用样式属性,见 [BaseNode](/manual/element/node/base-node)
## 示例
### 内置矩形节点效果
```js | ob { inject: true }
import { Graph, iconfont } from '@antv/g6';
const style = document.createElement('style');
style.innerHTML = `@import url('${iconfont.css}');`;
document.head.appendChild(style);
const data = {
nodes: [
{ id: 'default' },
{ id: 'halo' },
{ id: 'badges' },
{ id: 'ports' },
{
id: 'active',
states: ['active'],
},
{
id: 'selected',
states: ['selected'],
},
{
id: 'highlight',
states: ['highlight'],
},
{
id: 'inactive',
states: ['inactive'],
},
{
id: 'disabled',
states: ['disabled'],
},
],
};
const graph = new Graph({
container: 'container',
data,
node: {
type: 'rect',
style: {
size: 40,
labelText: (d) => d.id,
iconFontFamily: 'iconfont',
iconText: '\ue602',
halo: (d) => (d.id === 'halo' ? true : false),
badges: (d) =>
d.id === 'badges'
? [
{
text: 'A',
placement: 'right-top',
},
{
text: 'Important',
placement: 'right',
},
{
text: 'Notice',
placement: 'right-bottom',
},
]
: [],
badgeFontSize: 8,
badgePadding: [1, 4],
portR: 3,
ports: (d) =>
d.id === 'ports'
? [{ placement: 'left' }, { placement: 'right' }, { placement: 'top' }, { placement: 'bottom' }]
: [],
},
},
layout: {
type: 'grid',
},
});
graph.render();
```
Node Skill
packages/site/docs/manual/element/node/Star.en.md anthropic-skill ~712 tokens---
title: Star Node
order: 10
---
## Overview
A star is a polygonal geometric shape with prominent points.
Applicable scenarios:
- Used to represent important nodes, special markers, or decorative elements.
- Suitable for representing flowcharts, network diagrams, or topology diagrams.
- Commonly used in flowcharts, network diagrams, topology diagrams, etc.
## Online Experience
<embed src="@/common/api/elements/nodes/star.md"></embed>
## Style Configuration
> If the element has specific attributes, we will list them below. For all general style attributes, see [BaseNode](/en/manual/element/node/base-node)
| Attribute | Description | Type | Default | Required |
| --------- | --------------------------------------------------------------------- | ------ | ---------------------------------- | -------- |
| innerR | Inner radius, the distance from the star's center to the inner vertex | number | Default is 3/8 of the outer radius |
Structure Description:
<img width="200" src="https://mdn.alipayobjects.com/huamei_qa8qxu/afts/img/A*VKrvQpdqwXoAAAAAAAAAAAAAemJ7AQ/original" />
## Example
### Built-in Star Node Effect
```js | ob { inject: true }
import { Graph, iconfont } from '@antv/g6';
const style = document.createElement('style');
style.innerHTML = `@import url('${iconfont.css}');`;
document.head.appendChild(style);
const data = {
nodes: [
{ id: 'default' },
{ id: 'halo' },
{ id: 'badges' },
{ id: 'ports' },
{
id: 'active',
states: ['active'],
},
{
id: 'selected',
states: ['selected'],
},
{
id: 'highlight',
states: ['highlight'],
},
{
id: 'inactive',
states: ['inactive'],
},
{
id: 'disabled',
states: ['disabled'],
},
],
};
const graph = new Graph({
container: 'container',
data,
node: {
type: 'star',
style: {
size: 40,
labelText: (d) => d.id,
iconFontFamily: 'iconfont',
iconText: '\ue602',
halo: (d) => (d.id === 'halo' ? true : false),
badges: (d) =>
d.id === 'badges'
? [
{
text: 'A',
placement: 'right-top',
},
{
text: 'Important',
placement: 'right',
},
{
text: 'Notice',
placement: 'right-bottom',
},
]
: [],
badgeFontSize: 8,
badgePadding: [1, 4],
portR: 3,
ports: (d) =>
d.id === 'ports'
? [{ placement: 'left' }, { placement: 'right' }, { placement: 'top' }, { placement: 'bottom' }]
: [],
},
},
layout: {
type: 'grid',
},
});
graph.render();
```
Node Skill
packages/site/docs/manual/element/node/Star.zh.md anthropic-skill ~570 tokens---
title: 五角形节点 Star
order: 10
---
## 概述
星形是一个多角几何形状,具有突出的角。
适用场景:
- 用于表示重要节点、特殊标记或装饰性元素。
- 适合表示流程图、网络图或拓扑图。
- 常用于流程图、网络图、拓扑图等。
## 在线体验
<embed src="@/common/api/elements/nodes/star.md"></embed>
## 样式配置
> 如果元素有其特定的属性,我们将在下面列出。对于所有的通用样式属性,见 [BaseNode](/manual/element/node/base-node)
| 属性 | 描述 | 类型 | 默认值 | 必选 |
| ------ | ------------------------------------ | ------ | ------------------ | ---- |
| innerR | 内半径,是指从星形中心到内顶点的距离 | number | 默认为外半径的 3/8 |
结构说明:
<img width="200" src="https://mdn.alipayobjects.com/huamei_qa8qxu/afts/img/A*VKrvQpdqwXoAAAAAAAAAAAAAemJ7AQ/original" />
## 示例
### 内置五角形节点效果
```js | ob { inject: true }
import { Graph, iconfont } from '@antv/g6';
const style = document.createElement('style');
style.innerHTML = `@import url('${iconfont.css}');`;
document.head.appendChild(style);
const data = {
nodes: [
{ id: 'default' },
{ id: 'halo' },
{ id: 'badges' },
{ id: 'ports' },
{
id: 'active',
states: ['active'],
},
{
id: 'selected',
states: ['selected'],
},
{
id: 'highlight',
states: ['highlight'],
},
{
id: 'inactive',
states: ['inactive'],
},
{
id: 'disabled',
states: ['disabled'],
},
],
};
const graph = new Graph({
container: 'container',
data,
node: {
type: 'star',
style: {
size: 40,
labelText: (d) => d.id,
iconFontFamily: 'iconfont',
iconText: '\ue602',
halo: (d) => (d.id === 'halo' ? true : false),
badges: (d) =>
d.id === 'badges'
? [
{
text: 'A',
placement: 'right-top',
},
{
text: 'Important',
placement: 'right',
},
{
text: 'Notice',
placement: 'right-bottom',
},
]
: [],
badgeFontSize: 8,
badgePadding: [1, 4],
portR: 3,
ports: (d) =>
d.id === 'ports'
? [{ placement: 'left' }, { placement: 'right' }, { placement: 'top' }, { placement: 'bottom' }]
: [],
},
},
layout: {
type: 'grid',
},
});
graph.render();
```
Node Skill
packages/site/docs/manual/element/node/Triangle.en.md anthropic-skill ~661 tokens---
title: Triangle Node
order: 11
---
## Overview
A triangle is a geometric shape with three sides, having a clear directionality.
Applicable scenarios:
- Used to represent directional nodes, warnings, or prompts.
- Suitable for indicating direction or hierarchy in flowcharts.
- Commonly used in flowcharts, network diagrams, topology diagrams, etc.
## Online Experience
<embed src="@/common/api/elements/nodes/triangle.md"></embed>
## Style Configuration
> If the element has specific attributes, we will list them below. For all general style attributes, see [BaseNode](/en/manual/element/node/base-node)
| Attribute | Description | Type | Default | Required |
| --------- | ------------------------- | ----------------------------------- | ------- | -------- |
| direction | Direction of the triangle | `up` \| `left` \| `right` \| `down` | `up` |
## Example
### Built-in Triangle Node Effect
```js | ob { inject: true }
import { Graph, iconfont } from '@antv/g6';
const style = document.createElement('style');
style.innerHTML = `@import url('${iconfont.css}');`;
document.head.appendChild(style);
const data = {
nodes: [
{ id: 'default' },
{ id: 'halo' },
{ id: 'badges' },
{ id: 'ports' },
{
id: 'active',
states: ['active'],
},
{
id: 'selected',
states: ['selected'],
},
{
id: 'highlight',
states: ['highlight'],
},
{
id: 'inactive',
states: ['inactive'],
},
{
id: 'disabled',
states: ['disabled'],
},
],
};
const graph = new Graph({
container: 'container',
data,
node: {
type: 'triangle',
style: {
size: 40,
direction: (d) => (d.id === 'ports' ? 'left' : undefined),
labelText: (d) => d.id,
iconFontFamily: 'iconfont',
iconText: '\ue602',
halo: (d) => (d.id === 'halo' ? true : false),
badges: (d) =>
d.id === 'badges'
? [
{
text: 'A',
placement: 'right-top',
},
{
text: 'Important',
placement: 'right',
},
{
text: 'Notice',
placement: 'right-bottom',
},
]
: [],
badgeFontSize: 8,
badgePadding: [1, 4],
portR: 3,
ports: (d) =>
d.id === 'ports'
? [{ placement: 'left' }, { placement: 'right' }, { placement: 'top' }, { placement: 'bottom' }]
: [],
},
},
layout: {
type: 'grid',
},
});
graph.render();
```
Node Skill
packages/site/docs/manual/element/node/Triangle.zh.md anthropic-skill ~559 tokens---
title: 三角形节点 Triangle
order: 11
---
## 概述
三角形是一个三边几何形状,具有明确的方向性。
适用场景:
- 用于表示方向性节点、警告或提示。
- 适合表示流程图中的方向指示或层级关系。
- 常用于流程图、网络图、拓扑图等。
## 在线体验
<embed src="@/common/api/elements/nodes/triangle.md"></embed>
## 样式配置
> 如果元素有其特定的属性,我们将在下面列出。对于所有的通用样式属性,见 [BaseNode](/manual/element/node/base-node)
| 属性 | 描述 | 类型 | 默认值 | 必选 |
| --------- | ------------ | ----------------------------------- | ------ | ---- |
| direction | 三角形的方向 | `up` \| `left` \| `right` \| `down` | `up` |
## 示例
### 内置三角形节点效果
```js | ob { inject: true }
import { Graph, iconfont } from '@antv/g6';
const style = document.createElement('style');
style.innerHTML = `@import url('${iconfont.css}');`;
document.head.appendChild(style);
const data = {
nodes: [
{ id: 'default' },
{ id: 'halo' },
{ id: 'badges' },
{ id: 'ports' },
{
id: 'active',
states: ['active'],
},
{
id: 'selected',
states: ['selected'],
},
{
id: 'highlight',
states: ['highlight'],
},
{
id: 'inactive',
states: ['inactive'],
},
{
id: 'disabled',
states: ['disabled'],
},
],
};
const graph = new Graph({
container: 'container',
data,
node: {
type: 'triangle',
style: {
size: 40,
direction: (d) => (d.id === 'ports' ? 'left' : undefined),
labelText: (d) => d.id,
iconFontFamily: 'iconfont',
iconText: '\ue602',
halo: (d) => (d.id === 'halo' ? true : false),
badges: (d) =>
d.id === 'badges'
? [
{
text: 'A',
placement: 'right-top',
},
{
text: 'Important',
placement: 'right',
},
{
text: 'Notice',
placement: 'right-bottom',
},
]
: [],
badgeFontSize: 8,
badgePadding: [1, 4],
portR: 3,
ports: (d) =>
d.id === 'ports'
? [{ placement: 'left' }, { placement: 'right' }, { placement: 'top' }, { placement: 'bottom' }]
: [],
},
},
layout: {
type: 'grid',
},
});
graph.render();
```
Node Skill
packages/site/docs/manual/element/node/vue-node.en.md anthropic-skill ~1,912 tokens---
title: Define Nodes with Vue
order: 14
---
In G6, custom nodes typically require manipulating DOM or Canvas elements, but with the help of the [`g6-extension-vue`](https://github.com/Child-qjj/g6-extension-vue) ecosystem library, you can directly use Vue components as node content, enhancing development efficiency and maintainability.
## Choosing a Custom Node Solution
### G6 Node
<img src="https://mdn.alipayobjects.com/huamei_qa8qxu/afts/img/A*sEaLR7Q_hmoAAAAAAAAAAAAAemJ7AQ/fmt.avif" width="300" />
✅ **Recommended Scenarios:**
- Nodes are simple geometric shapes
- Scenarios requiring efficient rendering of more than 2,000 nodes
- Need to directly manipulate graphic instances for fine control
> For detailed information on how to customize nodes using Canvas graphics, please refer to the [Custom Node](/en/manual/element/node/custom-node) documentation
### Vue Node
<img src="https://mdn.alipayobjects.com/huamei_qa8qxu/afts/img/A*9oz-R7bIkd0AAAAAAAAAAAAADmJ7AQ/original" width="350" />
✅ **Recommended Scenarios:**
- Business systems that need to integrate UI libraries like Element Plus / Ant Design Vue
- Nodes contain interactive logic such as form input, state switching
- Scenarios where an existing Vue design system needs to be reused
## Quick Start
### Environment Preparation
Before starting, please ensure you have:
- **Installed a Vue project**: Ensure a Vue project is installed and created.
- **Vue version requirement**: Ensure the Vue version used is >=2.6.0. (Vue 3 is recommended)
### Install Dependencies
To use [`g6-extension-vue`](https://github.com/Child-qjj/g6-extension-vue), run the following command:
:::code-group
```bash [npm]
npm install g6-extension-vue
```
```bash [yarn]
yarn add g6-extension-vue
```
```bash [pnpm]
pnpm add g6-extension-vue
```
:::
### Component Integration
#### 1. Register Vue Node Type
Register the Vue node type through the extension mechanism:
```jsx
import { ExtensionCategory, register } from '@antv/g6';
import { VueNode } from 'g6-extension-vue';
register(ExtensionCategory.NODE, 'vue-node', VueNode);
```
The `register` method requires three parameters:
- Extension category: `ExtensionCategory.NODE` indicates this is a node type
- Type name: `vue-node` is the name we give to this custom node, which will be used in the configuration later
- Class definition: VueNode is the implementation class exported by `g6-extension-vue`
#### 2. Define Business Component
Define a simple Vue component as the content of the node:
```jsx
import { defineComponent, h } from 'vue';
const MyVueNode = defineComponent({
setup(props, { attrs, slots, expose }) {
return () => {
return h('div', 'vue node');
};
},
});
```
#### 3. Use the Component
Use the custom Vue node in the graph configuration. Specify the node type and style in the graph configuration to use the custom Vue component.
- `type`: Specify the node type as `vue-node` (use the name given during registration)
- `style.component`: Define the Vue component content of the node
```jsx
const graph = new Graph({
node: {
type: 'vue-node',
style: {
component: () => <MyVueNode />,
},
},
});
graph.render();
```
## Advanced Features
### State Management
In complex graph visualization scenarios, nodes need to dynamically respond to interaction states. We provide two complementary state management solutions:
#### Respond to Built-in Interaction States
G6 provides built-in interaction state management states, such as `hover-activate` and `click-select`. You can get the current node state through the `data.states` field in the node data and adjust the node style based on the state.
**Example**: Change the background color when the node is hovered.
```jsx
import { ExtensionCategory, register, Graph } from '@antv/g6';
import { VueNode } from 'g6-extension-vue';
import { computed, defineComponent } from 'vue';
register(ExtensionCategory.NODE, 'vue-node', VueNode);
const StatefulNode = defineComponent({
setup(props, { attrs, slots, expose }) {
const isActive = computed(() => props.data.states?.includes('active'));
const label = computed(() => props.data.data?.label);
return (
<div
style={{
width: 100,
padding: 5,
border: '1px solid #eee',
boxShadow: isActive.value ? '0 0 8px rgba(24,144,255,0.8)' : 'none',
transform: `scale(${isActive.value ? 1.05 : 1})`,
}}
>
{label.value}
</div>
);
},
});
const graph = new Graph({
data: {
nodes: [
{ id: 'node1', style: { x: 100, y: 200 }, data: { label: 'node1' } },
{ id: 'node2', style: { x: 300, y: 200 }, data: { label: 'node2' } },
],
},
node: {
type: 'vue-node',
style: {
component: (data) => <StatefulNode data={Object.assign({}, data)} />, // data is non-reactive, need to change reference to trigger Vue's props side effects
},
},
behaviors: ['hover-activate'],
});
graph.render();
```
#### Custom Business State
When you need to manage business-related states (such as approval status, risk level), you can extend node data to achieve this:
**Example**: Add a `selected` variable through data to achieve style changes for node selection and deselection.
```jsx
import { ExtensionCategory, register, Graph } from '@antv/g6';
import { VueNode } from 'g6-extension-vue';
import { defineComponent, computed } from 'vue';
register(ExtensionCategory.NODE, 'vue-node', VueNode);
const MyVueNode = defineComponent({
setup(props, { attrs, slots, expose }) {
const isSelected = computed(() => props.data.data.selected);
const handleClick = () => {
graph.updateNodeData([{ id: props.data.id, data: { selected: !isSelected.value } }]);
graph.draw();
};
return (
<div
style={{
width: 200,
padding: 10,
border: '1px solid red',
borderColor: isSelected.value ? 'orange' : '#ddd', // Set border color based on selection state
cursor: 'pointer', // Add mouse pointer style
}}
onClick={handleClick}
>
Node
</div>
);
},
});
const graph = new Graph({
data: {
nodes: [
{
id: 'node1',
style: { x: 100, y: 100 },
data: { selected: true },
},
],
},
node: {
type: 'vue-node',
style: {
component: (data) => <MyVueNode data={Object.assign({}, data)} graph={graph} />, // data is non-reactive, need to change reference to trigger Vue's props side effects
},
},
});
graph.render();
```
### Event Interaction
Achieve two-way communication between nodes and graph instances, allowing nodes and graph instances to update each other.
**Example**: Operate graph data through custom nodes and re-render the graph.
```jsx
import { ExtensionCategory, register, Graph } from '@antv/g6';
import { VueNode } from 'g6-extension-vue';
import { defineComponent, computed } from 'vue';
register(ExtensionCategory.NODE, 'vue-node', VueNode);
const IDCardNode = defineComponent({
setup(props, { attrs, slots, expose }) {
const isSelected = computed(() => props.data.data.selected);
const handleSelect = () => {
graph.updateNodeData([{ id: props.data.id, data: { selected: true } }]);
graph.draw();
};
return <Select onChange={handleSelect} style={{ background: isSelected.value ? 'orange' : '#eee' }} />;
},
});
const graph = new Graph({
node: {
type: 'vue-node',
style: {
component: ({ id, data }) => <IDCardNode id={id} selected={isSelected.value} graph={graph} />,
},
},
});
```
Node Skill
packages/site/docs/manual/element/node/vue-node.zh.md anthropic-skill ~1,407 tokens---
title: 使用 Vue 定义节点
order: 14
---
在 G6 中,自定义节点通常需要操作 DOM 或 Canvas 元素,但借助 [`g6-extension-vue`](https://github.com/Child-qjj/g6-extension-vue) 社区生态库,可以直接使用 Vue 组件作为节点内容,提升开发效率与可维护性。
### G6 节点
<img src="https://mdn.alipayobjects.com/huamei_qa8qxu/afts/img/A*sEaLR7Q_hmoAAAAAAAAAAAAAemJ7AQ/fmt.avif" width="300" />
✅ **推荐场景:**
- 节点只是简单的几何图形
- 需要高效渲染超过 2,000 个节点的场景
- 需要直接操作图形实例进行精细控制
> 有关如何使用 Canvas 图形自定义节点的详细信息,请参阅 [自定义节点](/manual/element/node/custom-node) 文档
### Vue Node
<img src="https://mdn.alipayobjects.com/huamei_qa8qxu/afts/img/A*9oz-R7bIkd0AAAAAAAAAAAAADmJ7AQ/original" width="350" />
✅ **推荐场景:**
- 需要集成 Element Plus / Ant Design Vue 等 UI 库的业务系统
- 节点包含表单输入、状态切换等交互逻辑
- 已有 Vue 设计系统需要复用的场景
## 快速入门
### 环境准备
在开始之前,请确保您已经:
- **安装 Vue 项目**:确保已安装并创建 Vue 项目。
- **Vue 版本要求**:确保使用的 Vue 版本 >=2.6.0。(推荐使用 Vue 3)
### 安装依赖
要使用 [`g6-extension-vue`](https://github.com/Child-qjj/g6-extension-vue),请运行以下命令:
:::code-group
```bash [npm]
npm install g6-extension-vue
```
```bash [yarn]
yarn add g6-extension-vue
```
```bash [pnpm]
pnpm add g6-extension-vue
```
:::
### 组件集成
#### 1. 注册 Vue 节点类型
通过扩展机制注册 Vue 节点类型:
```jsx
import { ExtensionCategory, register } from '@antv/g6';
import { VueNode } from 'g6-extension-vue';
register(ExtensionCategory.NODE, 'vue-node', VueNode);
```
`register` 方法需要三个参数:
- 扩展类别:`ExtensionCategory.NODE` 表示这是一个节点类型
- 类型名称:`vue-node` 是我们给这个自定义节点起的名字,后续会在配置中使用
- 类定义:VueNode 是 `g6-extension-vue` 导出的实现类
#### 2. 定义业务组件
定义一个简单的 Vue 组件作为节点的内容:
```jsx
import { defineComponent, h } from 'vue';
const MyVueNode = defineComponent({
setup(props, { attrs, slots, expose }) {
return () => {
return h('div', 'vue node');
};
},
});
```
#### 3. 使用组件
在图配置中使用自定义的 Vue 节点。通过在图配置中指定节点类型和样式,来使用自定义的 Vue 组件。
- `type`:指定节点类型为 `vue-node` (使用与注册时起的名字)
- `style.component`:定义节点的 Vue 组件内容
```jsx
const graph = new Graph({
node: {
type: 'vue-node',
style: {
component: () => <MyVueNode />,
},
},
});
graph.render();
```
## 高级功能
### 状态管理
在复杂图可视化场景中,节点需要动态响应交互状态。我们提供两种互补的状态管理方案:
#### 响应内置交互状态
G6 提供内置的交互状态管理状态,如 `hover-activate` 和 `click-select`。可以通过节点数据中的 `data.states` 字段获取当前节点状态,并根据状态调整节点样式。
**示例**:在节点被 hover 时改变背景颜色。
```jsx
import { ExtensionCategory, register, Graph } from '@antv/g6';
import { VueNode } from 'g6-extension-vue';
import { computed, defineComponent } from 'vue';
register(ExtensionCategory.NODE, 'vue-node', VueNode);
const StatefulNode = defineComponent({
setup(props, { attrs, slots, expose }) {
const isActive = computed(() => props.data.states?.includes('active'));
const label = computed(() => props.data.data?.label);
return (
<div
style={{
width: 100,
padding: 5,
border: '1px solid #eee',
boxShadow: isActive.value ? '0 0 8px rgba(24,144,255,0.8)' : 'none',
transform: `scale(${isActive.value ? 1.05 : 1})`,
}}
>
{label.value}
</div>
);
},
});
const graph = new Graph({
data: {
nodes: [
{ id: 'node1', style: { x: 100, y: 200 }, data: { label: 'node1' } },
{ id: 'node2', style: { x: 300, y: 200 }, data: { label: 'node2' } },
],
},
node: {
type: 'vue-node',
style: {
component: (data) => <StatefulNode data={Object.assign({}, data)} />, // data是非响应式数据,需要通过改变引用来触发Vue的props副作用
},
},
behaviors: ['hover-activate'],
});
graph.render();
```
#### 自定义业务状态
当需要管理业务相关状态(如审批状态、风险等级)时,可通过扩展节点数据实现:
**示例**:通过 data 添加 `selected` 变量,实现节点选中和取消选中的样式变化。
```jsx
import { ExtensionCategory, register, Graph } from '@antv/g6';
import { VueNode } from 'g6-extension-vue';
import { defineComponent, computed } from 'vue';
register(ExtensionCategory.NODE, 'vue-node', VueNode);
const MyVueNode = defineComponent({
setup(props, { attrs, slots, expose }) {
const isSelected = computed(() => props.data.data.selected);
const handleClick = () => {
graph.updateNodeData([{ id: props.data.id, data: { selected: !isSelected.value } }]);
graph.draw();
};
return (
<div
style={{
width: 200,
padding: 10,
border: '1px solid red',
borderColor: isSelected.value ? 'orange' : '#ddd', // 根据选中状态设置边框颜色
cursor: 'pointer', // 添加鼠标指针样式
}}
onClick={handleClick}
>
Node
</div>
);
},
});
const graph = new Graph({
data: {
nodes: [
{
id: 'node1',
style: { x: 100, y: 100 },
data: { selected: true },
},
],
},
node: {
type: 'vue-node',
style: {
component: (data) => <MyVueNode data={Object.assign({}, data)} graph={graph} />, // data是非响应式数据,需要通过改变引用来触发Vue的props副作用
},
},
});
graph.render();
```
### 事件交互
实现节点与图实例的双向通信,使节点和图实例可以相互更新。
**示例**:通过自定义节点操作图数据,并重新渲染图形。
```jsx
import { ExtensionCategory, register, Graph } from '@antv/g6';
import { VueNode } from 'g6-extension-vue';
import { defineComponent, computed } from 'vue';
register(ExtensionCategory.NODE, 'vue-node', VueNode);
const IDCardNode = defineComponent({
setup(props, { attrs, slots, expose }) {
const isSelected = computed(() => props.data.data.selected);
const handleSelect = () => {
graph.updateNodeData([{ id: props.data.id, data: { selected: true } }]);
graph.draw();
};
return <Select onChange={handleSelect} style={{ background: isSelected.value ? 'orange' : '#eee' }} />;
},
});
const graph = new Graph({
node: {
type: 'vue-node',
style: {
component: ({ id, data }) => <IDCardNode id={id} selected={isSelected.value} graph={graph} />,
},
},
});
```
Element Skill
packages/site/docs/manual/element/overview.en.md anthropic-skill ~1,362 tokens---
title: Element Overview
order: 1
---
## Element System
The core of G6 charts is composed of three basic elements: **Node**, **Edge**, and **Combo**. These elements are the fundamental units for building complex graphical networks.
<image width="400" src="https://mdn.alipayobjects.com/huamei_qa8qxu/afts/img/A*2ZewT4T1p_4AAAAAAAAAAAAADmJ7AQ/original" />
### Node
[Nodes](/en/manual/element/node/overview) represent entities or concepts in the graph, such as people, places, objects, etc. G6 provides a rich set of built-in node types:
<image width="300" src="https://mdn.alipayobjects.com/huamei_qa8qxu/afts/img/A*TZt2S7Z0d-8AAAAAAAAAAAAADmJ7AQ/original" />
G6 also supports [defining nodes using React](/en/manual/element/node/react-node) or [custom nodes](/en/manual/element/node/custom-node) to meet specific needs.
### Edge
[Edges](/en/manual/element/edge/overview) represent the connections between nodes, such as friendships, transactions, etc. G6 has multiple built-in edge types:
<image width="300" src="https://mdn.alipayobjects.com/huamei_qa8qxu/afts/img/A*YKN7TasqOh4AAAAAAAAAAAAADmJ7AQ/original" />
When built-in edges do not meet the requirements, complex connection expressions can be achieved through [custom edges](/en/manual/element/edge/custom-edge).
### Combo
[Combos](/en/manual/element/combo/overview) are special elements that can contain nodes and other combos, used to represent collections, groups, or hierarchical relationships. G6 has two built-in combo types:
- **Circle Combo**(`circle`): Suitable for compact grouping
- **Rectangle Combo**(`rect`): Suitable for regular layout grouping
<image width="450" src="https://mdn.alipayobjects.com/huamei_qa8qxu/afts/img/A*zPAzSZ3XxpUAAAAAAAAAAAAADmJ7AQ/original" />
Combos support nesting, dragging, expanding/collapsing, and other interactions, and more complex container behaviors can be achieved through [custom combos](/en/manual/element/combo/custom-combo).
## Element Composition Principle
Each element is composed of one or more basic shapes. Shapes are the smallest graphical units in G6, including [rectangle](/en/manual/element/shape/properties#rectstyleprops), [circle](/en/manual/element/shape/properties#circlestyleprops), [text](/en/manual/element/shape/properties#textstyleprops), [path](/en/manual/element/shape/properties#pathstyleprops), etc.
For example:
- A node may consist of a background shape (such as a circle) and a text label
- An edge may consist of a path, arrow, and text label
- A combo may consist of a container shape, title text, and expand/collapse button
For more information about shapes, see [Shape Overview](/en/manual/element/shape/overview) and [Shape Style Properties](/en/manual/element/shape/properties).
## Element State
[Element State](/en/manual/element/state) is a powerful mechanism for displaying visual changes of elements in different interactions or business scenarios. G6 provides a complete state management system:
- **Preset States**: `selected`, `highlight`, `active`, etc.
- **State Overlay**: Elements can have multiple states simultaneously, with styles overlaying according to priority
- **Custom States**: Any state can be defined according to business needs
<image width="500" src="https://mdn.alipayobjects.com/huamei_qa8qxu/afts/img/A*yVbORYybrDQAAAAAAAAAAAAADmJ7AQ/original" />
## Configure Elements
G6 5.x adopts a flat configuration structure, where all element configurations are at the same level, making it easy to find and manage:
```typescript
{
node: {
// Default node style
style: {
fill: 'orange',
labelText: 'node',
},
// Node styles in different states
state: {
selected: {
stroke: '#1890FF',
lineWidth: 2,
}
}
},
edge: {
// Default edge style
style: {
stroke: '#aaa',
},
// Edge styles in different states
state: {
highlight: {
stroke: 'red',
}
}
},
combo: {
// Default combo style
style: {
fill: 'lightblue',
stroke: 'blue',
}
}
};
```
There are three configuration methods, in order of priority from high to low:
1. **Dynamic configuration using instance methods**: such as `graph.setNode()`, `graph.setEdge()`, `graph.setCombo()`
2. **Global configuration when instantiating the graph**: specify configuration items in `new Graph()`
3. **Configuration in data**: set in the data objects of nodes, edges, and combos
In editors like VSCode, you can see all configurable properties of elements and search based on keywords:
<image width="800" src="https://mdn.alipayobjects.com/huamei_qa8qxu/afts/img/A*oY_uTK80sIoAAAAAAAAAAAAADmJ7AQ/original" />
## Extension Capabilities
G6 provides powerful extension capabilities to meet various customization needs:
- **Custom Nodes**: [Custom Node Guide](/en/manual/element/node/custom-node)
- **Custom Edges**: [Custom Edge Guide](/en/manual/element/edge/custom-edge)
- **Custom Combos**: [Custom Combo Guide](/en/manual/element/combo/custom-combo)
- **React Nodes**: [Define Nodes Using React](/en/manual/element/node/react-node)
- **3D Extension**: Use 3D nodes through `@antv/g6-extension-3d`
## Built-in Element Reference
### Node Types
- [Built-in Node Library](/en/manual/element/node/base-node)
### Edge Types
- [Built-in Edge Library](/en/manual/element/edge/base-edge)
### Combo Types
- [Built-in Combo Library](/en/manual/element/combo/base-combo)
Element Skill
packages/site/docs/manual/element/overview.zh.md anthropic-skill ~843 tokens---
title: 元素总览
order: 1
---
## 元素体系
G6 图表的核心是由三种基本元素构成:**节点(Node)**、**边(Edge)** 和 **组合(Combo)**。这些元素是构建复杂图形网络的基础单元。
<image width="400" src="https://mdn.alipayobjects.com/huamei_qa8qxu/afts/img/A*2ZewT4T1p_4AAAAAAAAAAAAADmJ7AQ/original" />
### 节点 (Node)
[节点](/manual/element/node/overview) 表示图中的实体或概念,如人物、地点、对象等。G6 提供了丰富的内置节点类型:
<image width="300" src="https://mdn.alipayobjects.com/huamei_qa8qxu/afts/img/A*TZt2S7Z0d-8AAAAAAAAAAAAADmJ7AQ/original" />
G6 还支持 [使用 React 定义节点](/manual/element/node/react-node) 或 [自定义节点](/manual/element/node/custom-node) 以满足特定需求。
### 边 (Edge)
[边](/manual/element/edge/overview)表示节点间的连接关系,如朋友关系、交易往来等。G6 内置多种边类型:
<image width="300" src="https://mdn.alipayobjects.com/huamei_qa8qxu/afts/img/A*YKN7TasqOh4AAAAAAAAAAAAADmJ7AQ/original" />
当内置边不满足需求时,可以通过 [自定义边](/manual/element/edge/custom-edge) 来实现复杂的连接表现。
### 组合 (Combo)
[组合](/manual/element/combo/overview)是一种特殊元素,可以包含节点和其他组合,用于表示集合、分组或层级关系。G6 内置两种组合类型:
- **圆形组合**(`circle`):适合紧凑型分组
- **矩形组合**(`rect`):适合规则布局的分组
<image width="450" src="https://mdn.alipayobjects.com/huamei_qa8qxu/afts/img/A*zPAzSZ3XxpUAAAAAAAAAAAAADmJ7AQ/original" />
组合支持嵌套、拖拽、展开/收起等交互,可以通过 [自定义组合](/manual/element/combo/custom-combo) 来实现更复杂的容器行为。
## 元素构成原理
每个元素由一个或多个基础图形(Shape)组成。图形是 G6 中的最小图形单元,包括 [矩形](/manual/element/shape/properties#rectstyleprops)、[圆形](/manual/element/shape/properties#circlestyleprops)、[文本](/manual/element/shape/properties#textstyleprops)、[路径](/manual/element/shape/properties#pathstyleprops)等。
例如:
- 一个节点可能由背景图形(如圆形)和文本标签组成
- 一条边可能由路径、箭头和文本标签组成
- 一个组合可能由容器图形、标题文本和展开/收起按钮组成
要了解更多关于图形的信息,请参阅 [图形 Shape 总览](/manual/element/shape/overview) 和 [Shape 样式属性](/manual/element/shape/properties)。
## 元素状态
[元素状态](/manual/element/state) 是一种强大的机制,用于展示元素在不同交互或业务场景下的视觉变化。G6 提供了一套完整的状态管理系统:
- **预设状态**:`selected`(选中)、`highlight`(高亮)、`active`(激活)等
- **状态叠加**:元素可同时拥有多个状态,样式按优先级叠加
- **自定义状态**:可根据业务需求定义任意状态
<image width="500" src="https://mdn.alipayobjects.com/huamei_qa8qxu/afts/img/A*yVbORYybrDQAAAAAAAAAAAAADmJ7AQ/original" />
## 配置元素
G6 5.x 采用扁平化的配置结构,所有元素的配置都在同一层级,便于查找和管理:
```typescript
{
node: {
// 节点默认样式
style: {
fill: 'orange',
labelText: 'node',
},
// 节点在不同状态下的样式
state: {
selected: {
stroke: '#1890FF',
lineWidth: 2,
}
}
},
edge: {
// 边默认样式
style: {
stroke: '#aaa',
},
// 边在不同状态下的样式
state: {
highlight: {
stroke: 'red',
}
}
},
combo: {
// 组合默认样式
style: {
fill: 'lightblue',
stroke: 'blue',
}
}
};
```
配置方式有三种,按优先级从高到低:
1. **使用实例方法动态配置**:如 `graph.setNode()`、`graph.setEdge()`、`graph.setCombo()`
2. **实例化图时全局配置**:在 `new Graph()` 时指定配置项
3. **在数据中配置**:在节点、边、组合的数据对象中设置
在 VSCode 等编辑器中,你可以看到元素的全部可配置属性,并基于关键字进行搜索:
<image width="800" src="https://mdn.alipayobjects.com/huamei_qa8qxu/afts/img/A*oY_uTK80sIoAAAAAAAAAAAAADmJ7AQ/original" />
## 扩展能力
G6 提供了强大的扩展能力,满足各种自定义需求:
- **自定义节点**:[自定义节点指南](/manual/element/node/custom-node)
- **自定义边**:[自定义边指南](/manual/element/edge/custom-edge)
- **自定义组合**:[自定义组合指南](/manual/element/combo/custom-combo)
- **React 节点**:[使用 React 定义节点](/manual/element/node/react-node)
- **3D 扩展**:通过 `@antv/g6-extension-3d` 使用 3D 节点
## 内置元素参考
### 节点类型
- [内置节点库](/manual/element/node/base-node)
### 边类型
- [内置边库](/manual/element/edge/base-edge)
### 组合类型
- [内置组合库](/manual/element/combo/base-combo)
Shape Skill
packages/site/docs/manual/element/shape/label-shape.en.md anthropic-skill ~2,517 tokens---
title: Design and Implementation of Composite Shape
order: 3
---
G6 provides a flexible Shape mechanism, allowing developers to customize various graphics and efficiently reuse them in elements such as nodes, edges, and combos. This article uses Label as an example to explain how to customize a Shape and how to apply it in elements.
<img src="https://mdn.alipayobjects.com/huamei_qa8qxu/afts/img/A*W3oqSYPZtWEAAAAAAAAAAAAAemJ7AQ/original" width="80" />
## 1. Customization and Encapsulation of Shape
### 1. Base Class Design of Shape
All Shapes inherit from `BaseShape`, which centrally manages the lifecycle (creation, update, destruction), property parsing, animation, event binding, etc. You only need to focus on implementing the `render` method.
**Core Abstraction:**
```js
import { CustomElement } from '@antv/g';
abstract class BaseShape extends CustomElement {
// Lifecycle management, property parsing, animation, etc...
public abstract render(attributes, container): void;
}
```
### 2. Hierarchical Structure of Composite Shape
A node usually contains multiple child Shapes, for example:
```
Node
├── keyShape (main shape)
├── label (label, auxiliary information)
│ ├── text
│ └── rect
├── icon
│ ├── text
│ └── image
├── badge
│ ├── text
│ └── rect
└── port
│ ├── circle
```
<img width="200" src="https://mdn.alipayobjects.com/huamei_qa8qxu/afts/img/A*Ot4bSbBx97EAAAAAAAAAAAAADmJ7AQ/original" />
### 3. Implementation of Label Shape
Label is a typical composite Shape, consisting of text (Text) and an optional background (Rect). The implementation idea is as follows:
- **Property Separation**: The style properties of Label are divided into text style and background style, which are passed to Text and Rect respectively.
- **Smart Layout**: The background automatically adjusts its size and position based on the text content, padding, border radius, etc.
- **Reuse upsert**: The `upsert` method is used to automatically manage the creation, update, and destruction of child Shapes.
**Main code snippet of Label:**
```js
import { Text, Rect } from '@antv/g'; // Import atomic graphics
export class Label extends BaseShape {
public render(attributes = this.parsedAttributes, container= this): void {
this.upsert('text', Text, this.getTextStyle(attributes), container);
this.upsert('background', Rect, this.getBackgroundStyle(attributes), container);
}
// ... Omitted style extraction methods
}
```
- `getTextStyle` and `getBackgroundStyle` extract the style properties for text and background respectively to avoid interference.
- The `upsert` method ensures automatic CRUD of Shapes, greatly improving reusability and robustness.
### 4. Complete Custom Shape Example
Below is an example of customizing a label with special decoration, demonstrating the complete definition, registration, and usage of a Shape:
```js
import { BaseShape, ExtensionCategory, Circle } from 'g6';
import { Text, Rect, Circle } from '@antv/g';
class FancyLabel extends BaseShape {
render(attributes = this.parsedAttributes, container = this) {
// Main text
this.upsert('text', Text, this.getTextStyle(attributes), container);
// Background
this.upsert('background', Rect, this.getBackgroundStyle(attributes), container);
// Extra decoration: small dot on the left
this.upsert('dot', Circle, {
x: -8, y: 0, r: 3, fill: '#faad14',
}, container);
}
// ...implement getTextStyle/getBackgroundStyle
}
// Register custom Shape
register(ExtensionCategory.SHAPE, 'fancy-label-shape', FancyLabel);
// Define custom node
class CustomCircle extends Circle {
public drawFancyLabelShape(attributes, container) {
this.upsert('fancy-label', 'fancy-label-shape', this.getFancyLabelStyle(attributes), container);
}
render(attributes = this.parsedAttributes, container) {
super.render(attributes, container);
this.drawFancyLabelShape(attributes, container);
}
}
// Register custom node
register(ExtensionCategory.Node, 'fancy-label-node', CustomCircle);
```
## 2. Prefix Separation of Style Properties
In G6, elements such as nodes, edges, and combos often contain multiple child Shapes (such as main shape, label, badge, port, etc.). To ensure that the style of each child Shape does not interfere with each other, G6 adopts a **prefix separation** design for style properties.
### 1. Significance of Prefix Separation
- **Decoupling**: Each child Shape only cares about its own style properties, avoiding style pollution.
- **Easy Expansion**: Adding a new child Shape only requires defining a new prefix, without modifying the original logic.
- **Intuitive Configuration**: When configuring nodes/edges/combos, users can clearly set the style of each part.
### 2. Code Implementation
Take Label as an example:
```ts
import { RectStyleProps, TextStyleProps } from '@antv/g';
type PrefixKey<P extends string = string, K extends string = string> = `${P}${Capitalize<K>}`;
type Prefix<P extends string, T extends object> = {
[K in keyof T as K extends string ? PrefixKey<P, K> : never]?: T[K];
};
interface LabelStyleProps extends TextStyleProps, Prefix<'background', RectStyleProps> {
background?: boolean;
}
```
- `Prefix<'background', RectStyleProps>` means all properties starting with `background` belong to the label background style.
- During rendering, tools such as `subStyleProps` and `subObject` are used to automatically extract prefixed styles and pass them to the corresponding Shape.
**Label background style extraction example**
```js
protected getBackgroundStyle(attributes: Required<LabelStyleProps>) {
if (attributes.background === false) return false;
const style = this.getGraphicStyle(attributes);
const backgroundStyle = subStyleProps<RectStyleProps>(style, 'background');
// ...Omitted layout calculation
return backgroundStyle;
}
```
**Style configuration example**
```json
{
"text": "label",
"fontSize": 12,
"fontFamily": "system-ui, sans-serif",
"wordWrap": true,
"maxLines": 1,
"wordWrapWidth": 128,
"textOverflow": "...",
"textBaseline": "middle",
"background": true,
"backgroundOpacity": 0.75,
"backgroundZIndex": -1,
"backgroundLineWidth": 0
}
```
## 3. Relationship between Label and keyShape
- **keyShape** is the main shape of a node/edge/combo, determining interaction picking, bounding box, main style, etc.
- **Label**, icon, badge, port, etc. usually exist as auxiliary Shapes and are not used as keyShape.
- When customizing a node, you can specify the keyShape via `drawKeyShape` or similar methods. Label is only responsible for displaying text information and does not affect the main interaction control of the node.
## 4. How to Apply Custom Shape in Elements
Take nodes as an example. The node base class `BaseNode` has built-in support for multiple child Shapes (keyShape, label, icon, badge, port, halo, etc.). You only need to focus on drawing the keyShape, and other child Shapes can be automatically managed through configuration and style prefixing.
### 1. Node Rendering Process
```js
protected drawLabelShape(attributes: Required<S>, container: Group): void {
const style = this.getLabelStyle(attributes);
this.upsert('label', Label, style, container);
}
public render(attributes = this.parsedAttributes, container: Group = this) {
// 1. Draw keyShape (main shape)
this._drawKeyShape(attributes, container);
if (!this.getShape('key')) return;
// 2. Draw halo
this.drawHaloShape(attributes, container);
// 3. Draw icon
this.drawIconShape(attributes, container);
// 4. Draw badges
this.drawBadgeShapes(attributes, container);
// 5. Draw label
this.drawLabelShape(attributes, container);
// 6. Draw ports
this.drawPortShapes(attributes, container);
}
```
- The style of each child Shape is automatically extracted by prefix separation and passed to the corresponding Shape instance.
- You can flexibly control the display and style of each child Shape through configuration options.
### 2. Example of Applying Label
Suppose you want to add a label with a background to a node, just configure the label-related properties in the node data:
```js
{
label: true,
labelText: 'I am a label',
labelFill: '#333',
labelFontSize: 14,
labelBackground: true,
labelBackgroundFill: '#fffbe6',
labelBackgroundRadius: 6,
labelPadding: [4, 8],
}
```
- `labelText`, `labelFill`, `labelFontSize`, etc. will be automatically extracted and passed to the text part of the Label.
- `labelBackground`, `labelBackgroundFill`, `labelBackgroundRadius`, `labelPadding`, etc. will be automatically extracted and passed to the background part of the Label.
You do not need to manually manage the creation, update, or destruction of the Label. G6 will handle it automatically.
## 5. Common Issues and Debugging Suggestions
### 1. Why is the label style not effective?
- Check whether the style property prefix is correct (such as `labelFill`, `labelBackgroundFill`).
- Make sure the `label` configuration of the node/edge/combo is `true` and `labelText` is set.
- Check if it is overridden by other styles.
### 2. How to debug the rendering of custom Shape?
- Use the browser console to view `shapeMap` and confirm whether each child Shape is created correctly.
### 3. How to make Label respond to node states (such as hover, selected)?
- Directly set node state styles in the graph configuration (recommended)
```js
const graph = new Graph({
node: {
style: {
label: false,
},
state: {
hover: {
label: true,
labelText: 'show when hovered',
},
},
},
});
```
- Or listen for state changes in the implementation of Label and dynamically adjust the style. You can get the current state value through data.
---
For more details, it is recommended to read the source code [`base-shape.ts`](https://github.com/antvis/G6/blob/v5/packages/g6/src/elements/shapes/base-shape.ts), [`base-node.ts`](https://github.com/antvis/G6/blob/v5/packages/g6/src/elements/shapes/base-node.ts).
Shape Skill
packages/site/docs/manual/element/shape/label-shape.zh.md anthropic-skill ~1,680 tokens---
title: 复合 Shape 的设计与实现
order: 3
---
G6 提供了灵活的 Shape 机制,支持开发者自定义各种图形,并在节点、边、Combo 等元素中高效复用。本文将以 Label(标签)为例,讲解如何自定义 Shape、如何在元素中应用。
<img src="https://mdn.alipayobjects.com/huamei_qa8qxu/afts/img/A*W3oqSYPZtWEAAAAAAAAAAAAAemJ7AQ/original" width="80" />
## 一、Shape 的自定义与封装
### 1. Shape 的基类设计
所有 Shape 都继承自 `BaseShape`,它统一管理了 Shape 的生命周期(创建、更新、销毁)、属性解析、动画、事件绑定等。你只需关注如何实现 `render` 方法即可。
**核心抽象:**
```js
import { CustomElement } from '@antv/g';
abstract class BaseShape extends CustomElement {
// 生命周期管理、属性解析、动画等...
public abstract render(attributes, container): void;
}
```
### 2. 复合 Shape 层级结构示意
一个节点通常包含多个子 Shape,例如:
```
节点(Node)
├── keyShape(主图形)
├── label(标签,辅助信息)
│ ├── text(文本)
│ └── rect(背景)
├── icon(图标)
│ ├── text(文本)
│ └── image(图片)
├── badge(徽标)
│ ├── text(文本)
│ └── rect(背景)
└── port(锚点)
│ ├── circle(圆形)
```
<img width="200" src="https://mdn.alipayobjects.com/huamei_qa8qxu/afts/img/A*Ot4bSbBx97EAAAAAAAAAAAAADmJ7AQ/original" />
### 3. Label Shape 的实现
Label 是一个典型的复合 Shape,由文本(Text)和可选的背景(Rect)组成。其实现思路如下:
- **属性分离**:Label 的样式属性分为文本样式和背景样式,分别传递给 Text 和 Rect。
- **智能布局**:背景自动根据文本内容、内边距、圆角等动态调整尺寸和位置。
- **复用 upsert**:通过 `upsert` 方法自动管理子 Shape 的创建、更新、销毁。
**Label 主要代码片段:**
```js
import { Text, Rect } from '@antv/g'; // 引入原子图形
export class Label extends BaseShape {
public render(attributes = this.parsedAttributes, container= this): void {
this.upsert('text', Text, this.getTextStyle(attributes), container);
this.upsert('background', Rect, this.getBackgroundStyle(attributes), container);
}
// ... 省略样式提取方法
}
```
- `getTextStyle`、`getBackgroundStyle` 分别提取文本和背景的样式属性,避免相互干扰。
- `upsert` 方法保证了 Shape 的自动增删改查,极大提升了复用性和健壮性。
### 4. 完整自定义 Shape 示例
下面以自定义一个带特殊装饰的标签为例,演示 Shape 的完整定义、注册与使用:
```js
import { BaseShape, ExtensionCategory, Circle } from 'g6';
import { Text, Rect, Circle } from '@antv/g';
class FancyLabel extends BaseShape {
render(attributes = this.parsedAttributes, container = this) {
// 主文本
this.upsert('text', Text, this.getTextStyle(attributes), container);
// 背景
this.upsert('background', Rect, this.getBackgroundStyle(attributes), container);
// 额外装饰:左侧小圆点
this.upsert('dot', Circle, {
x: -8, y: 0, r: 3, fill: '#faad14',
}, container);
}
// ...实现 getTextStyle/getBackgroundStyle
}
// 注册自定义 Shape
register(ExtensionCategory.SHAPE, 'fancy-label-shape', FancyLabel);
// 定义自定义节点
class CustomCircle extends Circle {
public drawFancyLabelShape(attributes, container) {
this.upsert('fancy-label', 'fancy-label-shape', this.getFancyLabelStyle(attributes), container);
}
render(attributes = this.parsedAttributes, container) {
super.render(attributes, container);
this.drawFancyLabelShape(attributes, container);
}
}
// 注册自定义节点
register(ExtensionCategory.Node, 'fancy-label-node', CustomCircle);
```
## 二、样式属性的前缀分离
G6 中节点、边、Combo 等元素往往包含多个子 Shape(如主图形、标签、徽标、锚点等)。为了让每个子 Shape 的样式互不干扰,G6 采用了**样式属性前缀分离**的设计。
### 1. 前缀分离的意义
- **解耦**:每个子 Shape 只关心属于自己的样式属性,避免样式污染。
- **易扩展**:新增子 Shape 只需定义新的前缀,无需修改原有逻辑。
- **配置直观**:用户在配置节点/边/Combo 时,可以一目了然地设置各部分样式。
### 2. 代码实现
以 Label 为例:
```ts
import { RectStyleProps, TextStyleProps } from '@antv/g';
type PrefixKey<P extends string = string, K extends string = string> = `${P}${Capitalize<K>}`;
type Prefix<P extends string, T extends object> = {
[K in keyof T as K extends string ? PrefixKey<P, K> : never]?: T[K];
};
interface LabelStyleProps extends TextStyleProps, Prefix<'background', RectStyleProps> {
background?: boolean;
}
```
- `Prefix<'background', RectStyleProps>` 表示所有以 `background` 开头的属性都属于标签背景样式。
- 在实际渲染时,通过 `subStyleProps`、`subObject` 等工具函数,自动提取带前缀的样式,传递给对应的 Shape。
**Label 背景样式提取示例**
```js
protected getBackgroundStyle(attributes: Required<LabelStyleProps>) {
if (attributes.background === false) return false;
const style = this.getGraphicStyle(attributes);
const backgroundStyle = subStyleProps<RectStyleProps>(style, 'background');
// ...省略布局计算
return backgroundStyle;
}
```
**样式配置示例**
```json
{
"text": "label",
"fontSize": 12,
"fontFamily": "system-ui, sans-serif",
"wordWrap": true,
"maxLines": 1,
"wordWrapWidth": 128,
"textOverflow": "...",
"textBaseline": "middle",
"background": true,
"backgroundOpacity": 0.75,
"backgroundZIndex": -1,
"backgroundLineWidth": 0
}
```
## 三、Label 与 keyShape 的关系
- **keyShape** 是节点/边/Combo 的主图形,决定交互拾取、包围盒、主样式等。
- **Label**、icon、badge、port 等通常作为辅助 Shape 存在,不会作为 keyShape。
- 你可以在自定义节点时通过 `drawKeyShape` 或类似方法指定 keyShape,Label 只负责展示文本信息,不影响节点的交互主控。
## 四、如何在元素中应用自定义 Shape
以节点为例,节点基类 `BaseNode` 已经内置了对多种子 Shape 的支持(keyShape、label、icon、badge、port、halo 等)。你只需专注于 keyShape 的绘制,其他子 Shape 可以通过配置和样式前缀自动管理。
### 1. 节点渲染流程
```js
protected drawLabelShape(attributes: Required<S>, container: Group): void {
const style = this.getLabelStyle(attributes);
this.upsert('label', Label, style, container);
}
public render(attributes = this.parsedAttributes, container: Group = this) {
// 1. 绘制 keyShape(主图形)
this._drawKeyShape(attributes, container);
if (!this.getShape('key')) return;
// 2. 绘制 halo
this.drawHaloShape(attributes, container);
// 3. 绘制 icon
this.drawIconShape(attributes, container);
// 4. 绘制 badges
this.drawBadgeShapes(attributes, container);
// 5. 绘制 label
this.drawLabelShape(attributes, container);
// 6. 绘制 ports
this.drawPortShapes(attributes, container);
}
```
- 每个子 Shape 的样式都通过前缀分离自动提取,传递给对应的 Shape 实例。
- 你可以通过配置项灵活控制每个子 Shape 的显示与样式。
### 2. 应用 Label 的示例
假设你要为节点添加带背景的标签,只需在节点数据中配置 label 相关属性:
```js
{
label: true,
labelText: '我是标签',
labelFill: '#333',
labelFontSize: 14,
labelBackground: true,
labelBackgroundFill: '#fffbe6',
labelBackgroundRadius: 6,
labelPadding: [4, 8],
}
```
- `labelText`、`labelFill`、`labelFontSize` 等会被自动提取并传递给 Label 的文本部分。
- `labelBackground`、`labelBackgroundFill`、`labelBackgroundRadius`、`labelPadding` 等会被自动提取并传递给 Label 的背景部分。
你无需手动管理 Label 的创建、更新、销毁,G6 会自动完成。
## 五、常见问题与调试建议
### 1. 为什么 label 样式没有生效?
- 检查样式属性前缀是否正确(如 `labelFill`、`labelBackgroundFill`)。
- 确认节点/边/Combo 的 `label` 配置为 `true`,且 `labelText` 已设置。
- 检查是否被其他样式覆盖。
### 2. 如何调试自定义 Shape 的渲染?
- 使用浏览器控制台查看 `shapeMap`,确认各子 Shape 是否被正确创建。
### 3. 如何让 Label 响应节点状态(如 hover、selected)?
- 直接在图配置中设置节点状态样式(推荐)
```js
const graph = new Graph({
node: {
style: {
label: false,
},
state: {
hover: {
label: true,
labelText: 'show when hovered',
},
},
},
});
```
- 或者在 Label 的实现中监听状态变化,动态调整样式。可以通过 data 获取到当前的状态值
---
如需更深入了解,建议阅读源码 [`base-shape.ts`](https://github.com/antvis/G6/blob/v5/packages/g6/src/elements/shapes/base-shape.ts)、[`base-node.ts`](https://github.com/antvis/G6/blob/v5/packages/g6/src/elements/shapes/base-node.ts)。
Shape Skill
packages/site/docs/manual/element/shape/overview.en.md anthropic-skill ~1,489 tokens---
title: Shape and KeyShape
order: 1
---
## Shape
A Shape in G6 refers to a graphical element, such as a circle, rectangle, or path. Shapes are generally associated with nodes, edges, or combos in G6. **💡 Every node/edge/combo in G6 is composed of one or more shapes. The style configuration of nodes, edges, and combos is reflected on their corresponding shapes.**
For example, in the images below: the node on the left contains a single circular shape; the node in the middle contains a circle and a text shape; the node on the right contains five circles (the blue-green main circle and four anchor points at the top, bottom, left, and right) and a text shape. Each node/edge/combo has its unique key shape (keyShape). In the examples below, the keyShape for all three nodes is the blue-green circle. The keyShape is mainly used for interaction detection and automatic style updates with [element states](/en/manual/element/state), see [keyShape](#keyshape).
<img src='https://gw.alipayobjects.com/mdn/rms_f8c6a0/afts/img/A*OcaaTIIu_4cAAAAAAAAAAABkARQnAQ' width=50 alt='img'/><img src='https://gw.alipayobjects.com/mdn/rms_f8c6a0/afts/img/A*r5M0Sowd1R8AAAAAAAAAAABkARQnAQ' width=50 alt='img'/><img src='https://gw.alipayobjects.com/mdn/rms_f8c6a0/afts/img/A*pHoETad75CIAAAAAAAAAAABkARQnAQ' width=50 alt='img'/>
> (Left) A node with only one circular shape, whose keyShape is the circle. (Middle) A node with a circle and a text shape, whose keyShape is the circle. (Right) A node with a main circle, text, and four small circles at the top, bottom, left, and right, whose keyShape is the main circle.
G6 uses different combinations of shapes to design various built-in nodes/edges/combos. Built-in nodes include 'circle', 'rect', 'ellipse', ... (see [Built-in Nodes](/en/manual/element/node/base-node)); built-in edges include 'line', 'polyline', 'cubic', ... (see [Built-in Edges](/en/manual/element/edge/base-edge)); built-in combos include 'circle', 'rect', ... (see [Built-in Combos](/en/manual/element/combo/base-combo)).
In addition to using built-in nodes/edges/combos, G6 also allows users to customize nodes/edges/combos by combining shapes as needed. See [Custom Node](/en/manual/element/node/custom-node), [Custom Edge](/en/manual/element/edge/custom-edge), and [Custom Combo](/en/manual/element/combo/custom-combo) for details.
## KeyShape
In G6, each node, edge, or combo consists of one or more shapes, but one of them is called the keyShape, which is the "key graphical element" of the item:
<image width="300" src="https://mdn.alipayobjects.com/huamei_qa8qxu/afts/img/A*TZt2S7Z0d-8AAAAAAAAAAAAADmJ7AQ/original" />
> The key graphical element of the node is the colored area in the image above.
### Bounding Box Determination
**Determines the bounding box of a node/combo**, which is used to calculate the connection point of related edges (the intersection with the edge). If the keyShape is different, the intersection calculation between the node and the edge will also differ.
#### Example
In this example, a node consists of a rect shape and a circle shape with a gray stroke and transparent fill.
- When the node's keyShape is the circle:
<img src='https://gw.alipayobjects.com/mdn/rms_f8c6a0/afts/img/A*CY7cSaMs4U0AAAAAAAAAAABkARQnAQ' width=220 alt='img'/>
- When the node's keyShape is the rect:
<img src='https://gw.alipayobjects.com/mdn/rms_f8c6a0/afts/img/A*upWTQLTvxGEAAAAAAAAAAABkARQnAQ' width=250 alt='img'/>
## Shape Lifecycle
> If you need to [customize nodes](/en/manual/element/node/custom-node), [customize edges](/en/manual/element/edge/custom-edge), or [customize combos](/en/manual/element/combo/custom-combo), you need to understand the lifecycle of shapes. If you use built-in nodes/edges/combos, you can skip this section.
The shape lifecycle includes:
- **Initial Rendering**: Draws the shape for the first time based on data and style configuration.
- **Update**: Automatically updates the appearance of the shape when data or style changes.
- **Operation**: Responds to interaction states (such as selected, active, hover, etc.) and dynamically adjusts the style.
- **Destruction**: Cleans up when the shape is removed (usually managed automatically by the Graph, so users don't need to worry).
When customizing shapes, the most common requirement is "how to efficiently manage the creation, update, and destruction of shapes." For this, G6 provides a very useful method in BaseShape:
### Principle and Advantages of upsert
upsert is a combination of "update" and "insert", meaning "update if exists, insert if not". Its function can be simply understood as:
- **Automatic Judgment**: You only need to describe the desired appearance of the shape. `upsert` will automatically determine whether the shape already exists. If not, it will create it; if it exists, it will update it; if it needs to be deleted, it will remove it automatically.
- **Simplified Logic**: Developers do not need to manually manage the CRUD of shapes, avoiding duplicate code and state confusion.
- **Improved Robustness**: Whether it's the initial rendering, data changes, or state switching, upsert ensures that the shape always stays in sync with the data and configuration.
**Type Definition:**
```js
/**
* Create, update, or delete a shape
* @param className Shape name
* @param Ctor Shape type
* @param style Shape style. Pass false to delete the shape
* @param container Container
* @param hooks Hooks
* @returns Shape instance
*/
upsert<T extends DisplayObject>(
className: string,
Ctor: string | { new (...args: any[]): T },
style: T['attributes'] | false,
container: DisplayObject,
hooks?: UpsertHooks,
): T | undefined {}
```
You only need to describe "what kind of shape you want now" without worrying about whether it is being created, updated, or deleted. upsert will handle it for you. This makes customizing and managing complex composite shapes very simple and safe.
Shape Skill
packages/site/docs/manual/element/shape/overview.zh.md anthropic-skill ~819 tokens---
title: 图形 Shape 与 KeyShape
order: 1
---
## 图形 Shape
Shape 指 G6 中的图形、形状,可以是圆形、矩形、路径等。它一般与 G6 中的节点、边、Combo 相关。**💡 G6 中的每一种节点/边/Combo 都是由一个或多个 Shape 组合而成。节点、边、Combo 的样式配置都会被体现到对应的图形上。**
例如下图(左)的节点包含了一个圆形图形;下图(中)的节点含有一个圆形和一个文本图形;下图(右)的节点中含有 5 个圆形(蓝绿色的圆和上下左右四个锚点)、一个文本图形。但每种节点/边/Combo 都会有自己的唯一关键图形 keyShape,下图中三个节点的 keyShape 都是蓝绿色的圆,keyShape 主要用于交互检测、样式随 [元素状态](/manual/element/state) 自动更新等,见 [keyShape](#keyshape)。
<img src='https://gw.alipayobjects.com/mdn/rms_f8c6a0/afts/img/A*OcaaTIIu_4cAAAAAAAAAAABkARQnAQ' width=50 alt='img'/><img src='https://gw.alipayobjects.com/mdn/rms_f8c6a0/afts/img/A*r5M0Sowd1R8AAAAAAAAAAABkARQnAQ' width=50 alt='img'/><img src='https://gw.alipayobjects.com/mdn/rms_f8c6a0/afts/img/A*pHoETad75CIAAAAAAAAAAABkARQnAQ' width=50 alt='img'/>
> (左)只含有一个圆形图形的节点,keyShape 是该圆形。(中)含有圆形和文本图形的节点,keyShape 是圆形。(右)含有主要圆形、文本、上下左右四个小圆形的节点,keyShape 是圆形。
G6 使用不同的 shape 组合,设计了多种内置的节点/边/ Combo 。G6 内置节点的有 'circle', 'rect','ellipse',...(详见 [内置节点](/manual/element/node/base-node));内置边的有 'line','polyline','cubic',...(详见 [内置边](/manual/element/edge/base-edge));内置 Combo 有 'circle','rect',(详见 [内置 Combo](/manual/element/combo/base-combo))。
除了使用内置的节点/边/ Combo 外,G6 还允许用户通过自己搭配和组合 shape 进行节点/边/ Combo 的自定义,详见 [自定义节点](/manual/element/node/custom-node),[自定义边](/manual/element/edge/custom-edge),[自定义 Combo](/manual/element/combo/custom-combo)。
## KeyShape
在 G6 中,每个节点、边、Combo 都由一个或多个 Shape 组成,但其中有一个 Shape 被称为 keyShape,它是该元素的“关键图形”:
<image width="300" src="https://mdn.alipayobjects.com/huamei_qa8qxu/afts/img/A*TZt2S7Z0d-8AAAAAAAAAAAAADmJ7AQ/original" />
> 节点的关键图形就是上图的颜色区域
### 包围盒确定
**确定节点 / Combo 的包围盒(Bounding Box)** ,从而计算相关边的连入点(与相关边的交点)。若 keyShape 不同,节点与边的交点计算结果不同。
#### 示例
本例中的一个节点由一个 rect 图形和一个带灰色描边、填充透明的 circle 图形构成。
- 当节点的 keyShape 为 circle 时:
<img src='https://gw.alipayobjects.com/mdn/rms_f8c6a0/afts/img/A*CY7cSaMs4U0AAAAAAAAAAABkARQnAQ' width=220 alt='img'/>
- 当节点的 keyShape 为 rect 时:
<img src='https://gw.alipayobjects.com/mdn/rms_f8c6a0/afts/img/A*upWTQLTvxGEAAAAAAAAAAABkARQnAQ' width=250 alt='img'/>
## Shape 的生命周期
> 当用户需要 [自定义节点](/manual/element/node/custom-node)、[自定义边](/manual/element/edge/custom-edge)、[自定义 Combo](/manual/element/combo/custom-combo) 时,需要了解 Shape 的生命周期。使用内置节点/边/Combo 则可以跳过这一部分内容。
从整体来看,Shape 的生命周期分为:
- **初始化渲染**:首次根据数据和样式配置绘制出 Shape。
- **更新**:当数据或样式发生变化时,自动更新 Shape 的表现。
- **操作**:响应交互状态(如 selected、active、hover 等),动态调整样式。
- **销毁**:Shape 被移除时的清理(通常由 Graph 自动管理,用户无需关心)。
在自定义 Shape 时,最常见的需求就是“如何高效地管理 Shape 的创建、更新和销毁”。G6 为此在 BaseShape 中设计了一个非常实用的方法:
### upsert 的原理与优势
upsert 是“update” 和 “insert” 的合成词,意思是“有则更新,无则创建”。它的作用可以简单理解为:
- **自动判断**:你只需描述希望 Shape 呈现的样子,`upsert` 会自动判断当前 Shape 是否已存在。如果不存在则创建,如果已存在则更新,如果需要删除则自动移除。
- **简化逻辑**:开发者无需手动管理 Shape 的增删改查,避免了重复代码和状态混乱。
- **提升健壮性**:无论是初次渲染、数据变更还是状态切换,upsert 都能保证 Shape 始终与数据和配置保持同步。
**类型定义:**
```js
/**
* 创建、更新或删除图形
* @param className 图形名称
* @param Ctor 图形类型
* @param style 图形样式。若要删除图形,传入 false
* @param container 容器
* @param hooks 钩子函数
* @returns 图形实例
*/
upsert<T extends DisplayObject>(
className: string,
Ctor: string | { new (...args: any[]): T },
style: T['attributes'] | false,
container: DisplayObject,
hooks?: UpsertHooks,
): T | undefined {}
```
你只需要描述“我现在想要什么样的图形”,不用关心它是新建、更新还是删除,upsert 都会帮你处理好。这让自定义和管理复杂的复合 Shape 变得非常简单和安全。
Shape Skill
packages/site/docs/manual/element/shape/properties.en.md anthropic-skill ~4,937 tokens---
title: Atomic Shapes and Their Properties
order: 2
---
Elements (nodes/edges) in G6 are composed of **one or more [shapes](/en/manual/element/shape/overview)**, mainly added via `upsert` in the `render` method when customizing nodes or edges. G6 supports the following shapes:
1. [Circle](#circlestyleprops)
2. [Ellipse](#ellipsestyleprops)
3. [Rect](#rectstyleprops)
4. [HTML Element](#htmlstyleprops)
5. [Image](#imagestyleprops)
6. [Line](#linestyleprops)
7. [Path](#pathstyleprops)
8. [Polygon](#polygonstyleprops)
9. [Polyline](#polylinestyleprops)
10. [Text](#textstyleprops)
## Common Properties of All Shapes
### BaseShapeStyle
| Property | Description | Type | Required |
| -------------- | ------------------------------------------------------------------------------------------------ | ---------------------------------------- | -------- |
| x | x coordinate | number | ✓ |
| y | y coordinate | number | ✓ |
| width | Width | number | ✓ |
| height | Height | number | ✓ |
| fill | Fill color | string \| Pattern \| null | |
| stroke | Stroke color | string \| Pattern \| null | |
| opacity | Overall opacity | number \| string | |
| fillOpacity | Fill opacity | number \| string | |
| strokeOpacity | Stroke opacity | number \| string | |
| lineWidth | Line width | number \| string | |
| lineCap | Line cap style | `butt` \| `round` \| `square` | |
| lineJoin | Line join style | `miter` \| `round` \| `bevel` | |
| lineDash | Dash array | number \| string \| (string \| number)[] | |
| lineDashOffset | Dash offset | number | |
| shadowBlur | Shadow blur | number | |
| shadowColor | Shadow color | string | |
| shadowOffsetX | Shadow X offset | number | |
| shadowOffsetY | Shadow Y offset | number | |
| cursor | Mouse cursor, supports all [CSS cursor](https://developer.mozilla.org/en-US/docs/Web/CSS/cursor) | string | |
| zIndex | Render z-index | number | |
| visibility | Visibility | `visible` \| `hidden` | |
**Example:**
```js
const shape = BaseShape.upsert(
// Specify the shape key, which must be unique within the same custom element type
'shape',
'circle',
{
cx: 100,
cy: 100,
r: 50,
fill: 'blue',
},
container,
);
```
## Common Methods of All Shapes
### attr()
Set or get the drawing attributes of the instance.
### attr(name)
Get the value of an attribute.
```js
const width = shape.attr('width');
```
### attr(name, value)
Update a single drawing attribute.
### attr({...})
Batch update drawing attributes.
```js
shape.attr({
fill: '#999',
stroke: '#666',
});
```
## Circle Shape
### CircleStyleProps
| Property | Description | Type | Required |
| ----------------- | ----------------------------------------- | ---------------- | -------- |
| cx | Center x coordinate | number \| string | ✓ |
| cy | Center y coordinate | number \| string | ✓ |
| cz | Center z coordinate | number \| string | |
| r | Radius | number \| string | ✓ |
| isBillboard | Billboard mode (always faces camera) | boolean | |
| isSizeAttenuation | Size attenuation (size changes with view) | boolean | |
**Example:**
```js
BaseShape.upsert(
'shape',
'circle',
{
cx: 100,
cy: 100,
r: 50,
fill: 'blue',
},
container,
);
```
## Rect Shape
### RectStyleProps
| Property | Description | Type | Required |
| ----------------- | ----------------- | ---------------------------- | -------- |
| x | Rect x coordinate | number \| string | |
| y | Rect y coordinate | number \| string | |
| z | Rect z coordinate | number | |
| width | Rect width | number \| string | ✓ |
| height | Rect height | number \| string | ✓ |
| isBillboard | Billboard mode | boolean | |
| isSizeAttenuation | Size attenuation | boolean | |
| radius | Border radius | number \| string \| number[] | |
**Example:**
```js
BaseShape.upsert(
'shape',
'rect',
{
x: 100,
y: 100,
width: 100,
height: 100,
radius: 8,
fill: 'blue',
},
container,
);
```
## Ellipse Shape
### EllipseStyleProps
| Property | Description | Type | Required |
| ----------------- | ------------------- | ---------------- | -------- |
| cx | Center x coordinate | number \| string | ✓ |
| cy | Center y coordinate | number \| string | ✓ |
| cz | Center z coordinate | number \| string | |
| rx | X-axis radius | number \| string | ✓ |
| ry | Y-axis radius | number \| string | ✓ |
| isBillboard | Billboard mode | boolean | |
| isSizeAttenuation | Size attenuation | boolean | |
**Example:**
```js
BaseShape.upsert(
'shape',
'ellipse',
{
cx: 100,
cy: 100,
rx: 50,
ry: 80,
fill: 'blue',
},
container,
);
```
## HTML DOM
### HTMLStyleProps
| Property | Description | Type | Required |
| --------- | ----------------- | --------------------- | -------- |
| x | HTML x coordinate | number \| string | |
| y | HTML y coordinate | number \| string | |
| innerHTML | HTML content | string \| HTMLElement | ✓ |
| width | HTML width | number \| string | |
| height | HTML height | number \| string | |
**Example:**
```js
BaseShape.upsert(
'shape',
'html',
{
x: 100,
y: 100,
innerHTML: <div>content</div>,
},
container,
);
```
## Image Shape
### ImageStyleProps
| Property | Description | Type | Required |
| ----------------- | -------------------------------- | -------------------------- | -------- |
| x | Image x coordinate | number \| string | |
| y | Image y coordinate | number \| string | |
| z | Image z coordinate | number | |
| src | Image source or HTMLImageElement | string \| HTMLImageElement | ✓ |
| width | Image width | number \| string | |
| height | Image height | number \| string | |
| isBillboard | Billboard mode | boolean | |
| isSizeAttenuation | Size attenuation | boolean | |
| billboardRotation | Billboard rotation angle | number | |
| keepAspectRatio | Keep original aspect ratio | boolean | |
**Example:**
```js
BaseShape.upsert(
'shape',
'image',
{
x: 100,
y: 100,
src: 'http://',
},
container,
);
```
## Line Shape
### LineStyleProps
| Property | Description | Type | Required |
| ----------------- | ------------------- | --------------------- | -------- |
| x1 | Start x coordinate | number | ✓ |
| y1 | Start y coordinate | number | ✓ |
| x2 | End x coordinate | number | ✓ |
| y2 | End y coordinate | number | ✓ |
| z1 | Start z coordinate | number | |
| z2 | End z coordinate | number | |
| isBillboard | Billboard mode | boolean | |
| isSizeAttenuation | Size attenuation | boolean | |
| markerStart | Marker at start | DisplayObject \| null | |
| markerEnd | Marker at end | DisplayObject \| null | |
| markerStartOffset | Start marker offset | number | |
| markerEndOffset | End marker offset | number | |
**Example:**
```js
BaseShape.upsert(
'shape',
'line',
{
x1: 100,
y1: 100,
x2: 150,
y2: 150,
stroke: 'blue',
},
container,
);
```
## Path Shape
### PathStyleProps
| Property | Description | Type | Required |
| ----------------- | -------------------- | ---------------------- | -------- |
| d | Path string or array | string \| PathArray | ✓ |
| markerStart | Marker at start | DisplayObject \| null | |
| markerEnd | Marker at end | DisplayObject \| null | |
| markerMid | Marker at middle | DisplayObject \| null | |
| markerStartOffset | Start marker offset | number | |
| markerEndOffset | End marker offset | number | |
| isBillboard | Billboard mode | boolean | |
| isSizeAttenuation | Size attenuation | boolean | |
| fillRule | Fill rule | `nonzero` \| `evenodd` | |
**Example:**
```js
BaseShape.upsert(
'shape',
'path',
{
d: 'M 0,0 L 20,10 L 20,-10 Z',
stroke: 'blue',
},
container,
);
```
## Polygon Shape
### PolygonStyleProps
| Property | Description | Type | Required |
| ----------------- | ----------------------- | ------------------------------------------------ | -------- |
| points | Array of polygon points | ([number, number] \| [number, number, number])[] | ✓ |
| markerStart | Marker at start | DisplayObject \| null | |
| markerEnd | Marker at end | DisplayObject \| null | |
| markerMid | Marker at middle | DisplayObject \| null | |
| markerStartOffset | Start marker offset | number | |
| markerEndOffset | End marker offset | number | |
| isClosed | Is polygon closed | boolean | |
| isBillboard | Billboard mode | boolean | |
| isSizeAttenuation | Size attenuation | boolean | |
**Example:**
```js
BaseShape.upsert(
'shape',
'polygon',
{
points: [
[30, 30],
[40, 20],
[30, 50],
[60, 100],
],
fill: 'red',
},
container,
);
```
## Polyline Shape
### PolylineStyleProps
| Property | Description | Type | Required |
| ----------------- | ------------------------ | ------------------------------------------------ | -------- |
| points | Array of polyline points | ([number, number] \| [number, number, number])[] | ✓ |
| markerStart | Marker at start | DisplayObject \| null | |
| markerEnd | Marker at end | DisplayObject \| null | |
| markerMid | Marker at middle | DisplayObject \| null | |
| markerStartOffset | Start marker offset | number | |
| markerEndOffset | End marker offset | number | |
| isBillboard | Billboard mode | boolean | |
| isSizeAttenuation | Size attenuation | boolean | |
**Example:**
```js
BaseShape.upsert(
'shape',
'polyline',
{
points: [
[30, 30],
[40, 20],
[30, 50],
[60, 100],
],
fill: 'red',
},
container,
);
```
## Text
### TextStyleProps
| Property | Description | Type | Required |
| ------------------- | ------------------------ | --------------------------------------------------------------------------- | -------- |
| x | Text x coordinate | number \| string | |
| y | Text y coordinate | number \| string | |
| z | Text z coordinate | number \| string | |
| text | Text content | number \| string | ✓ |
| fontSize | Font size | number \| string | |
| fontFamily | Font family | string | |
| fontStyle | Font style | `normal` \| `italic` \| `oblique` | |
| fontWeight | Font weight | `normal` \| `bold` \| `bolder` \| `lighter` \| number | |
| fontVariant | Font variant | `normal` \| `small-caps` \| string | |
| textAlign | Text horizontal align | `start` \| `center` \| `middle` \| `end` \| `left` \| `right` | |
| textBaseline | Text baseline | `top` \| `hanging` \| `middle` \| `alphabetic` \| `ideographic` \| `bottom' | |
| textOverflow | Text overflow | `clip` \| `ellipsis` \| string | |
| lineHeight | Line height | number \| string | |
| letterSpacing | Letter spacing | number \| string | |
| maxLines | Max lines | number | |
| textPath | Text path | Path | |
| textPathSide | Text path side | `left` \| `right` | |
| textPathStartOffset | Text path start offset | number \| string | |
| textDecorationLine | Text decoration line | string | |
| textDecorationColor | Text decoration color | string | |
| textDecorationStyle | Text decoration style | `solid` \| `double` \| `dotted` \| `dashed` \| `wavy` | |
| isBillboard | Billboard mode | boolean | |
| billboardRotation | Billboard rotation angle | number | |
| isSizeAttenuation | Size attenuation | boolean | |
| wordWrap | Word wrap | boolean | |
| wordWrapWidth | Word wrap width | number | |
| dx | X offset | number \| string | |
| dy | Y offset | number \| string | |
**Example:**
```js
BaseShape.upsert(
'shape',
'text',
{
x: 100,
y: 100,
text: 'text',
},
container,
);
```
**Display in multiply line:**
```js
{
wordWrap: true,
wordWrapWidth: 100,
maxLines: 4,
textOverflow: 'ellipsis',
}
```
Shape Skill
packages/site/docs/manual/element/shape/properties.zh.md anthropic-skill ~4,468 tokens---
title: 原子 Shape 以及其属性
order: 2
---
G6 中的元素(节点/边)是由**一个或多个 [图形 Shape](/manual/element/shape/overview)** 组成,主要通过自定义节点或自定义边时在 `render` 方法中使用 `upsert` 添加,G6 中支持以下的图形 Shape:
1. [Circle - 圆形](#circlestyleprops)
2. [Ellipse - 椭圆](#ellipsestyleprops)
3. [Rect - 矩形](#rectstyleprops)
4. [HTML - HTML元素](#htmlstyleprops)
5. [Image - 图片](#imagestyleprops)
6. [Line - 线](#linestyleprops)
7. [Path - 路径](#pathstyleprops)
8. [Polygon - 多边形](#polygonstyleprops)
9. [Polyline - 折线](#polylinestyleprops)
10. [Text - 文本](#textstyleprops)
## 各图形 Shape 的通用属性
### BaseShapeStyle
| 属性 | 描述 | 类型 | 必选 |
| -------------- | --------------------------------------------------------------------------------------------- | ---------------------------------------- | ---- |
| x | x 坐标 | number | ✓ |
| y | y 坐标 | number | ✓ |
| width | 宽度 | number | ✓ |
| height | 高度 | number | ✓ |
| fill | 填充颜色 | string \| Pattern \| null | |
| stroke | 描边颜色 | string \| Pattern \| null | |
| opacity | 整体透明度 | number \| string | |
| fillOpacity | 填充透明度 | number \| string | |
| strokeOpacity | 描边透明度 | number \| string | |
| lineWidth | 线宽度 | number \| string | |
| lineCap | 线段端点样式 | `butt` \| `round` \| `square` | |
| lineJoin | 线段连接处样式 | `miter` \| `round` \| `bevel` | |
| lineDash | 虚线配置 | number \| string \| (string \| number)[] | |
| lineDashOffset | 虚线偏移量 | number | |
| shadowBlur | 阴影模糊程度 | number | |
| shadowColor | 阴影颜色 | string | |
| shadowOffsetX | 阴影 X 方向偏移 | number | |
| shadowOffsetY | 阴影 Y 方向偏移 | number | |
| cursor | 鼠标样式,[CSS 的 cursor](https://developer.mozilla.org/en-US/docs/Web/CSS/cursor) 选项都支持 | string | |
| zIndex | 渲染层级 | number | |
| visibility | 可见性 | `visible` \| `hidden` | |
**示例:**
```js
const shape = BaseShape.upsert(
// 指定图形 key,需要保证在同一个自定义元素类型中保持唯一性
'shape',
'circle',
{
cx: 100,
cy: 100,
r: 50,
fill: 'blue',
},
container,
);
```
## 各图形 Shape 的通用方法
### attr()
设置或获取实例的绘图属性。
### attr(name)
获取实例的属性值。
```js
const width = shape.attr('width');
```
### attr(name, value)
更新实例的单个绘图属性。
### attr({...})
批量更新实例绘图属性。
```js
shape.attr({
fill: '#999',
stroke: '#666',
});
```
## 圆图形 Circle
### CircleStyleProps
| 属性 | 描述 | 类型 | 必选 |
| ----------------- | ---------------------------------- | ---------------- | ---- |
| cx | 圆心 x 坐标 | number \| string | ✓ |
| cy | 圆心 y 坐标 | number \| string | ✓ |
| cz | 圆心 z 坐标 | number \| string | |
| r | 圆的半径 | number \| string | ✓ |
| isBillboard | 是否启用公告牌模式(始终面向相机) | boolean | |
| isSizeAttenuation | 是否启用大小衰减(随视距变化大小) | boolean | |
**示例:**
```js
BaseShape.upsert(
// 指定图形 key,需要保证在同一个自定义元素类型中保持唯一性
'shape',
'circle',
{
cx: 100,
cy: 100,
r: 50,
fill: 'blue',
},
container,
);
```
## 矩形图形 Rect
### RectStyleProps
| 属性 | 描述 | 类型 | 必选 |
| ----------------- | ------------------ | ---------------------------- | ---- |
| x | 矩形 x 坐标 | number \| string | |
| y | 矩形 y 坐标 | number \| string | |
| z | 矩形 z 坐标 | number | |
| width | 矩形宽度 | number \| string | ✓ |
| height | 矩形高度 | number \| string | ✓ |
| isBillboard | 是否启用公告牌模式 | boolean | |
| isSizeAttenuation | 是否启用大小衰减 | boolean | |
| radius | 矩形圆角半径 | number \| string \| number[] | |
**示例:**
```js
BaseShape.upsert(
// 指定图形 key,需要保证在同一个自定义元素类型中保持唯一性
'shape',
'rect',
{
x: 100,
y: 100,
width: 100,
height: 100,
radius: 8,
fill: 'blue',
},
container,
);
```
## 椭圆图形 Ellipse
### EllipseStyleProps
| 属性 | 描述 | 类型 | 必选 |
| ----------------- | ------------------ | ---------------- | ---- |
| cx | 椭圆中心 x 坐标 | number \| string | ✓ |
| cy | 椭圆中心 y 坐标 | number \| string | ✓ |
| cz | 椭圆中心 z 坐标 | number \| string | |
| rx | 椭圆 x 轴半径 | number \| string | ✓ |
| ry | 椭圆 y 轴半径 | number \| string | ✓ |
| isBillboard | 是否启用公告牌模式 | boolean | |
| isSizeAttenuation | 是否启用大小衰减 | boolean | |
**示例:**
```js
BaseShape.upsert(
// 指定图形 key,需要保证在同一个自定义元素类型中保持唯一性
'shape',
'ellipse',
{
cx: 100,
cy: 100,
rx: 50,
ry: 80,
fill: 'blue',
},
container,
);
```
## HTML DOM
### HTMLStyleProps
| 属性 | 描述 | 类型 | 必选 |
| --------- | ---------------- | --------------------- | ---- |
| x | HTML 元素 x 坐标 | number \| string | |
| y | HTML 元素 y 坐标 | number \| string | |
| innerHTML | HTML 内容 | string \| HTMLElement | ✓ |
| width | HTML 元素宽度 | number \| string | |
| height | HTML 元素高度 | number \| string | |
**示例:**
```js
BaseShape.upsert(
// 指定图形 key,需要保证在同一个自定义元素类型中保持唯一性
'shape',
'html',
{
x: 100,
y: 100,
innerHTML: <div>content</div>,
},
container,
);
```
## 图片图形 Image
### ImageStyleProps
| 属性 | 描述 | 类型 | 必选 |
| ----------------- | ---------------------------- | -------------------------- | ---- |
| x | 图片 x 坐标 | number \| string | |
| y | 图片 y 坐标 | number \| string | |
| z | 图片 z 坐标 | number | |
| src | 图片资源路径或 HTML 图片元素 | string \| HTMLImageElement | ✓ |
| width | 图片宽度 | number \| string | |
| height | 图片高度 | number \| string | |
| isBillboard | 是否启用公告牌模式 | boolean | |
| isSizeAttenuation | 是否启用大小衰减 | boolean | |
| billboardRotation | 公告牌模式下的旋转角度 | number | |
| keepAspectRatio | 是否保持图片原有宽高比 | boolean | |
**示例:**
```js
BaseShape.upsert(
// 指定图形 key,需要保证在同一个自定义元素类型中保持唯一性
'shape',
'image',
{
x: 100,
y: 100,
src: 'http://',
},
container,
);
```
## 直线 Line
### LineStyleProps
| 属性 | 描述 | 类型 | 必选 |
| ----------------- | ------------------ | --------------------- | ---- |
| x1 | 线段起点 x 坐标 | number | ✓ |
| y1 | 线段起点 y 坐标 | number | ✓ |
| x2 | 线段终点 x 坐标 | number | ✓ |
| y2 | 线段终点 y 坐标 | number | ✓ |
| z1 | 线段起点 z 坐标 | number | |
| z2 | 线段终点 z 坐标 | number | |
| isBillboard | 是否启用公告牌模式 | boolean | |
| isSizeAttenuation | 是否启用大小衰减 | boolean | |
| markerStart | 线段起点的标记 | DisplayObject \| null | |
| markerEnd | 线段终点的标记 | DisplayObject \| null | |
| markerStartOffset | 起点标记的偏移量 | number | |
| markerEndOffset | 终点标记的偏移量 | number | |
**示例:**
```js
BaseShape.upsert(
// 指定图形 key,需要保证在同一个自定义元素类型中保持唯一性
'shape',
'line',
{
x1: 100,
y1: 100,
x2: 150,
y2: 150,
stroke: 'blue',
},
container,
);
```
## 路径 Path
### PathStyleProps
| 属性 | 描述 | 类型 | 必选 |
| ----------------- | -------------------- | ---------------------- | ---- |
| d | 路径定义字符串或数组 | string \| PathArray | ✓ |
| markerStart | 路径起点的标记 | DisplayObject \| null | |
| markerEnd | 路径终点的标记 | DisplayObject \| null | |
| markerMid | 路径中间点的标记 | DisplayObject \| null | |
| markerStartOffset | 起点标记的偏移量 | number | |
| markerEndOffset | 终点标记的偏移量 | number | |
| isBillboard | 是否启用公告牌模式 | boolean | |
| isSizeAttenuation | 是否启用大小衰减 | boolean | |
| fillRule | 填充规则 | `nonzero` \| `evenodd` | |
**示例:**
```js
BaseShape.upsert(
// 指定图形 key,需要保证在同一个自定义元素类型中保持唯一性
'shape',
'path',
{
d: 'M 0,0 L 20,10 L 20,-10 Z',
stroke: 'blue',
},
container,
);
```
## 多边形图形 Polygon
### PolygonStyleProps
| 属性 | 描述 | 类型 | 必选 |
| ----------------- | ------------------ | ------------------------------------------------ | ---- |
| points | 多边形的顶点数组 | ([number, number] \| [number, number, number])[] | ✓ |
| markerStart | 多边形起点的标记 | DisplayObject \| null | |
| markerEnd | 多边形终点的标记 | DisplayObject \| null | |
| markerMid | 多边形中间点的标记 | DisplayObject \| null | |
| markerStartOffset | 起点标记的偏移量 | number | |
| markerEndOffset | 终点标记的偏移量 | number | |
| isClosed | 是否闭合多边形 | boolean | |
| isBillboard | 是否启用公告牌模式 | boolean | |
| isSizeAttenuation | 是否启用大小衰减 | boolean | |
**示例:**
```js
BaseShape.upsert(
// 指定图形 key,需要保证在同一个自定义元素类型中保持唯一性
'shape',
'polygon',
{
points: [
[30, 30],
[40, 20],
[30, 50],
[60, 100],
],
fill: 'red',
},
container,
);
```
## 折线 Polyline
### PolylineStyleProps
| 属性 | 描述 | 类型 | 必选 |
| ----------------- | ------------------ | ------------------------------------------------ | ---- |
| points | 折线的顶点数组 | ([number, number] \| [number, number, number])[] | ✓ |
| markerStart | 折线起点的标记 | DisplayObject \| null | |
| markerEnd | 折线终点的标记 | DisplayObject \| null | |
| markerMid | 折线中间点的标记 | DisplayObject \| null | |
| markerStartOffset | 起点标记的偏移量 | number | |
| markerEndOffset | 终点标记的偏移量 | number | |
| isBillboard | 是否启用公告牌模式 | boolean | |
| isSizeAttenuation | 是否启用大小衰减 | boolean | |
**示例:**
```js
BaseShape.upsert(
// 指定图形 key,需要保证在同一个自定义元素类型中保持唯一性
'shape',
'polyline',
{
points: [
[30, 30],
[40, 20],
[30, 50],
[60, 100],
],
fill: 'red',
},
container,
);
```
## 文字 Text
### TextStyleProps
| 属性 | 描述 | 类型 | 必选 |
| ------------------- | ------------------ | --------------------------------------------------------------------------- | ---- |
| x | 文本 x 坐标 | number \| string | |
| y | 文本 y 坐标 | number \| string | |
| z | 文本 z 坐标 | number \| string | |
| text | 文本内容 | number \| string | ✓ |
| fontSize | 字体大小 | number \| string | |
| fontFamily | 字体族 | string | |
| fontStyle | 字体样式 | `normal` \| `italic` \| `oblique` | |
| fontWeight | 字体粗细 | `normal` \| `bold` \| `bolder` \| `lighter` \| number | |
| fontVariant | 字体变种 | `normal` \| `small-caps` \| string | |
| textAlign | 文本水平对齐方式 | `start` \| `center` \| `middle` \| `end` \| `left` \| `right` | |
| textBaseline | 文本基线 | `top` \| `hanging` \| `middle` \| `alphabetic` \| `ideographic` \| `bottom' | |
| textOverflow | 文本溢出处理方式 | `clip` \| `ellipsis` \| string | |
| lineHeight | 行高 | number \| string | |
| letterSpacing | 字间距 | number \| string | |
| maxLines | 最大行数 | number | |
| textPath | 文本路径 | Path | |
| textPathSide | 文本路径侧边 | `left` \| `right` | |
| textPathStartOffset | 文本路径起始偏移 | number \| string | |
| textDecorationLine | 文本装饰线 | string | |
| textDecorationColor | 文本装饰线颜色 | string | |
| textDecorationStyle | 文本装饰线样式 | `solid` \| `double` \| `dotted` \| `dashed` \| `wavy` | |
| isBillboard | 是否启用公告牌模式 | boolean | |
| billboardRotation | 公告牌旋转角度 | number | |
| isSizeAttenuation | 是否启用大小衰减 | boolean | |
| wordWrap | 是否自动换行 | boolean | |
| wordWrapWidth | 自动换行宽度 | number | |
| dx | X 方向偏移 | number \| string | |
| dy | Y 方向偏移 | number \| string | |
**示例:**
```js
BaseShape.upsert(
// 指定图形 key,需要保证在同一个自定义元素类型中保持唯一性
'shape',
'text',
{
x: 100,
y: 100,
text: 'text',
},
container,
);
```
多行文字显示:
```js
{
wordWrap: true,
wordWrapWidth: 100,
maxLines: 4,
textOverflow: 'ellipsis',
}
```
Element Skill
packages/site/docs/manual/element/state.en.md anthropic-skill ~1,865 tokens---
title: Element State
order: 2
---
## What is Element State
<image width="500px" src="https://mdn.alipayobjects.com/huamei_qa8qxu/afts/img/A*yVbORYybrDQAAAAAAAAAAAAADmJ7AQ/original" />
Element State refers to the visual representation of elements (nodes, edges, combos) in a graph under different interaction scenarios. For example, when a user clicks on a node, the node might enter a "selected" state and change color; when the mouse hovers over an edge, the edge might enter a "highlight" state and become bold.
**Simply put, states allow elements to dynamically change their appearance based on user operations or business logic.**
### Characteristics of States
- **Multiple State Coexistence**: An element can have multiple states simultaneously, such as being both "selected" and "highlighted"
- **Style Stacking**: Styles from multiple states are stacked together, with later-set state styles having higher priority
- **Complete Customization**: Besides built-in states, you can create any custom states that meet your business requirements
## Built-in State Types
G6 provides some commonly used built-in states that you can use directly:
| State Name | Description | Typical Use Cases |
| ----------- | --------------- | ------------------------------------ |
| `selected` | Selected state | When user clicks to select elements |
| `active` | Active state | Currently interacting element |
| `highlight` | Highlight state | Elements that need emphasis |
| `inactive` | Inactive state | Dimmed display of unfocused elements |
| `disabled` | Disabled state | Non-interactive elements |
> 💡 **Tip**: These built-in states are not mandatory. You can completely define your own state names according to business requirements.
## Configuring State Styles
### Basic Configuration
Configure corresponding styles for different states when creating a graph instance:
```javascript
const graph = new Graph({
// Node state style configuration
node: {
// Default style (style when no state is applied)
style: {
fill: '#C6E5FF',
stroke: '#5B8FF9',
lineWidth: 1,
},
// Styles for various states
state: {
selected: {
fill: '#95D6FB',
stroke: '#1890FF',
lineWidth: 2,
shadowColor: '#1890FF',
shadowBlur: 10,
},
highlight: {
stroke: '#FF6A00',
lineWidth: 2,
},
disabled: {
fill: '#ECECEC',
stroke: '#BFBFBF',
opacity: 0.5,
},
},
},
// Edge state style configuration
edge: {
style: {
stroke: '#E2E2E2',
lineWidth: 1,
},
state: {
selected: {
stroke: '#1890FF',
lineWidth: 2,
},
highlight: {
stroke: '#FF6A00',
lineWidth: 3,
},
},
},
// Combo state style configuration
combo: {
style: {
fill: '#F0F0F0',
stroke: '#D9D9D9',
},
state: {
selected: {
stroke: '#1890FF',
lineWidth: 2,
},
},
},
});
```
### Custom States
You can create any custom states that meet your business requirements:
```javascript
const graph = new Graph({
node: {
style: {
fill: '#C6E5FF',
stroke: '#5B8FF9',
},
state: {
// Custom state: error
error: {
fill: '#FFEBE6',
stroke: '#FF4D4F',
lineWidth: 2,
lineDash: [4, 4], // Dashed border
},
// Custom state: success
success: {
fill: '#F6FFED',
stroke: '#52C41A',
lineWidth: 2,
},
// Custom state: warning
warning: {
fill: '#FFFBE6',
stroke: '#FAAD14',
lineWidth: 2,
// Add icon
icon: {
show: true,
text: '⚠️',
fontSize: 16,
},
},
},
},
});
```
## Setting Element States
### Setting Initial States in Data
Set initial states for elements in data:
```javascript
const data = {
nodes: [
{
id: 'node1',
states: ['selected'], // Initially in selected state
},
{
id: 'node2',
states: ['disabled'], // Initially in disabled state
},
{
id: 'node3',
states: ['highlight', 'active'], // Initially has multiple states
},
],
edges: [
{
source: 'node1',
target: 'node2',
states: ['highlight'], // Initial state of the edge
},
],
};
graph.setData(data);
```
### Dynamic State Setting
Dynamically change element states through API:
```javascript
// Set a single state for a single element
graph.setElementState('node1', 'selected');
// Set multiple states for a single element
graph.setElementState('node2', ['highlight', 'active']);
// Batch set states for multiple elements
graph.setElementState({
node1: ['selected'],
node2: ['highlight'],
edge1: ['active'],
});
```
### State Stacking Effect
When an element has multiple states, styles are stacked in order:
```javascript
// Assume a node has both selected and highlight states
graph.setElementState('node1', ['selected', 'highlight']);
// Final style = default style + selected state style + highlight state style
// If there are style conflicts, later state styles will override earlier ones
```
## Clearing Element States
### Clear All States
Restore elements to default state (no states):
```javascript
// Clear all states of a single element
graph.setElementState('node1', []);
// Batch clear states of multiple elements
graph.setElementState({
node1: [],
node2: [],
edge1: [],
});
```
### Clear Specific States
If an element has multiple states, you can clear only some of them:
```javascript
// Assume node1 currently has ['selected', 'highlight', 'active'] three states
// Now only want to keep 'selected' state, clear other states
graph.setElementState('node1', ['selected']);
// Or get current states, then filter out unwanted states
const currentStates = graph.getElementState('node1');
const newStates = currentStates.filter((state) => state !== 'highlight');
graph.setElementState('node1', newStates);
```
### Clear Specific States from All Elements
```javascript
// Clear 'highlight' state from all nodes
const allNodes = graph.getNodeData();
const stateUpdates = {};
allNodes.forEach((node) => {
const currentStates = graph.getElementState(node.id);
const newStates = currentStates.filter((state) => state !== 'highlight');
stateUpdates[node.id] = newStates;
});
graph.setElementState(stateUpdates);
```
## Querying Element States
### Get Element States
```javascript
// Get all states of a specified element
const states = graph.getElementState('node1');
console.log(states); // For example: ['selected', 'highlight']
// If element has no states, returns empty array
console.log(states); // []
```
### Find Elements with Specific States
```javascript
// Get all node data in 'selected' state
const selectedNodes = graph.getElementDataByState('node', 'selected');
// Get all edge data in 'highlight' state
const highlightEdges = graph.getElementDataByState('edge', 'highlight');
```
### Check if Element is in Specific State
```javascript
// Check if element is in specific state
const states = graph.getElementState('node1');
const isSelected = states.includes('selected');
const isHighlight = states.includes('highlight');
console.log('Is node selected:', isSelected);
console.log('Is node highlighted:', isHighlight);
```
Element Skill
packages/site/docs/manual/element/state.zh.md anthropic-skill ~1,295 tokens---
title: 元素状态
order: 2
---
## 什么是元素状态
<image width="500px" src="https://mdn.alipayobjects.com/huamei_qa8qxu/afts/img/A*yVbORYybrDQAAAAAAAAAAAAADmJ7AQ/original" />
元素状态(State)是指图中元素(节点、边、组合)在不同交互场景下的视觉表现形式。比如当用户点击一个节点时,节点可能会变成"选中"状态并改变颜色;当鼠标悬停在边上时,边可能会进入"高亮"状态并加粗显示。
**简单来说,状态让元素能够根据用户的操作或业务逻辑动态改变外观。**
### 状态的特点
- **多状态共存**:一个元素可以同时拥有多个状态,比如既是"选中"又是"高亮"
- **样式叠加**:多个状态的样式会叠加在一起,后设置的状态样式优先级更高
- **完全自定义**:除了内置状态,您可以创建任何符合业务需求的自定义状态
## 内置状态类型
G6 提供了一些常用的内置状态,您可以直接使用:
| 状态名 | 说明 | 典型使用场景 |
| ----------- | ---------- | ------------------ |
| `selected` | 选中状态 | 用户点击选择元素时 |
| `active` | 激活状态 | 当前正在交互的元素 |
| `highlight` | 高亮状态 | 需要强调显示的元素 |
| `inactive` | 非活跃状态 | 淡化显示非关注元素 |
| `disabled` | 禁用状态 | 不可交互的元素 |
> 💡 **提示**:这些内置状态并非必须使用,您完全可以根据业务需求定义自己的状态名称。
## 配置状态样式
### 基础配置
在创建图实例时,为不同状态配置相应的样式:
```javascript
const graph = new Graph({
// 节点的状态样式配置
node: {
// 默认样式(无状态时的样式)
style: {
fill: '#C6E5FF',
stroke: '#5B8FF9',
lineWidth: 1,
},
// 各种状态下的样式
state: {
selected: {
fill: '#95D6FB',
stroke: '#1890FF',
lineWidth: 2,
shadowColor: '#1890FF',
shadowBlur: 10,
},
highlight: {
stroke: '#FF6A00',
lineWidth: 2,
},
disabled: {
fill: '#ECECEC',
stroke: '#BFBFBF',
opacity: 0.5,
},
},
},
// 边的状态样式配置
edge: {
style: {
stroke: '#E2E2E2',
lineWidth: 1,
},
state: {
selected: {
stroke: '#1890FF',
lineWidth: 2,
},
highlight: {
stroke: '#FF6A00',
lineWidth: 3,
},
},
},
// 组合的状态样式配置
combo: {
style: {
fill: '#F0F0F0',
stroke: '#D9D9D9',
},
state: {
selected: {
stroke: '#1890FF',
lineWidth: 2,
},
},
},
});
```
### 自定义状态
您可以创建任何符合业务需求的自定义状态:
```javascript
const graph = new Graph({
node: {
style: {
fill: '#C6E5FF',
stroke: '#5B8FF9',
},
state: {
// 自定义状态:错误
error: {
fill: '#FFEBE6',
stroke: '#FF4D4F',
lineWidth: 2,
lineDash: [4, 4], // 虚线边框
},
// 自定义状态:成功
success: {
fill: '#F6FFED',
stroke: '#52C41A',
lineWidth: 2,
},
// 自定义状态:警告
warning: {
fill: '#FFFBE6',
stroke: '#FAAD14',
lineWidth: 2,
// 添加图标
icon: {
show: true,
text: '⚠️',
fontSize: 16,
},
},
},
},
});
```
## 设置元素状态
### 数据中设置初始状态
在数据中为元素设置初始状态:
```javascript
const data = {
nodes: [
{
id: 'node1',
states: ['selected'], // 初始为选中状态
},
{
id: 'node2',
states: ['disabled'], // 初始为禁用状态
},
{
id: 'node3',
states: ['highlight', 'active'], // 初始有多个状态
},
],
edges: [
{
source: 'node1',
target: 'node2',
states: ['highlight'], // 边的初始状态
},
],
};
graph.setData(data);
```
### 动态设置状态
通过 API 动态改变元素状态:
```javascript
// 设置单个元素的单个状态
graph.setElementState('node1', 'selected');
// 设置单个元素的多个状态
graph.setElementState('node2', ['highlight', 'active']);
// 批量设置多个元素的状态
graph.setElementState({
node1: ['selected'],
node2: ['highlight'],
edge1: ['active'],
});
```
### 状态的叠加效果
当元素有多个状态时,样式会按顺序叠加:
```javascript
// 假设节点同时有 selected 和 highlight 状态
graph.setElementState('node1', ['selected', 'highlight']);
// 最终样式 = 默认样式 + selected状态样式 + highlight状态样式
// 如果有样式冲突,后面的状态样式会覆盖前面的
```
## 清除元素状态
### 清除所有状态
将元素恢复到默认状态(无任何状态):
```javascript
// 清除单个元素的所有状态
graph.setElementState('node1', []);
// 批量清除多个元素的状态
graph.setElementState({
node1: [],
node2: [],
edge1: [],
});
```
### 清除特定状态
如果元素有多个状态,您可以只清除其中的某些状态:
```javascript
// 假设 node1 当前有 ['selected', 'highlight', 'active'] 三个状态
// 现在只想保留 'selected' 状态,清除其他状态
graph.setElementState('node1', ['selected']);
// 或者获取当前状态,然后过滤掉不需要的状态
const currentStates = graph.getElementState('node1');
const newStates = currentStates.filter((state) => state !== 'highlight');
graph.setElementState('node1', newStates);
```
### 清除所有元素的特定状态
```javascript
// 清除所有节点的 'highlight' 状态
const allNodes = graph.getNodeData();
const stateUpdates = {};
allNodes.forEach((node) => {
const currentStates = graph.getElementState(node.id);
const newStates = currentStates.filter((state) => state !== 'highlight');
stateUpdates[node.id] = newStates;
});
graph.setElementState(stateUpdates);
```
## 查询元素状态
### 获取元素状态
```javascript
// 获取指定元素的所有状态
const states = graph.getElementState('node1');
console.log(states); // 例如:['selected', 'highlight']
// 如果元素没有任何状态,返回空数组
console.log(states); // []
```
### 查找特定状态的元素
```javascript
// 获取所有处于 'selected' 状态的节点数据
const selectedNodes = graph.getElementDataByState('node', 'selected');
// 获取所有处于 'highlight' 状态的边数据
const highlightEdges = graph.getElementDataByState('edge', 'highlight');
```
### 判断元素是否处于某状态
```javascript
// 检查元素是否处于特定状态
const states = graph.getElementState('node1');
const isSelected = states.includes('selected');
const isHighlight = states.includes('highlight');
console.log('节点是否选中:', isSelected);
console.log('节点是否高亮:', isHighlight);
```
Extension Skill
packages/site/docs/manual/extension/3d.en.md anthropic-skill ~8 tokens---
title: g6-extension-3d
---
Extension Skill
packages/site/docs/manual/extension/3d.zh.md anthropic-skill ~8 tokens---
title: g6-extension-3d
---
Manual Skill
packages/site/docs/manual/faq.en.md anthropic-skill ~2,644 tokens---
title: FAQ
order: 13
---
### What is the Difference Between Extension and Plugin?
`Extension` is a concept in G6 that collectively refers to all types of registrable content, including elements, behaviors, layouts, and plugins, among others.
`Plugin` represents a flexible extension mechanism provided by G6 and is a special type of `Extension`.
### Set Text Overflow Ellipsis
Taking `label` as an example, you can set `labelWordWrap` and `labelWordWrapWidth` to achieve text overflow ellipsis.
```typescript {3-4}
{
labelText: 'This is a long text',
labelWordWrap: true,
labelWordWrapWidth: 50,
}
```
### Key Press Not Working
Some plugins or behaviors support configuring key press triggers. Please use standard key names, such as `Control`, `Shift`, `Alt`, `Meta`, as well as letters, numbers, symbols, and so on.
### Canvas Not Updating After Data Update
Ensure that you call `graph.draw()` or `graph.render()` to update the canvas after updating the data.
> G6 merges differences and updates the canvas uniformly after `draw` or `render` for multiple data updates to improve performance.
### How to Resolve Interaction Conflicts
When multiple interactions conflict with each other, you can set the enable timing of interactions to avoid multiple interactions being triggered simultaneously.
Taking `drag-canvas` and `brush-select` as an example, if you directly configure these two interactions, dragging on the canvas will cause interaction exceptions. You can disable the `drag-canvas` interaction when the `shift` key is pressed.
```typescript {4}
behaviors: [
{
type: 'drag-canvas',
enable: (event) => event.shiftKey === false,
},
{
type: 'brush-select',
},
];
```
At this point, when the `shift` key is pressed, the `drag-canvas` interaction will be disabled, and the `brush-select` interaction will not be affected.
### Difference Between `draw` and `render`
Both `draw` and `render` execute drawing operations, but `render` additionally performs **layout** and **auto fit** operations based on `draw`.
You can simply understand it as: `render` = `draw` + `layout` + `fitView`/`fitCenter`.
### Style in Data Not Effective
Reason 1: The style in the data is overridden by the style in the style mapping.
```typescript {5}
{
data: [{ id: 'node-1', style: { fill: 'orange' } }],
node: {
style: {
fill: 'pink', // No matter what the style in the data is, it will be overridden by the style here
}
}
}
```
Solution: Use a callback method to prioritize obtaining styles from the data to improve data priority.
```typescript {5}
{
node: {
style: (data) => {
return {
fill: data.style?.fill || 'pink',
};
};
}
}
```
### Residual content in the canvas
When using the Canvas renderer for drawing, residual content may appear in the canvas, which is referred to as "dirty rectangles". This phenomenon occurs because the underlying rendering engine improves performance by only drawing the parts that have changed each time, rather than clearing the entire canvas.
However, when the graphics in the canvas change, there may be cases where some graphics are not correctly cleared, resulting in residual content.
You can solve this issue by:
1. Using the SVG or WebGL renderer;
2. Checking whether there are illegal values in the element of the nodes, such as null, NaN, and so on;
3. Using integers as much as possible for numeric style values, such as r, width, height, fontSize, and so on.
### Use Vanilla JavaScript Object Data
Please avoid using Vue reactive data, Immer.js, and other wrapped objects as the data source for G6, as these objects will be deeply monitored internally, and even freeze the data object, causing G6 to fail to operate normally.
### G6 project startup Warning during compilation Type mapping points to non-existent path
```shell
WARNING in ./node_modules/@antv/util/esm/path/util/segment-cubic-factory.js
Module Warning (from ./node_modules/source-map-loader/dist/cjs.js):
Failed to parse source map from '/Users/xxx/workspace/antv-g6-learn/node_modules/@antv/util/esm/path/util/src/path/util/segment-cubic-factory.ts' file: Error: ENOENT: no such file or directory, open '/Users/xxx/workspace/antv-g6-learn/node_modules/@antv/util/esm/path/util/src/path/util/segment-cubic-factory.ts'
WARNING in ./node_modules/@antv/util/esm/path/util/segment-line-factory.js
Module Warning (from ./node_modules/source-map-loader/dist/cjs.js):
Failed to parse source map from '/Users/xxx/workspace/antv-g6-learn/node_modules/@antv/util/esm/path/util/src/path/util/segment-line-factory.ts' file: Error: ENOENT: no such file or directory, open '/Users/xxx/workspace/antv-g6-learn/node_modules/@antv/util/esm/path/util/src/path/util/segment-line-factory.ts'
WARNING in ./node_modules/@antv/util/esm/path/util/segment-quad-factory.js
Module Warning (from ./node_modules/source-map-loader/dist/cjs.js):
Failed to parse source map from '/Users/xxx/workspace/antv-g6-learn/node_modules/@antv/util/esm/path/util/src/path/util/segment-quad-factory.ts' file: Error: ENOENT: no such file or directory, open '/Users/xxx/workspace/antv-g6-learn/node_modules/@antv/util/esm/path/util/src/path/util/segment-quad-factory.ts'
```
> Explanation: [@antv/util](https://github.com/antvis/util) is a tool library that AntV relies on at the bottom.
From the partial warning message above, we can see that there is a problem with the type declaration file of the `@antv/util` tool library that G6 depends on.**This warning does not affect the normal operation of the project**.
This message will only appear in TypeScript projects. The following are ways to turn it off:
1. Turn off TypeScript sourcemap
Create a `.env` file in the root directory of the project and add the following content:
text
GENERATE_SOURCEMAP=false
text
2. Disable sourcemapping for specific modules
Disabling sourcemapping directly is too simple and crude, and is not user-friendly for developers who may have debugging needs. Therefore, sourcemapping can be disabled for specific modules by configuring the build tool separately.
a. webpack configuration
```javascript
module.exports = {
// ...其他配置
module: {
rules: [
{
test: /node_modules\/@antv\/util\/esm\/path\/util\/.+\.js$/,
use: ['source-map-loader'],
enforce: 'pre',
},
],
},
ignoreWarnings: [/Failed to parse source map/],
};
```
b. vite configuration
```javascript
import { defineConfig } from 'vite';
export default defineConfig({
build: {
rollupOptions: {
onwarn(warning, warn) {
// Ignore warnings for specific modules
if (warning.code === 'MODULE_LEVEL_DIRECTIVE' && warning.message.includes('@antv/util')) {
return;
}
// For other warnings, use the default warning handling
warn(warning);
},
},
},
});
```
### Manually configuring the color palette does not take effect
> In v5, the built-in colors are: export type BuiltInPalette = 'spectral' | 'oranges' | 'greens' | 'blues';
The solution is as follows:
```typescript {10}
const graph = new Graph({
container: '#ID',
width: number,
height: number,
data,
node: {
palette: {
field: 'color',
// right
color: ['red', 'green', 'blue'],
// error
// color: 'red'
},
},
});
```
### grid-line plugin does not take effect
> In v5, built-in plugins include `bubble-sets` `edge-filter-lens` `grid-line` `background` `contextmenu` `fisheye` `fullscreen` `history` `hull` `legend` `minimap` `snapline` `timebar` `toolbar` `tooltip` >`watermark`. [Detailed reference](https://github.com/antvis/G6/blob/6e2355020c20b3a1e2e5ca0e0ee97aeb81f932b3/packages/g6/src/registry/build-in.ts#L189)
Actual reason: The parent container of the `graph` instance, `<div ref={containerRef} />`, does not have a height set, so the G6 Graph may not be able to calculate the correct size.**If you want to enable the `grid-line` canvas plugin, you need to set the width and height of the parent element, which is not valid in the graph configuration**.
### v5 cannot use the tree layout
Use `new Graph({xxx})` uniformly.
> In v5, built-in layouts include `antv-dagre` `combo-combined` `compact-box` `force-atlas2` `circular` `concentric` `d3-force` `dagre` `dendrogram` `force` `fruchterman` `grid` `indented` `mds` `mindmap` `radial` `random`. [Specific reference](https://github.com/antvis/G6/blob/6e2355020c20b3a1e2e5ca0e0ee97aeb81f932b3/packages/g6/src/registry/build-in.ts#L147)
v5 merges the graph and tree graph, no longer creates the tree graph layout by instantiating `G6.TreeGraph`, and removes this method. For details, see [Features - Merge Graph and Tree Graph](https://g6.antv.antgroup.com/manual/feature#-%E5%90%88%E5%B9%B6%E5%9B%BE%E4%B8%8E%E6%A0%91%E5%9B%BE)
### edge does not have a connection at the center of the node
is configured [portLinkToCenter](https://g6.antv.antgroup.com/api/elements/nodes/base-node#portlinktocenter) to `true`.
```typescript {6}
const graph = new Graph({
container: xxx,
node: {
type: 'rect',
style: {
portLinkToCenter: true,
},
},
edge: {
type: 'xxx',
},
});
```
### How to dynamically set the width of a node based on the length of the label content
Implementation solution: [#6347](https://github.com/antvis/G6/pull/6347#issuecomment-2357515570)
```typescript
const measureTextWidth = memoize(
(text: string, font: any = {}): TextMetrics => {
const { fontSize, fontFamily = 'sans-serif', fontWeight, fontStyle, fontVariant } = font;
const ctx = getCanvasContext();
// @see https://developer.mozilla.org/zh-CN/docs/Web/CSS/font
ctx.font = [fontStyle, fontWeight, fontVariant, `${fontSize}px`, fontFamily].join(' ');
return ctx.measureText(isString(text) ? text : '').width;
},
(text: string, font = {}) => [text, ...values(font)].join(''),
);
const graph = new G6.Graph({
node: {
style: { size: d => [measureTextWidth(d.label, {...}) , xxx] },
}
})
```
### NodeEvent node event object type is not complete
You can manually specify the `IPointerEvent` type. For details, see [#6346](https://github.com/antvis/G6/issues/6346)
```typescript {4}
import { NodeEvent } from '@antv/g6';
import type { IPointerEvent } from '@antv/g6';
graph.on(NodeEvent.CLICK, (event: IPointerEvent) => {
// handler
});
```
### Remove the parent combo of the node
Update the node data, set the `combo` value to `null`.
```typescript
graph.updateNodeData([{ id: 'node-id', combo: null }]);
```
Manual Skill
packages/site/docs/manual/faq.zh.md anthropic-skill ~1,789 tokens---
title: 常见问题
order: 13
---
### Extension 和 Plugin 有什么区别?
`Extension` 是 G6 中的一个概念,是所有可注册内容的统称,包含元素、交互、布局、插件等。
`Plugin` 是 G6 提供的灵活扩展机制,是一种特殊的 `Extension`。
### 设置文本超出省略
以 label 为例,设置 `labelWordWrap` 和 `labelWordWrapWidth` 即可实现文本超出省略。
```typescript {3-4}
{
labelText: 'This is a long text',
labelWordWrap: true,
labelWordWrapWidth: 50,
}
```
### 按键不生效
一些插件或交互支持配置触发按键,请使用标准按键名:如 `Control`, `Shift`, `Alt`, `Meta`,以及字母、数字、符号等。
### 更新数据后画布不更新
请确保数据更新后调用 `graph.draw()` 或者 `graph.render()` 更新画布。
> G6 对于多次数据更新,会在 `draw` 或 `render` 后合并差异并统一更新画布,以提高性能。
### 交互有冲突如何解决
当多个交互之间存在冲突时,你可以设置交互的启用时机来避免多个交互被同时触发。
以 `drag-canvas` 和 `brush-select` 为例,如果直接配置这两个交互,当指针在画布上进行拖拽时,会导致交互异常。可以设置为在按下 `shift` 键时禁用 `drag-canvas` 交互。
```typescript {4}
behaviors: [
{
type: 'drag-canvas',
enable: (event) => event.shiftKey === false,
},
{
type: 'brush-select',
},
];
```
此时,当按下 `shift` 键时,`drag-canvas` 交互会被禁用,`brush-select` 交互会不会受到影响。
### draw 和 render 的区别
`draw` 和 `render` 都会执行绘制操作,但 `render` 会在 `draw` 的基础上额外进行**布局**、**视图自适应**操作。
可以简单理解为:`render` = `draw` + `layout` + `fitView`/`fitCenter`。
### 数据中的样式不生效
原因一:被样式映射中的样式覆盖
```typescript {5}
{
data: [{ id: 'node-1', style: { fill: 'orange' } }],
node: {
style: {
fill: 'pink', // 无论数据中的样式如何,都会被这里的样式覆盖
}
}
}
```
解决方式:使用回调方法,优先从数据中获取样式以提高数据优先级
```typescript {5}
{
node: {
style: (data) => {
return {
fill: data.style?.fill || 'pink',
};
};
}
}
```
### 画布中出现残影
在使用 Canvas 渲染器进行绘制时,可能会出现残影现象,这些图形被称为“脏矩形”。该现象出现的原因是底层渲染引擎为了提高性能,每次绘制时只会绘制发生变化的部分,而不会清空整个画布。
但是,当画布中的图形发生变化时,可能会出现部分图形未被正确清除的情况,从而导致残影现象。
可以通过以下方式解决:
1. 使用 SVG 或 WebGL 渲染器;
2. 检查节点中的图形样式中是否存在非法值,例如 null、NaN 等;
3. 尽量使用整数作为数值型的样式值,例如 r、width、height、fontSize 等;
### 使用原生 JavaScript 对象数据
请避免使用 Vue 响应式数据、Immer.js 等包装过的对象作为 G6 的数据源,因为这些对象会在内部进行深度监听,甚至冻结数据对象,导致 G6 无法正常操作数据。
### G6 项目启动在编译时警告类型映射指向不存在路径
```shell
WARNING in ./node_modules/@antv/util/esm/path/util/segment-cubic-factory.js
Module Warning (from ./node_modules/source-map-loader/dist/cjs.js):
Failed to parse source map from '/Users/xxx/workspace/antv-g6-learn/node_modules/@antv/util/esm/path/util/src/path/util/segment-cubic-factory.ts' file: Error: ENOENT: no such file or directory, open '/Users/xxx/workspace/antv-g6-learn/node_modules/@antv/util/esm/path/util/src/path/util/segment-cubic-factory.ts'
WARNING in ./node_modules/@antv/util/esm/path/util/segment-line-factory.js
Module Warning (from ./node_modules/source-map-loader/dist/cjs.js):
Failed to parse source map from '/Users/xxx/workspace/antv-g6-learn/node_modules/@antv/util/esm/path/util/src/path/util/segment-line-factory.ts' file: Error: ENOENT: no such file or directory, open '/Users/xxx/workspace/antv-g6-learn/node_modules/@antv/util/esm/path/util/src/path/util/segment-line-factory.ts'
WARNING in ./node_modules/@antv/util/esm/path/util/segment-quad-factory.js
Module Warning (from ./node_modules/source-map-loader/dist/cjs.js):
Failed to parse source map from '/Users/xxx/workspace/antv-g6-learn/node_modules/@antv/util/esm/path/util/src/path/util/segment-quad-factory.ts' file: Error: ENOENT: no such file or directory, open '/Users/xxx/workspace/antv-g6-learn/node_modules/@antv/util/esm/path/util/src/path/util/segment-quad-factory.ts'
```
> 解释: [@antv/util](https://github.com/antvis/util) 是 AntV 底层依赖的工具库。
从上面部分警告信息中我们可以得知是 G6 依赖的 `@antv/util` 工具库的类型声明文件存在问题,**该警告不影响项目正常运行**。
该信息只会在 TypeScript 项目中出现,关闭办法如下:
1. 关闭TypeScript 的sourcemap源码映射
在项目根目录下创建`.env`文件,并添加以下内容:
```text
GENERATE_SOURCEMAP=false
```
2. 单独禁用指定模块的源码映射
直接禁用sourcemap映射的方式过于简单粗暴,对于部分可能有调试需求的开发者不太友好,所以也可以通过在构建工具单独配置,单独禁用这些特定模块的源码映射。
a. webpack配置
```javascript
module.exports = {
// ...其他配置
module: {
rules: [
{
test: /node_modules\/@antv\/util\/esm\/path\/util\/.+\.js$/,
use: ['source-map-loader'],
enforce: 'pre',
},
],
},
ignoreWarnings: [/Failed to parse source map/],
};
```
b. vite配置
```javascript
import { defineConfig } from 'vite';
export default defineConfig({
build: {
rollupOptions: {
onwarn(warning, warn) {
// 忽略特定模块的警告
if (warning.code === 'MODULE_LEVEL_DIRECTIVE' && warning.message.includes('@antv/util')) {
return;
}
// 对于其他警告,使用默认的警告处理
warn(warning);
},
},
},
});
```
### 手动配置色板颜色不生效
> 在 v5 中内置颜色有:export type BuiltInPalette = 'spectral' | 'oranges' | 'greens' | 'blues';
解决办法如下:
```typescript {10}
const graph = new Graph({
container: '#ID',
width: number,
height: number,
data,
node: {
palette: {
field: 'color',
// right
color: ['red', 'green', 'blue'],
// error
// color: 'red'
},
},
});
```
### grid-line 插件不生效
> 在 v5 中内置插件有`bubble-sets` `edge-filter-lens` `grid-line` `background` `contextmenu` `fisheye` `fullscreen` `history` `hull` `legend` `minimap` `snapline` `timebar` `toolbar` `tooltip` >`watermark`. [具体参考](https://github.com/antvis/G6/blob/6e2355020c20b3a1e2e5ca0e0ee97aeb81f932b3/packages/g6/src/registry/build-in.ts#L189)
实际原因: `graph`实例的父容器`<div ref={containerRef} />`本身没有设置高度,G6 Graph图 可能无法正确计算出合适的大小。**如果要启用`grid-line`画布插件,需要给父元素 div 设置宽高,在 graph 配置中是无效的**。
### v5无法使用树图布局
统一使用`new Graph({xxx})`。
> 在 v5 中内置布局有`antv-dagre` `combo-combined` `compact-box` `force-atlas2` `circular` `concentric` `d3-force` `dagre` `dendrogram` `force` `fruchterman` `grid` `indented` `mds` `mindmap` `radial` `random`. [具体参考](https://github.com/antvis/G6/blob/6e2355020c20b3a1e2e5ca0e0ee97aeb81f932b3/packages/g6/src/registry/build-in.ts#L147)
v5合并了图和树图,不再通过实例化`G6.TreeGraph`创建树图布局,并且移除该方式。具体参考[特性-合并图与树图](/manual/whats-new/feature#🌲-合并图与树图)
### edge 没有连接在 node 的边缘中心
配置[portLinkToCenter](https://g6.antv.antgroup.com/api/elements/nodes/base-node#portlinktocenter)为 `true`。
```typescript {6}
const graph = new Graph({
container: xxx,
node: {
type: 'rect',
style: {
portLinkToCenter: true,
},
},
edge: {
type: 'xxx',
},
});
```
### 如何根据label内容长度动态设置node宽度
参考方案:[#6347](https://github.com/antvis/G6/pull/6347#issuecomment-2357515570)
```typescript
const measureTextWidth = memoize(
(text: string, font: any = {}): TextMetrics => {
const { fontSize, fontFamily = 'sans-serif', fontWeight, fontStyle, fontVariant } = font;
const ctx = getCanvasContext();
// @see https://developer.mozilla.org/zh-CN/docs/Web/CSS/font
ctx.font = [fontStyle, fontWeight, fontVariant, `${fontSize}px`, fontFamily].join(' ');
return ctx.measureText(isString(text) ? text : '').width;
},
(text: string, font = {}) => [text, ...values(font)].join(''),
);
const graph = new G6.Graph({
node: {
style: { size: d => [measureTextWidth(d.label, {...}) , xxx] },
}
})
```
### NodeEvent节点事件对象类型不齐全问题
可以手动指定`IPointerEvent`类型。具体参考[#6346](https://github.com/antvis/G6/issues/6346)
```typescript {4}
import { NodeEvent } from '@antv/g6';
import type { IPointerEvent } from '@antv/g6';
graph.on(NodeEvent.CLICK, (event: IPointerEvent) => {
// handler
});
```
### 解除节点所在组合
更新节点数据,`combo` 值设置为 `null`。
```typescript
graph.updateNodeData([{ id: 'node-id', combo: null }]);
```
Further-reading Skill
packages/site/docs/manual/further-reading/3d.en.md anthropic-skill ~585 tokens---
title: Use 3D
order: 5
---
## Install Dependencies
Before using 3D capabilities, please install the 3D extension package first:
```bash
npm install @antv/g6-extension-3d --save
```
The extension package exports the following:
- renderer: 3D renderer
**Elements**
- Capsule: capsule node
- Cone: cone node
- Cube: cube node
- Cylinder: cylinder node
- Sphere: sphere node
- Torus: torus node
- Line3D: 3D line
**Layout**
- D3Force3DLayout: 3D force-directed layout
**Behaviors**
- DragCanvas3D: drag canvas
- ObserveCanvas3D: observe canvas
- RollCanvas3D: rotate canvas
- ZoomCanvas3D: zoom canvas
**Plugin**
- Light: light source
## Register Extensions
The following extensions are required:
- renderer
- at least one 3D node
- Line3D
- Light
> The renderer does not need to be registered, it can be passed in during the instantiation of Graph.
Register as follows:
```ts
import { register, ExtensionCategory } from '@antv/g6';
import { Sphere, Line3D, Light } from '@antv/g6-extension-3d';
register(ExtensionCategory.NODE, 'sphere', Sphere);
register(ExtensionCategory.EDGE, 'line3d', Line3D);
register(ExtensionCategory.PLUGIN, 'light', Light);
```
## Create 3D Graph
After completing the above steps, you can create a 3D graph:
```ts
import { Graph } from '@antv/g6';
import { renderer } from '@antv/g6-extension-3d';
const graph = new Graph({
// ... other options
// use 3d renderer
renderer,
node: {
type: 'sphere', // use 3d node
style: {
materialType: 'phong', // use Phong material
},
},
edge: {
type: 'line3d', // use 3D edge
},
plugins: [
{
type: 'light', // Add light source
// configure directional light
directional: {
direction: [0, 0, 1],
},
},
],
});
graph.render();
```
You can also refer to:
- [Lite Solar System](/examples/feature/default/#lite-solar-system)
- [3D Force Layout](/examples/layout/force-directed/#3d-force)
## Tips
`@antv/g6` has a built-in registered plugin for CameraSetting for camera configuration, refer to [plugin](https://github.com/antvis/G6/blob/v5/packages/g6/src/plugins/camera-setting.ts).
```typescript
{
plugins: [
{
type: 'camera-setting',
projectionMode: 'perspective',
near: 0.1,
far: 1000,
fov: 45,
aspect: 1,
},
];
}
```
Further-reading Skill
packages/site/docs/manual/further-reading/3d.zh.md anthropic-skill ~443 tokens---
title: 使用 3D
order: 5
---
## 安装依赖
在使用 3D 能力之前,请首先安装 3D 扩展包:
```bash
npm install @antv/g6-extension-3d --save
```
该扩展包导出了以下内容:
- renderer:3D 渲染器
**元素**
- Capsule:胶囊节点
- Cone:圆锥节点
- Cube:立方体节点
- Cylinder:圆柱节点
- Sphere:球体节点
- Torus:圆环节点
- Line3D:3D 线
**布局**
- D3Force3DLayout:3D 力导向布局
**交互**
- DragCanvas3D:拖拽画布
- ObserveCanvas3D:观察画布
- RollCanvas3D:旋转画布
- ZoomCanvas3D:缩放画布
**插件**
- Light:光源
## 注册扩展
其中下列扩展是必须的:
- renderer
- 至少一个 3D 节点
- Line3D
- Light
> renderer 无需注册,实例化 Graph 过程中传入即可。
使用如下方式进行注册:
```ts
import { register, ExtensionCategory } from '@antv/g6';
import { Sphere, Line3D, Light } from '@antv/g6-extension-3d';
register(ExtensionCategory.NODE, 'sphere', Sphere);
register(ExtensionCategory.EDGE, 'line3d', Line3D);
register(ExtensionCategory.PLUGIN, 'light', Light);
```
## 创建 3D 图
完成上述步骤后,即可创建 3D 图:
```ts
import { Graph } from '@antv/g6';
import { renderer } from '@antv/g6-extension-3d';
const graph = new Graph({
// ... 其他配置
// 使用 3D 渲染器
renderer,
node: {
type: 'sphere', // 使用 3D 节点
style: {
materialType: 'phong', // 使用 Phong 材质
},
},
edge: {
type: 'line3d', // 使用 3D 边
},
plugins: [
{
type: 'light', // 添加光源
// 配置方向光
directional: {
direction: [0, 0, 1],
},
},
],
});
graph.render();
```
你可以参考以下示例:
- [精简太阳系](/examples/feature/default/#lite-solar-system)
- [3D 力导向布局](/examples/layout/force-directed/#3d-force)
## 其他
`@antv/g6` 中内置注册了 `CameraSetting` 插件,可用于配置相机,具体可参考[插件](https://github.com/antvis/G6/blob/v5/packages/g6/src/plugins/camera-setting.ts)。
```typescript
{
plugins: [
{
type: 'camera-setting',
projectionMode: 'perspective',
near: 0.1,
far: 1000,
fov: 45,
aspect: 1,
},
];
}
```
Further-reading Skill
packages/site/docs/manual/further-reading/bundle.en.md anthropic-skill ~693 tokens---
title: Bundle Project
order: 6
---
In general, if you are using modern build tools such as Webpack, Rollup, or ESBuild, you can easily build projects that depend on `@antv/g6`.
Some build tools, such as Vite, use ESBuild as the underlying tool, so you can refer to ESBuild's configuration.
Below are some example configurations that you can refer to when building your project. If you find that these configurations do not work properly, make sure that your build tool version is up to date.
## Bundle Project with Webpack
1. Make sure that `webpack` and `webpack-cli` are installed in your project:
```bash
npm install webpack webpack-cli --save-dev
```
2. Refer to the following `webpack.config.js` for configuration:
```js
const path = require('path');
module.exports = {
entry: './src/index.ts',
output: {
path: path.resolve(__dirname, 'dist'),
filename: 'index.js',
},
mode: 'production',
};
```
3. Run the build command:
```bash
npx webpack
```
> The above configuration works with `"webpack": "^5.94.0"`, `"webpack-cli": "^5.1.4"`.
:::error{title=Webpack4}
⚠️ It is strongly recommended that projects use Webpack 5. If you are using Webpack 4, follow the steps below to configure:
1. Install the necessary dependencies: `babel-loader` (<9), `@babel/preset-env`, `@open-wc/webpack-import-meta-loader`
> If you are using TypeScript, you also need to install `ts-loader`.
```bash
npm install babel-loader@8 @babel/preset-env @open-wc/webpack-import-meta-loader --save-dev
```
2. Modify the `webpack.config.js` configuration:
<embed src="@/common/manual/feature/webpack4.md"></embed>
:::
> This configuration is for a standard webpack project. If you are using vue-cli, you should REMOVE the `mode: 'production'` option as it is unnecessary.
## Bundle Project with Rollup
1. First, make sure that `rollup` and the necessary plugins are installed in your project:
- `@rollup/plugin-commonjs`: Used to load CommonJS modules
- `@rollup/plugin-node-resolve`: Used to load Node.js modules
```bash
npm install rollup @rollup/plugin-commonjs @rollup/plugin-node-resolve --save-dev
```
2. Refer to the following `rollup.config.js` for configuration:
```js
const commonjs = require('@rollup/plugin-commonjs');
const resolve = require('@rollup/plugin-node-resolve');
module.exports = {
input: 'src/index.ts',
output: {
file: 'dist/index.js',
format: 'umd',
name: 'project',
},
plugins: [resolve(), commonjs()],
};
```
3. Run the build command:
```bash
npx rollup -c
```
## Bundle Project with ESBuild
1. First, make sure that `esbuild` is installed in your project:
```bash
npm install esbuild --save-dev
```
2. Run the build command:
```bash
npx esbuild src/index.ts --bundle --outfile=dist/index.js
```
Further-reading Skill
packages/site/docs/manual/further-reading/bundle.zh.md anthropic-skill ~478 tokens---
title: 项目打包
order: 6
---
通常情况下,如果你使用的现代构建工具,如 Webpack、Rollup 或 ESBuild,你可以很容易地构建依赖于 `@antv/g6` 的项目。
一些构建工具例如 Vite,其底层是使用 ESBuild,因此你可以参考 ESBuild 的配置。
下面是一些示例配置,你可以参考这些配置来构建你的项目。如果你发现这些配置无法正常工作,请确保你的构建工具版本较新。
## 使用 Webpack 打包项目
1. 确保你的项目中已经安装了 `webpack` 和 `webpack-cli`:
```bash
npm install webpack webpack-cli --save-dev
```
2. 参考下面的 `webpack.config.js` 进行配置:
```js
const path = require('path');
module.exports = {
entry: './src/index.ts',
output: {
path: path.resolve(__dirname, 'dist'),
filename: 'index.js',
},
mode: 'production',
};
```
3. 执行构建命令:
```bash
npx webpack
```
> 上述配置在:"webpack": "^5.94.0","webpack-cli": "^5.1.4" 可以正常工作。
:::error{title=Webpack4}
⚠️ 强烈建议项目使用 Webpack 5,如果你使用的是 Webpack 4,按以下步骤配置:
1. 安装相关依赖:babel-loader(<9)、@babel/preset-env、@open-wc/webpack-import-meta-loader
> 如果你使用的 typescript,还需要安装 ts-loader
```bash
npm install babel-loader@8 @babel/preset-env @open-wc/webpack-import-meta-loader --save-dev
```
2. 修改 `webpack.config.js` 配置:
<embed src="@/common/manual/feature/webpack4.md"></embed>
:::
> 如果你使用的是 vue-cli,请移除 mode: 'production' 配置,否则可能会影响开发模式下的构建性能。
## 使用 Rollup 打包项目
1. 首先,确保你的项目中已经安装了 `rollup` 及必要的插件:
- `@rollup/plugin-commonjs`:用于加载 CommonJS 模块
- `@rollup/plugin-node-resolve`:用于加载 Node.js 模块
```bash
npm install rollup @rollup/plugin-commonjs @rollup/plugin-node-resolve --save-dev
```
2. 参考下面的 `rollup.config.js` 进行配置:
```js
const commonjs = require('@rollup/plugin-commonjs');
const resolve = require('@rollup/plugin-node-resolve');
module.exports = {
input: 'src/index.ts',
output: {
file: 'dist/index.js',
format: 'umd',
name: 'project',
},
plugins: [resolve(), commonjs()],
};
```
3. 执行构建命令:
```bash
npx rollup -c
```
## 使用 ESBuild 打包项目
1. 首先,确保你的项目中已经安装了 `esbuild`:
```bash
npm install esbuild --save-dev
```
2. 执行构建命令:
```bash
npx esbuild src/index.ts --bundle --outfile=dist/index.js
```
Further-reading Skill
packages/site/docs/manual/further-reading/coordinate.en.md anthropic-skill ~652 tokens---
title: coordinate
order: 2
---
## Overview
There are three coordinate systems in G6 5.0: Canvas, Viewport, and Client.
### Canvas Coordinate System
The coordinate system used when drawing G6 elements is not affected by camera zooming or panning. To change the position of an element, you need to directly modify the element's position properties (x/y/z).
The canvas space is theoretically infinite. In the initial state (no panning, zoom ratio is 1), the origin of the canvas coordinate system is located at the upper-left corner of the viewport.
### Viewport Coordinate System
The viewport coordinate system is the projection of the camera coordinate system. When the camera pans or zooms, the position of elements in the canvas will also change in the viewport coordinate system.
The size of the viewport is the size of the canvas DOM container. The origin of the viewport coordinate system is located at the upper-left corner of the viewport, with the x-axis pointing to the right and the y-axis pointing down.

### Client Coordinate System
The client coordinate system has the browser's upper-left corner as the origin, with the x-axis pointing to the right and the y-axis pointing down.
The following figure describes the relationship between the viewport coordinate system and the client coordinate system:
<img width="300" src="https://mdn.alipayobjects.com/huamei_qa8qxu/afts/img/A*HOcfToHFDIYAAAAAAAAAAAAADmJ7AQ/original" />
## Coordinate System Conversion
G6 provides methods for coordinate system conversion, making it easy to convert between different coordinate systems.
- Canvas coordinate system to viewport coordinate system: [getViewportByCanvas](/en/api/coordinate#graphgetviewportbycanvaspoint)
- Client coordinate system to canvas coordinate system: [getCanvasByClient](/en/api/coordinate#graphgetcanvasbyclientpoint)
- Viewport coordinate system to canvas coordinate system: [getCanvasByViewport](/en/api/coordinate#graphgetcanvasbyviewportpoint)
- Canvas coordinate system to client coordinate system: [getClientByCanvas](/en/api/coordinate#graphgetclientbycanvaspoint)
Other related APIs are also provided:
- Get the viewport center in viewport coordinates: [getCanvasCenter](/en/api/viewport#graphgetcanvascenter)
- Get the viewport center in canvas coordinates: [getViewportCenter](/en/api/viewport#graphgetviewportcenter)
- Get the position of the graph origin in the viewport coordinate system: [getPosition](/en/api/viewport#graphgetposition)
Further-reading Skill
packages/site/docs/manual/further-reading/coordinate.zh.md anthropic-skill ~315 tokens---
title: 坐标系
order: 2
---
## 概述
在 G6 5.0 中主要会涉及三个坐标系:画布坐标系(Canvas)、视口坐标系(Viewport)和浏览器坐标系(Client)。
### 画布坐标系
G6 元素绘制时所使用的坐标系,其不受相机缩放、平移的影响,要改变一个元素的位置,需要直接修改元素的位置属性(x/y/z)。
画布空间理论上是无限大的,在初始状态下(无平移、缩放倍率为1),画布坐标系的原点位于视口左上角位置。
### 视口坐标系
视口坐标系是相机坐标系的投影,当相机发生平移、缩放时,画布中元素位置在视口坐标系中的位置也会发生变化。
视口的大小即画布 DOM 容器的大小,视口坐标系的原点位于视口左上角位置,x 轴正方向向右,y 轴正方向向下。

### 浏览器坐标系
浏览器坐标系以浏览器左上角为原点,x 轴正方向向右,y 轴正方向向下。
下图描述了视口坐标系和浏览器坐标系之间的关系:
<img width="300" src="https://mdn.alipayobjects.com/huamei_qa8qxu/afts/img/A*HOcfToHFDIYAAAAAAAAAAAAADmJ7AQ/original" />
## 坐标系转换
G6 提供了坐标系转换的方法,可以方便地在不同坐标系之间进行转换。
- 画布坐标系转视口坐标系:[getViewportByCanvas](/api/coordinate#graphgetviewportbycanvaspoint)
- 浏览器坐标系转画布坐标系:[getCanvasByClient](/api/coordinate#graphgetcanvasbyclientpoint)
- 视口坐标系转画布坐标系:[getCanvasByViewport](/api/coordinate#graphgetcanvasbyviewportpoint)
- 画布坐标系转浏览器坐标系:[getClientByCanvas](/api/coordinate#graphgetclientbycanvaspoint)
另外还提供了其他相关 API:
- 获取视口中心的视口坐标:[getCanvasCenter](/api/viewport#graphgetcanvascenter)
- 获取视口中心的画布坐标:[getViewportCenter](/api/viewport#graphgetviewportcenter)
- 获取图原点在视口坐标系中的位置:[getPosition](/api/viewport#graphgetposition)
Further-reading Skill
packages/site/docs/manual/further-reading/download-image.en.md anthropic-skill ~267 tokens---
title: download-image
order: 3
---
G6 5.0 only provides an API for exporting the canvas as a Base64 image ([toDataURL](/en/api/export-image#graphtodataurloptions)). If you need to download the image, you can use the following method:
```typescript
async function downloadImage() {
const dataURL = await graph.toDataURL();
const [head, content] = dataURL.split(',');
const contentType = head.match(/:(.*?);/)![1];
const bstr = atob(content);
let length = bstr.length;
const u8arr = new Uint8Array(length);
while (length--) {
u8arr[length] = bstr.charCodeAt(length);
}
const blob = new Blob([u8arr], { type: contentType });
const url = URL.createObjectURL(blob);
const a = document.createElement('a');
a.href = url;
a.download = 'graph.png';
a.click();
}
```
:::warning{title=note}
The exported image may not contain the complete canvas content; the export range only includes the content within the Graph canvas. Some plugins use custom containers, canvases, etc., and this content will not appear in the exported image.
:::
Further-reading Skill
packages/site/docs/manual/further-reading/download-image.zh.md anthropic-skill ~200 tokens---
title: 下载图片
order: 3
---
G6 5.0 仅提供导出画布为 Base64 图片的 API([toDataURL](/api/export-image#graphtodataurloptions)),如果需要下载图片,可以使用以下方法:
```typescript
async function downloadImage() {
const dataURL = await graph.toDataURL();
const [head, content] = dataURL.split(',');
const contentType = head.match(/:(.*?);/)![1];
const bstr = atob(content);
let length = bstr.length;
const u8arr = new Uint8Array(length);
while (length--) {
u8arr[length] = bstr.charCodeAt(length);
}
const blob = new Blob([u8arr], { type: contentType });
const url = URL.createObjectURL(blob);
const a = document.createElement('a');
a.href = url;
a.download = 'graph.png';
a.click();
}
```
:::warning{title=注意}
导出的图片内容可能不会包含完整的画布内容,导出范围仅包含 Graph 画布中的内容。部分插件使用了自定义的容器、画布等,这部分内容不会出现在导出的图片中。
:::
Further-reading Skill
packages/site/docs/manual/further-reading/event.en.md anthropic-skill ~805 tokens---
title: Event
order: 0
---
## Overview
The event system in G6 is encapsulated based on the event system of [G](https://g.antv.antgroup.com/en/api/event/intro), providing a wider range of event types and more convenient methods for event binding and unbinding.
## Event Types
The event types in G6 are mainly divided into the following categories:
1. Graph events
2. Canvas events
3. Element events
### Graph Events
Graph events refer to events associated with the entire graph instance, such as the graph's rendering completion event, the graph's update event, etc. The complete list of graph events can be found at [GraphEvent](/en/api/event#graph-lifecycle-events-graphevent).
#### Listening to Graph Events
Listening to graph events is consistent with the default event listening method. For example, to listen to the graph's rendering completion event:
```typescript
import { Graph, GraphEvent } from '@antv/g6';
const graph = new Graph({
// ...
});
graph.on(GraphEvent.AFTER_RENDER, () => {
// event handler
});
```
### Canvas Events
Canvas events refer to events associated with the canvas, such as the canvas's click event, the canvas's drag event, etc. The complete list of canvas events can be found at [CanvasEvent](/en/api/event#canvas-events-canvasevent).
#### Listening to Canvas Events
For example, to listen to the canvas's click event:
```typescript
import { Graph, CanvasEvent } from '@antv/g6';
const graph = new Graph({
// ...
});
graph.on(CanvasEvent.CLICK, (event) => {
// event handler
});
```
### Element Events
Element events primarily refer to events that are triggered on element objects, such as a node's drag event, an edge's click event, etc. Elements are categorized into three types: nodes (`node`), edges (`edge`), and combos (`combo`). The complete list of corresponding events can be found at: [NodeEvent](/en/api/event#node-events-nodeevent), [EdgeEvent](/en/api/event#edge-events-edgeevent), [ComboEvent](/en/api/event#combo-events-comboevent).
#### Listening to Element Events
Similar to canvas events, for example, to listen to a node's drag event and an edge's click event:
```ts
import { Graph, NodeEvent, EdgeEvent, ComboEvent } from '@antv/g6';
const graph = new Graph({
// ...
});
graph.on(NodeEvent.DRAG, (event) => {
// event handler
});
graph.on(EdgeEvent.CLICK, (event) => {
// event handler
});
graph.on(ComboEvent.CLICK, (event) => {
// event handler
});
```
## Event Listening and Unlistening
G6 provides the following APIs for event listening and unlistening:
### on
Add an event listener
```typescript
const handler = (event) => {
// event handler
};
graph.on('event_name', handler);
```
### off
Remove an event listener
```typescript
graph.off('event_name', handler);
```
When no arguments are passed, it will remove all event listeners:
```typescript
graph.off();
```
### once
Add a one-time event listener, which means the event listener will be automatically removed after the event is triggered
```typescript
graph.once('event_name', handler);
```
### emit
If you want to manually trigger an event, you can use the `emit` method:
```typescript
graph.emit('event_name', {
// event data
});
```
Further-reading Skill
packages/site/docs/manual/further-reading/event.zh.md anthropic-skill ~470 tokens---
title: 事件
order: 0
---
## 概述
G6 中的事件系统是在 [G](https://g.antv.antgroup.com/api/event/intro) 的事件系统基础上进行了封装,提供了更多的事件类型,以及更加方便的事件绑定和解绑方法。
## 事件类型
G6 中的事件类型主要分为以下几类:
1. 图(Graph)事件
2. 画布(Canvas)事件
3. 元素(Element)事件
### 图事件
图事件是指与整个图实例相关的事件,例如图的渲染完成事件、图的更新事件等。图事件的完整列表见[GraphEvent](/api/event#图表生命周期事件-graphevent)。
#### 监听图事件
图事件的监听与默认的事件监听方式一致,例如监听图的渲染完成事件:
```typescript
import { Graph, GraphEvent } from '@antv/g6';
const graph = new Graph({
// ...
});
graph.on(GraphEvent.AFTER_RENDER, () => {
// event handler
});
```
### 画布事件
画布事件是指与画布相关的事件,例如画布的点击事件、画布的拖拽事件等。画布事件的完整列表见[CanvasEvent](/api/event#画布事件-canvasevent)。
#### 监听画布事件
例如监听画布的点击事件:
```typescript
import { Graph, CanvasEvent } from '@antv/g6';
const graph = new Graph({
// ...
});
graph.on(CanvasEvent.CLICK, (event) => {
// event handler
});
```
### 元素事件
元素事件主要指在元素对象上触发的事件,例如节点的拖拽事件、边的点击事件等。元素分为节点(`node`)、边(`edge`)、组合(`combo`)三类,对应的事件完整列表分别见:[NodeEvent](/api/event#节点事件-nodeevent) 、[EdgeEvent](/api/event#边事件-edgeevent)、[ComboEvent](/api/event#combo事件-comboevent)。
#### 监听元素事件
与画布事件类似,例如监听节点的拖拽和边的点击事件:
```ts
import { Graph, NodeEvent, EdgeEvent, ComboEvent } from '@antv/g6';
const graph = new Graph({
// ...
});
graph.on(NodeEvent.DRAG, (event) => {
// event handler
});
graph.on(EdgeEvent.CLICK, (event) => {
// event handler
});
graph.on(ComboEvent.CLICK, (event) => {
// event handler
});
```
## 事件监听与解除
G6 提供以下 API 用于事件监听和解除:
### on
添加事件监听
```typescript
const handler = (event) => {
// event handler
};
graph.on('event_name', handler);
```
### off
移除事件监听
```typescript
graph.off('event_name', handler);
```
当不传入任何参数时,会移除所有事件监听:
```typescript
graph.off();
```
### once
添加一次性事件监听,即事件触发后会自动移除事件监听
```typescript
graph.once('event_name', handler);
```
### emit
如果你想手动触发一个事件,可以使用 `emit` 方法:
```typescript
graph.emit('event_name', {
// event data
});
```
Further-reading Skill
packages/site/docs/manual/further-reading/iconfont.en.md anthropic-skill ~591 tokens---
title: Using Iconfont
order: 4
---
## Overview
Why use iconfont? It offers great compatibility, a wide variety of icons, and multicolor options. For more details, please visit the [Alibaba Iconfont Platform](https://www.iconfont.cn).

## Usage
### Download Font Icons
First, you need to download the desired font icons from the [iconfont](https://www.iconfont.cn) website. Create a project, select the required icons, and then download the generated icon files.
### Add Font Icons
After downloading, place the directory containing the icon font files (typically including `.eot`, `.woff`, `.ttf`, and `.svg` files, as well as the `iconfont.css` stylesheet) into your project.
You can choose how to include them. Below is an example of how to include them in HTML:
```html
<head>
<style>
@import 'path-to-iconfont/iconfont.css';
</style>
</head>
```
### Using the Font
```js
{
node: {
style: {
iconFontFamily: 'iconfont', // Corresponds to the `font-family` value in iconfont.css
iconText: '\ue7f1', // Corresponds to the `content` value in iconfont.css, make sure to add `u`
iconFill: '#7863FF'
}
}
}
```
### Utility Function `getIcon()`
To make it easier to retrieve icons, you can create a utility function `getIcon`. This function reads the icon information from the `iconfont.json` file and returns the corresponding Unicode character. Note that manually concatenating Unicode (`\\u${icon.unicode}`) won't work. Refer to [MDN String.fromCodePoint](https://developer.mozilla.org/en-US/docs/Web/JavaScript/Reference/Global_Objects/String/fromCodePoint) for details.
First, ensure you have an `iconfont.json` file containing the detailed icon information.
```js
import fonts from 'path-to-iconfont/iconfont.json';
const icons = fonts.glyphs.map((icon) => {
return {
name: icon.font_class,
unicode: String.fromCodePoint(icon.unicode_decimal), // `\\u${icon.unicode}`,
};
});
const getIcon = (type) => {
const matchIcon = icons.find((icon) => {
return icon.name === type;
}) || { unicode: '', name: 'default' };
return matchIcon.unicode;
};
```
Use it in your project:
```js
{
node: {
style: {
iconFontFamily: "iconfont",
iconText: getIcon('logo')
}
}
}
```
Further-reading Skill
packages/site/docs/manual/further-reading/iconfont.zh.md anthropic-skill ~416 tokens---
title: 使用 iconfont
order: 4
---
## 概述
为什么使用 iconfont? 兼容性好、种类多、多色等。在此不做过多介绍,请直接移步 [阿里巴巴-iconfont 平台](https://www.iconfont.cn)。

## 使用
### 下载字体图标
首先,你需要从 [iconfont](https://www.iconfont.cn) 网站下载所需的图标字体。创建一个项目并选择所需的图标,然后下载生成的图标文件。
### 添加字体图标
下载完成后,将包含图标字体文件的目录(通常包括 `.eot`、`.woff`、`.ttf` 和 `.svg` 文件,以及 `iconfont.css` 样式文件)放入你的项目中。
引入方式可自行选择,下面为在 HTML 中引入的例子:
```html
<head>
<style>
@import 'path-to-iconfont/iconfont.css';
</style>
</head>
```
### 使用字体
```js
{
node: {
style: {
iconFontFamily: 'iconfont', // 对应 iconfont.css 中的 `font-family` 属性值
iconText: '\ue7f1', // 对应 iconfont.css 中的 `content` 属性值,注意加 `u`
iconFill: '#7863FF'
}
}
}
```
### 工具函数 `getIcon()`
为了更方便地获取图标,可以创建一个工具函数 `getIcon`。该函数会从图标文件 `iconfont.json` 中读取图标信息并返回相应的 Unicode 字符。这里注意,手动拼接 unicode 是不行的(`\\u${icon.unicode}`)。详细参考 [MDN String.fromCodePoint](https://developer.mozilla.org/en-US/docs/Web/JavaScript/Reference/Global_Objects/String/fromCodePoint)。
首先,确保你有一个 `iconfont.json` 文件,包含图标的详细信息。
```js
import fonts from 'path-to-iconfont/iconfont.json';
const icons = fonts.glyphs.map((icon) => {
return {
name: icon.font_class,
unicode: String.fromCodePoint(icon.unicode_decimal), // `\\u${icon.unicode}`,
};
});
const getIcon = (type: string) => {
const matchIcon = icons.find((icon) => {
return icon.name === type;
}) || { unicode: '', name: 'default' };
return matchIcon.unicode;
};
```
在项目中使用:
```js
{
node: {
style: {
iconFontFamily: "iconfont",
iconText: getIcon('logo')
}
}
}
```
Further-reading Skill
packages/site/docs/manual/further-reading/renderer.en.md anthropic-skill ~556 tokens---
title: renderer
order: 1
---
G6 uses Canvas as the default renderer, but also supports rendering with SVG and WebGL. To switch to the SVG or WebGL renderer, simply pass the `renderer` parameter during initialization.
## Using the SVG Renderer
1. Install the renderer dependency:
```bash
npm install @antv/g-svg
```
2. Configure the renderer:
```javascript
import { Renderer as SVGRenderer } from '@antv/g-svg';
import { Graph } from '@antv/g6';
const graph = new Graph({
// ... other options
// All canvases will use the SVG renderer here
renderer: () => new SVGRenderer(),
});
```
## Using the WebGL Renderer
1. Install the renderer dependency:
```bash
npm install @antv/g-webgl
```
2. Configure the renderer:
```javascript
import { Renderer as WebGLRenderer } from '@antv/g-webgl';
import { Graph } from '@antv/g6';
const graph = new Graph({
// ... other options
// All canvases will use the WebGL renderer here
renderer: () => new WebGLRenderer(),
});
```
## Using Different Renderers for Different Layers
G6 uses layered canvases for rendering, so `renderer` is a callback function that takes the canvas type as a parameter and returns the renderer instance. If you want to use different renderers on different canvases, you can configure it like this:
```javascript
import { Renderer as SVGRenderer } from '@antv/g-svg';
import { Renderer as WebGLRenderer } from '@antv/g-webgl';
const graph = new Graph({
// ... other options
renderer: (layer) => {
// The main canvas uses the WebGL renderer, and the other canvases use the SVG renderer
if (layer === 'main') return new WebGLRenderer();
return new SVGRenderer();
},
});
```
## Switch Renderers Dynamically
G6 does not provide a API to switch the renderer, but you can still update the `renderer` option through the `setOptions` method.
```javascript
import { Renderer as SVGRenderer } from '@antv/g-svg';
import { Renderer as WebGLRenderer } from '@antv/g-webgl';
// Use the WebGL renderer by default
const graph = new Graph({
// ... other options
renderer: () => new WebGLRenderer(),
});
await graph.render();
// Switch to the SVG renderer
graph.setOptions({
renderer: () => new SVGRenderer(),
});
```
Further-reading Skill
packages/site/docs/manual/further-reading/renderer.zh.md anthropic-skill ~398 tokens---
title: 渲染器
order: 1
---
G6 默认使用 Canvas 作为渲染器,但也支持通过 SVG 和 WebGL 进行渲染,要切换到 SVG 或 WebGL 渲染器,只需在初始化时传入 `renderer` 参数即可。
## 使用 SVG 渲染器
1. 安装渲染器依赖:
```bash
npm install @antv/g-svg
```
2. 配置渲染器:
```javascript
import { Renderer as SVGRenderer } from '@antv/g-svg';
import { Graph } from '@antv/g6';
const graph = new Graph({
// ... other options
// 这里所有的画布都会使用 SVG 渲染器
renderer: () => new SVGRenderer(),
});
```
## 使用 WebGL 渲染器
1. 安装渲染器依赖:
```bash
npm install @antv/g-webgl
```
2. 配置渲染器:
```javascript
import { Renderer as WebGLRenderer } from '@antv/g-webgl';
import { Graph } from '@antv/g6';
const graph = new Graph({
// ... other options
// 这里所有的画布都会使用 WebGL 渲染器
renderer: () => new WebGLRenderer(),
});
```
## 分层使用不同的渲染器
G6 采用了分层画布进行渲染,因此 `renderer` 是一个回调函数,参数是画布类型,返回渲染器实例,如果你想在不同的画布上使用不同的渲染器,可以这样配置:
```javascript
import { Renderer as SVGRenderer } from '@antv/g-svg';
import { Renderer as WebGLRenderer } from '@antv/g-webgl';
const graph = new Graph({
// ... other options
renderer: (layer) => {
// 主画布使用 WebGL 渲染器,其他画布使用 SVG 渲染器
if (layer === 'main') return new WebGLRenderer();
return new SVGRenderer();
},
});
```
## 动态切换渲染器
G6 没有提供单独的 API 来切换渲染器,但你仍可以通过 `setOptions` 方法来更新 `renderer` 参数:
```javascript
import { Renderer as SVGRenderer } from '@antv/g-svg';
import { Renderer as WebGLRenderer } from '@antv/g-webgl';
// 初始化时使用 WebGL 渲染器
const graph = new Graph({
// ... other options
renderer: () => new WebGLRenderer(),
});
await graph.render();
// 切换到 SVG 渲染器
graph.setOptions({
renderer: () => new SVGRenderer(),
});
```
Getting-started Skill
packages/site/docs/manual/getting-started/installation.en.md anthropic-skill ~202 tokens---
title: Installation
order: 1
---
## npm
```bash
# npm
npm install @antv/g6 --save
# pnpm
pnpm add @antv/g6
# yarn
yarn add @antv/g6
```
Import G6 in the code:
```js
import { Graph } from '@antv/g6';
```
Visit [G6 npm Example](https://codesandbox.io/p/sandbox/using-g6-from-npm-d9spnr) to view the complete example code.
## CDN
`@antv/g6` Available on multiple CDNs:
- unpkg: https://unpkg.com/@antv/g6@5/dist/g6.min.js
- jsDelivr: https://cdn.jsdelivr.net/npm/@antv/g6@5/dist/g6.min.js
- npmmirror: https://registry.npmmirror.com/@antv/g6/5/files/dist/g6.min.js
Import G6 using a `script` tag:
```html
<script src="https://unpkg.com/@antv/g6@5/dist/g6.min.js"></script>
```
Visit [G6 CDN Example](https://codesandbox.io/p/sandbox/using-g6-from-cdn-xt9ty6) to view the complete example code.
Getting-started Skill
packages/site/docs/manual/getting-started/installation.zh.md anthropic-skill ~175 tokens---
title: 安装
order: 1
---
## npm
```bash
# npm
npm install @antv/g6 --save
# pnpm
pnpm add @antv/g6
# yarn
yarn add @antv/g6
```
在代码中引入 G6:
```js
import { Graph } from '@antv/g6';
```
访问 [G6 npm 示例](https://codesandbox.io/p/sandbox/using-g6-from-npm-d9spnr) 查看完整示例代码。
## CDN
`@antv/g6` 在多个 CDN 上提供:
- unpkg: https://unpkg.com/@antv/g6@latest/dist/g6.min.js
- jsDelivr: https://cdn.jsdelivr.net/npm/@antv/g6@5/dist/g6.min.js
- npmmirror: https://registry.npmmirror.com/@antv/g6/5/files/dist/g6.min.js
使用 `script` 标签引入 G6:
```html
<script src="https://unpkg.com/@antv/g6@5/dist/g6.min.js"></script>
```
访问 [G6 CDN 示例](https://codesandbox.io/p/sandbox/using-g6-from-cdn-xt9ty6) 查看完整示例代码。
Integration Skill
packages/site/docs/manual/getting-started/integration/angular.en.md anthropic-skill ~60 tokens---
title: angular
order: 2
---
Refer to the example below, you can use G6 in Angular, and you can also view the [Live Example](https://stackblitz.com/edit/g6-in-angular?file=src%2Fmain.ts)。
<embed src="@/common/angular-snippet"></embed>
Integration Skill
packages/site/docs/manual/getting-started/integration/angular.zh.md anthropic-skill ~48 tokens---
title: 在 Angular 中使用
order: 2
---
参考下面的示例,你可以在 Angular 中使用 G6,也可以查看 [在线示例](https://stackblitz.com/edit/g6-in-angular?file=src%2Fmain.ts)。
<embed src="@/common/angular-snippet"></embed>
Integration Skill
packages/site/docs/manual/getting-started/integration/react.en.md anthropic-skill ~168 tokens---
title: react
order: 0
---
## Non-Strict Mode
Refer to the example below, you can use G6 in React, and you can also view the [Live Example](https://stackblitz.com/edit/g6-in-react?file=src/App.tsx) 。
<embed src="@/common/react-snippet"></embed>
## Strict Mode
In strict mode, React intentionally mounts, unmounts, and remounts components in development. Create the Graph instance inside an effect, keep it in a ref, and destroy it in the cleanup callback so the first development-only mount does not leave a stale graph behind. The following complete example also shows how to register and render a React node.
<embed src="@/common/react-snippet-strict"></embed>
Integration Skill
packages/site/docs/manual/getting-started/integration/react.zh.md anthropic-skill ~126 tokens---
title: 在 React 中使用
order: 0
---
:::info{title=建议}
如果你需要更完善的 React 与 G6 集成解决方案,可以使用 AntV 官方封装库 [`@antv/graphin`](https://github.com/antvis/graphin)。
:::
## 非严格模式
参考下面的示例,你可以在 React 中使用 G6,也可以查看 [在线示例](https://stackblitz.com/edit/g6-in-react?file=src/App.tsx) 。
<embed src="@/common/react-snippet"></embed>
## 严格模式
在严格模式下,React 会在开发环境中有意执行挂载、卸载、再挂载。请把 Graph 实例放在 effect 里创建,用 ref 保存,并在清理函数中销毁,这样第一次开发态挂载不会留下旧实例。下面的完整示例同时演示了如何注册和渲染 React 节点。
<embed src="@/common/react-snippet-strict"></embed>
Integration Skill
packages/site/docs/manual/getting-started/integration/vue.en.md anthropic-skill ~97 tokens---
title: vue
order: 1
---
:::warning
Please do not pass Vue reactive data directly to the G6 instance, which may cause G6 to fail to render correctly, or even cause the page to crash.
:::
Refer to the example below, you can use G6 in Vue, and you can also view the [Live Example](https://stackblitz.com/edit/g6-in-vue?file=src/App.vue)。
<embed src="@/common/vue-snippet"></embed>
Integration Skill
packages/site/docs/manual/getting-started/integration/vue.zh.md anthropic-skill ~63 tokens---
title: 在 Vue 中使用
order: 1
---
:::warning{title=注意}
请不要将 Vue 响应式数据直接传递给 G6 实例,这可能会导致 G6 无法正确渲染,甚至导致页面崩溃。
:::
参考下面的示例,你可以在 Vue 中使用 G6,也可以查看 [在线示例](https://stackblitz.com/edit/g6-in-vue?file=src/App.vue)。
<embed src="@/common/vue-snippet"></embed>
Getting-started Skill
packages/site/docs/manual/getting-started/quick-start.en.md anthropic-skill ~632 tokens---
title: Quick Start
order: 0
---
## Online Experience with G6
Visit [Chart Examples](/en/examples) to experience G6 online without any environment setup.
## Creating a Simple Graph
In this example, we will create a simple graph using G6 based on an HTML page.
Copy the following code into an HTML file and then open this file in a browser:
```html
<!-- Prepare a container -->
<div id="container" style="width: 500px; height: 500px"></div>
<!-- Import G6's JS file -->
<script src="https://unpkg.com/@antv/g6@5/dist/g6.min.js"></script>
<script>
const { Graph } = G6;
fetch('https://assets.antv.antgroup.com/g6/graph.json')
.then((res) => res.json())
.then((data) => {
const graph = new Graph({
container: 'container',
autoFit: 'view',
data,
node: {
style: {
size: 10,
},
palette: {
field: 'group',
color: 'tableau',
},
},
layout: {
type: 'd3-force',
manyBody: {},
x: {},
y: {},
},
behaviors: ['drag-canvas', 'zoom-canvas', 'drag-element'],
});
graph.render();
});
</script>
```
You will get a graph as shown below:
<embed src="@/common/manual/getting-started/quick-start/simple-graph.md"></embed>
Let's analyze the following code snippet:
1. First, we create a `div` element to serve as the container for the graph:
```html
<div id="container" style="width: 500px; height: 500px"></div>
```
2. Then, include the G6's JS file:
```html
<script src="https://unpkg.com/@antv/g6@5/dist/g6.min.js"></script>
```
3. Use the `fetch` method to obtain the graph's data:
```js
fetch('https://assets.antv.antgroup.com/g6/graph.json').then((res) => res.json());
```
4. Finally, create an instance of the graph, pass in the configuration object, and call the `render` method to render the graph:
```js
const { Graph } = G6;
const graph = new Graph({
container: 'container',
autoFit: 'view',
data,
node: {
style: {
size: 10,
},
palette: {
field: 'group',
color: 'tableau',
},
},
layout: {
type: 'd3-force',
manyBody: {},
x: {},
y: {},
},
behaviors: ['drag-canvas', 'zoom-canvas', 'drag-element'],
});
graph.render();
```
If you are using frameworks such as React, Vue, Angular, etc., you can refer to:
- [Using G6 in React](./integration/react)
- [Using G6 in Vue](./integration/vue)
- [Using G6 in Angular](./integration/angular)
Getting-started Skill
packages/site/docs/manual/getting-started/quick-start.zh.md anthropic-skill ~508 tokens---
title: 快速开始
order: 0
---
## 在线体验 G6
访问 [图表示例](/examples) 无需任何环境配置即可在线体验 G6。
## 创建一个简单的图
在本例子中,我们将基于 HTML 页面使用 G6 创建一个简单的图。
将下面的代码复制到一个 HTML 文件中,然后在浏览器中打开这个文件:
```html
<!-- 准备一个容器 -->
<div id="container" style="width: 500px; height: 500px"></div>
<!-- 引入 G6 的 JS 文件 -->
<script src="https://unpkg.com/@antv/g6@5/dist/g6.min.js"></script>
<script>
const { Graph } = G6;
fetch('https://assets.antv.antgroup.com/g6/graph.json')
.then((res) => res.json())
.then((data) => {
const graph = new Graph({
container: 'container',
autoFit: 'view',
data,
node: {
style: {
size: 10,
},
palette: {
field: 'group',
color: 'tableau',
},
},
layout: {
type: 'd3-force',
manyBody: {},
x: {},
y: {},
},
behaviors: ['drag-canvas', 'zoom-canvas', 'drag-element'],
});
graph.render();
});
</script>
```
会得到如下所示的图:
<embed src="@/common/manual/getting-started/quick-start/simple-graph.md"></embed>
下面分析一下这段代码:
1. 首先我们创建一个 `div` 元素作为图的容器:
```html
<div id="container" style="width: 500px; height: 500px"></div>
```
2. 然后引入 G6 的 JS 文件:
```html
<script src="https://unpkg.com/@antv/g6@5/dist/g6.min.js"></script>
```
3. 使用 `fetch` 方法获取图的数据:
```js
fetch('https://assets.antv.antgroup.com/g6/graph.json').then((res) => res.json());
```
4. 最后创建一个图实例,传入配置对象,并调用 `render` 方法渲染图:
```js
const { Graph } = G6;
const graph = new Graph({
container: 'container',
autoFit: 'view',
data,
node: {
style: {
size: 10,
},
palette: {
field: 'group',
color: 'tableau',
},
},
layout: {
type: 'd3-force',
manyBody: {},
x: {},
y: {},
},
behaviors: ['drag-canvas', 'zoom-canvas', 'drag-element'],
});
graph.render();
```
如果你使用 React、Vue、Angular 等框架,可以查看:
- [在 React 中使用 G6](./integration/react)
- [在 Vue 中使用 G6](./integration/vue)
- [在 Angular 中使用 G6](./integration/angular)
Getting-started Skill
packages/site/docs/manual/getting-started/step-by-step.en.md anthropic-skill ~2,639 tokens---
title: Step-by-step guide
order: 3
---
This tutorial will guide you through the development of a G6 chart from scratch, and along the way, you will learn and understand the main concepts of G6.
## Create Application
We will use Vite to create a simple front-end application.
### Initialization
First, create an empty directory:
```bash
mkdir g6-tutorial
cd g6-tutorial
```
Initialize the project:
```bash
npm init -y
```
Install G6:
```bash
npm install @antv/g6 --save
```
Vite is a new type of front-end build tool that is based on ESModule and can quickly start up projects.
Install Vite:
```bash
npm install vite --save-dev
```
Add a start script to the `package.json`:
```json
{
"scripts": {
"dev": "vite"
}
}
```
### Create Files
Create the `index.html` and `main.ts` files with the following content:
**index.html**:
```html
<!doctype html>
<html>
<head>
<title>@antv/g6 Tutorial</title>
</head>
<body>
<div id="container"></div>
<script type="module" src="main.ts"></script>
</body>
</html>
```
**main.ts**:
```typescript
alert('Hello, G6!');
```
### Start project
```bash
npm run dev
```
Open a web browser and visit the address output in the terminal (typically: http://127.0.0.1:5173/), and you will see a pop-up displaying "Hello, G6!".
## Creating a Simple Graph
Next, we will create a simple chart using G6.
### Preparing the Data
G6 uses JSON-formatted data to describe the graph, which usually includes nodes and edges. We will use the following prepared data:
```js
const data = {
nodes: [
{ id: 'node-1', style: { x: 50, y: 50 } },
{ id: 'node-2', style: { x: 150, y: 50 } },
],
edges: [{ source: 'node-1', target: 'node-2' }],
};
```
The data includes two nodes and one edge. The `id` attribute for nodes is mandatory, and the position of each node is set in the `style`. The `source` and `target` attributes of the edge represent the `id` of the starting node and the ending node, respectively.
### Creating and Drawing the Graph
Create an instance of the Graph, pass in a configuration object that includes the container and data, and then call the `render` method to draw the Graph:
```typescript
import { Graph } from '@antv/g6';
const graph = new Graph({
container: 'container',
data: {
nodes: [
{ id: 'node-1', style: { x: 50, y: 50 } },
{ id: 'node-2', style: { x: 150, y: 50 } },
],
edges: [{ source: 'node-1', target: 'node-2' }],
},
});
graph.render();
```
As shown below, you can see that the chart has been successfully drawn:
<embed src="@/common/manual/getting-started/step-by-step/create-chart.md"></embed>
### Element
Next, we will introduce how to configure the style and types of elements in the canvas.
G6 provides various mechanisms to configure element styles, which can be done in the data itself or within the chart instance. In the previous example, we configured the position of the nodes in the data. Next, we will configure the styles of nodes and edges in the graph configuration options:
<!-- TODO -->
```js
import { Graph } from '@antv/g6';
const graph = new Graph({
container: 'container',
data: {
nodes: [
{ id: 'node-1', style: { x: 50, y: 50 } },
{ id: 'node-2', style: { x: 150, y: 50 } },
],
edges: [{ source: 'node-1', target: 'node-2' }],
},
node: {
style: {
fill: 'pink',
},
},
edge: {
style: {
stroke: 'lightgreen',
},
},
});
graph.render();
```
As the code shows, we have configured the fill color of the nodes to be pink and the stroke color of the edges to be light green within the chart instance. You can see the effect in the example below:
<embed src="@/common/manual/getting-started/step-by-step/elements-1.md"></embed>
The key parts are the `node.style` and `edge.style` options, which are used to configure the styles of nodes and edges, respectively.
> In the subsequent code examples, we will only display the parts of the options. For the complete code of this project, please refer to the [Complete Example](https://codesandbox.io/s/g6-tutorial).
Next, we will demonstrate more types of nodes by setting the node type:
```js
{
node: {
type: (datum) => datum.id === 'node-1' ? 'circle' : 'rect',
style: {
fill: 'pink',
size: 20
}
}
}
```
In the code above, we set the `type` attribute of the node, which can be a string or a function. When `type` is a function, the argument of the function is the current node's data object, and the return value is the type of the node.
> Similarly, each attribute under the `style` style of an element can also be a function, with the argument being the current element's data object.
> You can even set the entire `style` property as a function, allowing you to dynamically set the element's style based on the data object.
The circular node (`circle`) is the default node type in G6. Here, we set the type of the first node to a circle and the type of the second node to a rectangle.
At the same time, we also set the size of the nodes to 20, so the first node is a circle with a radius of 10, and the second node is a square with a side length of 20.
> If you want to set the size of the rectangular node to 20x10, you can set `size` to an array `[20, 10]`.
You can see the effect in the example below:
<embed src="@/common/manual/getting-started/step-by-step/elements-2.md"></embed>
### Behaviors
The chart provided in the previous example is static. Next, we will add some interactive behaviors.
G6 offers a variety of interactive behaviors. We will add a few commonly used Behaviors to allow users to drag, zoom the canvas, and drag nodes.
```js
{
behaviors: ['drag-canvas', 'zoom-canvas', 'drag-element'];
}
```
Try dragging nodes and the canvas in the example below, and use the scroll wheel to zoom in and out on the canvas:
<embed src="@/common/manual/getting-started/step-by-step/behaviors.md"></embed>
### Layout
In the previous example, we manually set the positions of the nodes. However, this can become very difficult when there are many nodes.
Layout algorithms can automatically adjust the positions of nodes based on certain rules. G6 provides a variety of layout algorithms, such as tree layout, force-directed layout, and so on.
First, generate a set of data that does not include position information:
```js
const data = {
nodes: Array.from({ length: 10 }).map((_, i) => ({ id: `node-${i}` })),
edges: Array.from({ length: 9 }).map((_, i) => ({ source: `node-0`, target: `node-${i + 1}` })),
};
```
By default, if a node does not have position information, G6 will place the node at the top-left corner, that is, at the coordinates `(0, 0)`.
Next, we will use the `d3-force` layout algorithm, which is a force-directed layout algorithm that can simulate the forces of attraction and repulsion between nodes, allowing the nodes to automatically adjust to suitable positions.
```js
{
layout: {
type: 'd3-force',
},
}
```
View the example below, and you can see that the nodes have automatically adjusted to suitable positions:
<details>
<summary>Complete Code</summary>
```js
import { Graph } from '@antv/g6';
const graph = new Graph({
container: 'container',
data: {
nodes: Array.from({ length: 10 }).map((_, i) => ({ id: `node-${i}` })),
edges: Array.from({ length: 9 }).map((_, i) => ({ source: `node-0`, target: `node-${i + 1}` })),
},
node: {
style: {
size: 20,
fill: 'pink',
},
},
edge: {
style: {
stroke: 'lightgreen',
},
},
behaviors: ['drag-canvas', 'zoom-canvas', 'drag-element'],
layout: {
type: 'd3-force',
},
});
graph.render();
```
</details>
<embed src="@/common/manual/getting-started/step-by-step/layout.md"></embed>
### Palette
Similarly, when there are many nodes, manually setting the color of each node can become difficult. G6 provides a palette mechanism that makes it easy to assign colors to elements.
Palettes typically assign colors to elements based on a specific field in the data, such as the type of node, the weight of an edge, etc.
Below, we add a `category` field in the data:
```js
const data = {
nodes: Array.from({ length: 10 }).map((_, i) => ({
id: `node-${i}`,
data: { category: i === 0 ? 'central' : 'around' },
})),
edges: Array.from({ length: 9 }).map((_, i) => ({ source: `node-0`, target: `node-${i + 1}` })),
};
```
Then, use the `tableau` palette to set the colors for the nodes, where the `field` attribute specifies the field in the data, and the `color` attribute specifies the name of the palette.
```js
{
node: {
palette: {
field: 'category',
color: 'tableau',
}
}
}
```
> It is important to note that the `fill` style in `node.style` should be removed, as its priority is higher than the colors assigned by the palette.
<embed src="@/common/manual/getting-started/step-by-step/palette.md"></embed>
### Plugins
The plugin mechanism is an important feature of G6, which allows you to extend the functionality of G6 through plugins. G6 provides a wealth of built-in plugins, such as `tooltip`, `legend`, etc., and also supports user-defined plugins.
Below, we will use the `grid-line` plugin to add grid lines to the canvas:
```js
{
plugins: ['grid-line'],
}
```
You can see that grid lines have been added to the canvas:
<embed src="@/common/manual/getting-started/step-by-step/plugins-1.md"></embed>
The plugin configuration mentioned above used a shorthand form. Most plugins support the passing of additional parameters. For example, the `grid-line` plugin allows you to configure the `follow` property to specify whether the grid lines should follow the canvas when it is dragged.
```js
{
plugins: [{ type: 'grid-line', follow: true }];
}
```
Try dragging the canvas in the example below, and you will see that the grid lines move along with the canvas:
<embed src="@/common/manual/getting-started/step-by-step/plugins-2.md"></embed>
## Summary
In this tutorial, we created a G6 chart from scratch and became acquainted with the main concepts of G6. We learned how to create a simple chart, how to configure the style and types of elements, how to add interactive behaviors, how to use layout algorithms, how to use palettes, and how to use plugins.
For a more detailed introduction to the concepts of G6, you can refer to [Core Concepts](/en/manual/graph/graph).
Detailed explanations of options such as elements, layouts, and plugins can be found in the [API](/en/api/data).
Getting-started Skill
packages/site/docs/manual/getting-started/step-by-step.zh.md anthropic-skill ~1,527 tokens---
title: 详细教程
order: 3
---
本教程将引导你从头开始完成一个 G6 图表开发,并在过程中了解和学习 G6 的主要概念。
## 创建应用
我们将使用 Vite 来创建一个简单的前端应用。
### 初始化
首先创建一个空目录:
```bash
mkdir g6-tutorial
cd g6-tutorial
```
初始化项目:
```bash
npm init -y
```
安装 G6:
```bash
npm install @antv/g6 --save
```
Vite 是一个新型的前端构建工具,它基于 ESModule,可以快速启动项目。
安装 Vite:
```bash
npm install vite --save-dev
```
在 `package.json` 中添加启动脚本:
```json
{
"scripts": {
"dev": "vite"
}
}
```
### 创建文件
创建 `index.html` 和 `main.ts` 文件,内容如下:
**index.html**:
```html
<!doctype html>
<html>
<head>
<title>@antv/g6 Tutorial</title>
</head>
<body>
<div id="container"></div>
<script type="module" src="main.ts"></script>
</body>
</html>
```
**main.ts**:
```typescript
alert('Hello, G6!');
```
### 启动项目
```bash
npm run dev
```
打开浏览器访问终端中输出的地址(通常为:http://127.0.0.1:5173/ ),你将看到一个弹窗显示 "Hello, G6!"。
## 创建一个简单的图表
接下来,我们将使用 G6 创建一个简单的图表。
### 准备数据
G6 使用 JSON 格式的数据来描述图,通常包括节点和边。我们将使用下面准备的数据:
```js
const data = {
nodes: [
{ id: 'node-1', style: { x: 50, y: 50 } },
{ id: 'node-2', style: { x: 150, y: 50 } },
],
edges: [{ source: 'node-1', target: 'node-2' }],
};
```
数据中包括两个节点和一条边,节点的 `id` 属性是必须的,并在 `style` 设置了每个节点的位置。边的 `source` 和 `target` 属性分别表示边的起始节点 `id` 和结束节点 `id`。
### 创建并绘制图表
创建一个图表实例,传入一个配置对象,包括容器和数据,然后调用 `render` 方法渲染图表:
```typescript
import { Graph } from '@antv/g6';
const graph = new Graph({
container: 'container',
data: {
nodes: [
{ id: 'node-1', style: { x: 50, y: 50 } },
{ id: 'node-2', style: { x: 150, y: 50 } },
],
edges: [{ source: 'node-1', target: 'node-2' }],
},
});
graph.render();
```
如下所示,可以看到图表已经顺利绘制出来:
<embed src="@/common/manual/getting-started/step-by-step/create-chart.md"></embed>
### 元素
接下来将介绍如何配置画布中的元素样式和种类。
G6 提供了多种机制来配置元素样式,可以在数据中进行配置,也可以在图表实例中进行配置。前面的示例中,我们在数据中配置了节点的位置,接下来我们在图配置项中配置节点和边的样式:
<!-- TODO -->
```js
import { Graph } from '@antv/g6';
const graph = new Graph({
container: 'container',
data: {
nodes: [
{ id: 'node-1', style: { x: 50, y: 50 } },
{ id: 'node-2', style: { x: 150, y: 50 } },
],
edges: [{ source: 'node-1', target: 'node-2' }],
},
node: {
style: {
fill: 'pink',
},
},
edge: {
style: {
stroke: 'lightgreen',
},
},
});
graph.render();
```
正如代码所示,我们在图表实例中配置了节点的填充颜色为粉色,边的描边颜色为浅绿色。你可以在下面的示例中看到效果:
<embed src="@/common/manual/getting-started/step-by-step/elements-1.md"></embed>
其中的关键部分是 `node.style` 和 `edge.style` 配置项,分别用来配置节点和边的样式。
> 在后续的代码示例中,我们仅展示配置项的部分代码,本项目的完整代码请查看 [完整示例](https://codesandbox.io/s/g6-tutorial)。
下面我们将通过设置节点的类型来展示更多的节点种类:
```js
{
node: {
type: (datum) => datum.id === 'node-1' ? 'circle' : 'rect',
style: {
fill: 'pink',
size: 20
}
}
}
```
上面的代码中,我们设置了节点的 `type` 属性,其值可以是一个字符串,也可以是一个函数。当 `type` 是一个函数时,函数的参数是当前节点的数据对象,函数的返回值是节点的类型。
> 同样的,元素中 `style` 样式下的每个属性都可以是一个函数,函数的参数是当前元素的数据对象。
> 你甚至可以将整个 `style` 属性设置为一个函数,这样你可以根据数据对象动态设置元素的样式。
圆形节点(`circle`)是 G6 的默认节点类型,这里我们将第一个节点的类型设置为圆形,第二个节点的类型设置为矩形。
同时我们还将节点的大小设置为 20,因此第一个节点是一个半径为 10 的圆形,第二个节点是一个边长为 20 的正方形。
> 如果你想将矩形节点的大小设置为 20x10,可以将 `size` 设置为一个数组 `[20, 10]`。
你可以在下面的示例中看到效果:
<embed src="@/common/manual/getting-started/step-by-step/elements-2.md"></embed>
### 交互
在上面的例子中提供的图表是静态的,接下来我们将添加一些交互行为。
G6 提供了多种交互行为,我们添加几个常用的交互,使得用户可以拖拽、缩放画布,拖拽节点。
```js
{
behaviors: ['drag-canvas', 'zoom-canvas', 'drag-element'];
}
```
尝试在下面的示例中拖拽节点和画布,并使用滚轮缩放画布:
<embed src="@/common/manual/getting-started/step-by-step/behaviors.md"></embed>
### 布局
在上面的示例中,我们手动设置了节点的位置。但当节点数量较多时,这会变得非常困难。
布局算法可以基于一定的规则自动调整节点的位置,G6 提供了多种布局算法,例如树形布局、力导向布局等。
首先生成一组不包括位置信息的数据:
```js
const data = {
nodes: Array.from({ length: 10 }).map((_, i) => ({ id: `node-${i}` })),
edges: Array.from({ length: 9 }).map((_, i) => ({ source: `node-0`, target: `node-${i + 1}` })),
};
```
默认情况下,如果节点没有位置信息,G6 会将节点放置在左上角,即 `(0, 0)`。
接下来我们使用 `d3-force` 布局算法,它是一种力导向布局算法,可以模拟节点之间的引力和斥力,使得节点自动调整到合适的位置。
```js
{
layout: {
type: 'd3-force',
},
}
```
查看下面的示例,可以看到节点已经自动调整到合适的位置:
<details>
<summary>完整代码</summary>
```js
import { Graph } from '@antv/g6';
const graph = new Graph({
container: 'container',
data: {
nodes: Array.from({ length: 10 }).map((_, i) => ({ id: `node-${i}` })),
edges: Array.from({ length: 9 }).map((_, i) => ({ source: `node-0`, target: `node-${i + 1}` })),
},
node: {
style: {
size: 20,
fill: 'pink',
},
},
edge: {
style: {
stroke: 'lightgreen',
},
},
behaviors: ['drag-canvas', 'zoom-canvas', 'drag-element'],
layout: {
type: 'd3-force',
},
});
graph.render();
```
</details>
<embed src="@/common/manual/getting-started/step-by-step/layout.md"></embed>
### 色板
同样的,当节点数量较多时,手动设置节点的颜色也会变得困难。G6 提供了色板机制,可以便捷地为元素设置颜色。
色板通常会基于数据的某个字段为元素设置颜色,例如节点的类型、边的权重等。
下面我们在数据中的添加 `category` 字段:
```js
const data = {
nodes: Array.from({ length: 10 }).map((_, i) => ({
id: `node-${i}`,
data: { category: i === 0 ? 'central' : 'around' },
})),
edges: Array.from({ length: 9 }).map((_, i) => ({ source: `node-0`, target: `node-${i + 1}` })),
};
```
然后使用 `tableau` 色板为节点设置颜色,`field` 属性指定了数据中的字段,`color` 属性指定了色板的名称。
```js
{
node: {
palette: {
field: 'category',
color: 'tableau',
}
}
}
```
> 需要注意将 `node.style` 中的 `fill` 样式移除,因为其优先级高于色板分配的颜色。
<embed src="@/common/manual/getting-started/step-by-step/palette.md"></embed>
### 插件
插件机制是 G6 的一个重要特性,可以通过插件扩展 G6 的功能。G6 提供了丰富的内置插件,例如 `tooltip`、`legend` 等,也支持用户自定义插件。
下面我们将使用 `grid-line` 插件为画布添加网格线:
```js
{
plugins: ['grid-line'],
}
```
可以看到画布已经添加了网格线:
<embed src="@/common/manual/getting-started/step-by-step/plugins-1.md"></embed>
上面的插件配置项中使用了简写形式,大部分的插件都支持传递额外的参数,例如 `grid-line` 插件可以配置 `follow` 属性来指定拖拽画布时网格线是否跟随画布移动。
```js
{
plugins: [{ type: 'grid-line', follow: true }];
}
```
尝试在下面的示例中拖拽画布,可以看到网格线跟随画布移动:
<embed src="@/common/manual/getting-started/step-by-step/plugins-2.md"></embed>
## 小结
在本教程中,我们从头开始创建了一个 G6 图表,并了解了 G6 的主要概念。我们学习了如何创建一个简单的图表,如何配置元素的样式和种类,如何添加交互行为,如何使用布局算法,如何使用色板,如何使用插件。
关于 G6 更加详细的概念介绍可以在 [核心概念](/manual/graph/graph) 中查看。
图的 API 详细说明可以在 [API](/api/graph) 中查看。
Graph Skill
packages/site/docs/manual/graph/extension.en.md anthropic-skill ~634 tokens---
title: extension
order: 9
---
## Concept
Extension is an important concept in G6, it is a general term for all expandable parts in G6, including the following types:
- Animation
- Behavior
- Element
- Node
- Edge
- Combo
- Layout
- Palette
- Plugin
- Theme
- Transform
## Register Extension
G6 provides the `register` function for registering extensions, for example:
```typescript
import { register, ExtensionCategory } from '@antv/g6';
import { CustomNode } from './my-custom-node';
// # Registering Nodes
register(ExtensionCategory.NODE, 'custom-node', CustomNode);
```
The first parameter of the `register` function is the type of the extension, the second parameter is the name of the extension, and the third parameter is the implementation of the extension(refer to the custom-related sections in the documentation for each extension type).
Different types of extensions **can** use the same extension name, but when registering extensions of the same type, only the first registration will take effect.
```typescript
// ✅
register(ExtensionCategory.NODE, 'custom-name', CustomNode);
register(ExtensionCategory.COMBO, 'custom-name', CustomCombo);
// ❌
register(ExtensionCategory.NODE, 'custom-name', CustomNode);
register(ExtensionCategory.NODE, 'custom-name', CustomNode);
```
## Use Extension
The configuration location for different types of extensions varies, but all are used by specifying the name that was used during registration, for example:
- Using node extensions: `options.node.type`
- Using edge extensions: `options.edge.type`
- Using combo extensions: `options.combo.type`
- Using behavior extensions: `options.behaviors`
- Using layout extensions: `options.layout.type`
- Using plugin extensions: `options.plugins`
- Using theme extensions: `options.theme`
- Using data transform extensions: `options.transform`
- Using palette extensions: `options.node.palette`, `options.edge.palette`, etc.
- Using animation extensions: `options.node.animate`, `options.edge.animate`, etc.
## Get Extension
G6 provides the `getExtension` and `getExtensions` methods to obtain a single extension and all extensions of a specified type, respectively, for example:
```typescript
import { getExtension, getExtensions, ExtensionCategory } from '@antv/g6';
// To get the implementation of the node extension registered with the name 'custom-node'
getExtension(ExtensionCategory.NODE, 'custom-node');
// Retrieve all registered node extension implementations
getExtensions(ExtensionCategory.NODE);
```
Graph Skill
packages/site/docs/manual/graph/extension.zh.md anthropic-skill ~421 tokens---
title: Extension - 扩展
order: 9
---
## 概念
扩展 (Extension) 是 G6 中的一个重要概念,它是 G6 中所有可扩展部分的统称,包括以下几种:
- 动画 (Animation)
- 交互 (Behavior)
- 元素 (Element)
- 节点 (Node)
- 边 (Edge)
- 组合 (Combo)
- 布局 (Layout)
- 色板 (Palette)
- 插件 (Plugin)
- 主题 (Theme)
- 数据转换 (Transform)
## 注册扩展
G6 提供了 `register` 函数用于注册扩展,例如:
```typescript
import { register, ExtensionCategory } from '@antv/g6';
import { CustomNode } from './my-custom-node';
// 注册节点
register(ExtensionCategory.NODE, 'custom-node', CustomNode);
```
`register` 函数的第一个参数是扩展的类型,第二个参数是扩展的名称,第三个参数是扩展的实现(扩展实现参考各扩展类型所在文档的自定义相关章节)。
不同的扩展类型之间**可以**使用相同的扩展名称,但同一类型的扩展重复注册时仅会在第一次注册时生效。
<!-- TODO: 详细的参数签名见:[API 文档](/api/reference/g6/register) -->
```typescript
// ✅
register(ExtensionCategory.NODE, 'custom-name', CustomNode);
register(ExtensionCategory.COMBO, 'custom-name', CustomCombo);
// ❌
register(ExtensionCategory.NODE, 'custom-name', CustomNode);
register(ExtensionCategory.NODE, 'custom-name', CustomNode);
```
## 使用扩展
不同的扩展类型的配置位置有所不同,但都是通过指定注册时所使用的名称来使用扩展,例如:
- 使用节点扩展:`options.node.type`
- 使用边扩展:`options.edge.type`
- 使用组合扩展:`options.combo.type`
- 使用交互扩展:`options.behaviors`
- 使用布局扩展:`options.layout.type`
- 使用插件扩展:`options.plugins`
- 使用主题扩展:`options.theme`
- 使用数据转换扩展:`options.transform`
- 使用色板扩展:`options.node.palette` `options.edge.palette` 等
- 使用动画扩展:`options.node.animate` `options.edge.animate` 等
## 获取扩展
G6 提供了 `getExtension` 和 `getExtensions` 方法分别用于获取指定扩展类型下的单个扩展和所有扩展,例如:
```typescript
import { getExtension, getExtensions, ExtensionCategory } from '@antv/g6';
// 获取注册的名称为 'custom-node' 的节点扩展实现
getExtension(ExtensionCategory.NODE, 'custom-node');
// 获取所有注册的节点扩展实现
getExtensions(ExtensionCategory.NODE);
```
Graph Skill
packages/site/docs/manual/graph/extensions.en.md anthropic-skill ~2,129 tokens---
title: Built-in Extensions
order: 4
The G6 built-in extensions and registered types are as follows:
## Animations
| Extension | Registration Type |
| ------------- | ----------------- |
| ComboCollapse | 'combo-collapse' |
| ComboExpand | 'combo-expand' |
| NodeCollapse | 'node-collapse' |
| NodeExpand | 'node-expand' |
| PathIn | 'path-in' |
| PathOut | 'path-out' |
| Fade | 'fade' |
| Translate | 'translate' |
Usage:
In `GraphOptions.[node|edge|combo].animation.[stage]`, for example:
```ts
const graph = new Graph({
// ... other options
node: {
animation: {
update: 'translate', // Only use translation animation in the update stage
},
},
});
```
## Behaviors
| Extension | Registration Type | Description |
| ------------------------- | ----------------------------- | ---------------------------------------------- |
| BrushSelect | 'brush-select' | / |
| ClickSelect | 'click-select' | / |
| CollapseExpand | 'collapse-expand' | / |
| CreateEdge | 'create-edge' | / |
| DragCanvas | 'drag-canvas' | / |
| DragElementForce | 'drag-element-force' | Drag element when use d3-force layout |
| DragElement | 'drag-element' | / |
| FixElementSize | 'fix-element-size' | Keep the size of element during zooming canvas |
| FocusElement | 'focus-element' | / |
| HoverActivate | 'hover-activate' | / |
| LassoSelect | 'lasso-select' | / |
| OptimizeViewportTransform | 'optimize-viewport-transform' | Hide elements during manipulate the canvas |
| ScrollCanvas | 'scroll-canvas' | / |
| ZoomCanvas | 'zoom-canvas' | / |
Usage:
In `GraphOptions.behaviors`, for example:
```ts
const graph = new Graph({
// ... other options
behaviors: ['drag-canvas', 'zoom-canvas', 'drag-element'],
});
```
## Elements
### Nodes
| Extension | Registration Type |
| --------- | ----------------- |
| circle | Circle |
| diamond | Diamond |
| ellipse | Ellipse |
| hexagon | Hexagon |
| html | HTML |
| image | Image |
| rect | Rect |
| star | Star |
| donut | Donut |
| triangle | Triangle |
Usage:
1. In `GraphOptions.data.nodes[number].type`;
2. In `GraphOptions.node.type`;
```ts
const graph = new Graph({
// ... other options
data: {
nodes: [{ id: 'node-1', type: 'circle' }],
},
node: {
type: 'circle',
},
});
```
### Edges
| Extension | Registration Type | Description |
| --------------- | ------------------ | ----------------------------- |
| Cubic | 'cubic' | Cubic Bezier Curve |
| Line | 'line' | / |
| Polyline | 'polyline' | / |
| Quadratic | 'quadratic' | Quadratic Bezier Curve |
| CubicHorizontal | 'cubic-horizontal' | Horizontal Cubic Bezier Curve |
| CubicVertical | 'cubic-vertical' | Vertical Cubic Bezier Curve |
| CubicRadial | 'cubic-radial' | Radial Cubic Bezier Curve |
Usage(like `Nodes`):
1. In `GraphOptions.data.edges[number].type`;
2. In `GraphOptions.edge.type`;
### Combos
| Extension | Registration Type |
| ----------- | ----------------- |
| CircleCombo | 'circle' |
| RectCombo | 'rect' |
Usage(like `Nodes`):
1. In `GraphOptions.data.combos[number].type`;
2. In `GraphOptions.combo.type`;
## Layouts
| Extension | Registration Type | Description |
| ------------------- | ----------------- | ------------------------------- |
| AntVDagreLayout | 'antv-dagre' | / |
| ComboCombinedLayout | 'combo-combined' | / |
| CompactBoxLayout | 'compact-box' | / |
| ForceAtlas2Layout | 'force-atlas2' | / |
| CircularLayout | 'circular' | / |
| ConcentricLayout | 'concentric' | / |
| D3ForceLayout | 'd3-force' | / |
| DagreLayout | 'dagre' | / |
| DendrogramLayout | 'dendrogram' | / |
| ForceLayout | 'force' | / |
| FruchtermanLayout | 'fruchterman' | / |
| GridLayout | 'grid' | / |
| IndentedLayout | 'indented' | / |
| MDSLayout | 'mds' | Multidimensional Scaling Layout |
| MindmapLayout | 'mindmap' | / |
| RadialLayout | 'radial' | / |
| RandomLayout | 'random' | / |
Usage:
In `GraphOptions.layout`, for example:
```ts
const graph = new Graph({
// ... other options
layout: {
type: 'force',
},
});
```
## Palettes
<embed src="@/common/manual/getting-started/extensions/palettes.md"></embed>
Usage:
In `GraphOptions.[node|edge|combo].palette`, for example:
```ts
const graph = new Graph({
// ... other options
node: {
palette: 'tableau',
},
});
```
## Themes
| Registration Type |
| ----------------- |
| dark |
| light |
Usage:
In `GraphOptions.theme`, for example:
```ts
const graph = new Graph({
// ... other options
theme: 'dark',
});
```
## Plugins
| Extension | Registration Type |
| -------------- | ------------------ |
| BubbleSets | 'bubble-sets' |
| EdgeFilterLens | 'edge-filter-lens' |
| GridLine | 'grid-line' |
| Background | 'background' |
| Contextmenu | 'contextmenu' |
| Fisheye | 'fisheye' |
| Fullscreen | 'fullscreen' |
| History | 'history' |
| Hull | 'hull' |
| Legend | 'legend' |
| Minimap | 'minimap' |
| Snapline | 'snapline' |
| Timebar | 'timebar' |
| Toolbar | 'toolbar' |
| Tooltip | 'tooltip' |
| Watermark | 'watermark' |
Usage:
In `GraphOptions.plugins`, for example:
```ts
const graph = new Graph({
// ... other options
plugins: ['minimap', 'contextmenu'],
});
```
## Transforms
| Extension | Registration Type | Description |
| -------------------- | ------------------------ | ----------- |
| ProcessParallelEdges | 'process-parallel-edges' | / |
| PlaceRadialLabels | 'place-radial-labels' | 径向标签 |
Usage:
In `GraphOptions.transform`, for example:
```ts
const graph = new Graph({
// ... other options
transform: ['process-parallel-edges', 'place-radial-labels'],
});
```
## Shapes
| Registration Type |
| ----------------- |
| circle |
| ellipse |
| group |
| html |
| image |
| line |
| path |
| polygon |
| polyline |
| rect |
| text |
| label |
| badge |
Usage:
In the [upsert](http://localhost:8000/en/manual/custom-extension/element#methods) method of the element class when customizing the shape, pass the second parameter:
```ts
this.upsert('shape-key', 'text', { text: 'label', fontSize: 16 }, this);
```
Graph Skill
packages/site/docs/manual/graph/extensions.zh.md anthropic-skill ~1,851 tokens---
title: 内置扩展
order: 4
---
G6 内置扩展及注册扩展类型如下:
## 动画
| 扩展 | 注册类型 | 描述 |
| ------------- | ---------------- | -------- |
| ComboCollapse | 'combo-collapse' | 组合收起 |
| ComboExpand | 'combo-expand' | 组合展开 |
| NodeCollapse | 'node-collapse' | 节点收起 |
| NodeExpand | 'node-expand' | 节点展开 |
| PathIn | 'path-in' | 路径进入 |
| PathOut | 'path-out' | 路径退出 |
| Fade | 'fade' | 渐变 |
| Translate | 'translate' | 平移 |
配置方式:
在 `GraphOptions.[node|edge|combo].animation.[stage]` 中使用,示例:
```ts
const graph = new Graph({
// ... 其他配置
node: {
animation: {
update: 'translate', // 更新阶段仅使用平移动画
},
},
});
```
## 交互
| 扩展 | 注册类型 | 描述 |
| ------------------------- | ----------------------------- | ---------------------- |
| BrushSelect | 'brush-select' | 框选 |
| ClickSelect | 'click-select' | 点击选中 |
| CollapseExpand | 'collapse-expand' | 展开/收起元素 |
| CreateEdge | 'create-edge' | 创建边 |
| DragCanvas | 'drag-canvas' | 拖拽画布 |
| DragElementForce | 'drag-element-force' | 力导向拖拽元素 |
| DragElement | 'drag-element' | 拖拽元素 |
| FixElementSize | 'fix-element-size' | 缩放画布时固定元素大小 |
| FocusElement | 'focus-element' | 聚焦元素 |
| HoverActivate | 'hover-activate' | 悬停激活 |
| LassoSelect | 'lasso-select' | 套索选择 |
| OptimizeViewportTransform | 'optimize-viewport-transform' | 操作画布时隐藏元素 |
| ScrollCanvas | 'scroll-canvas' | 滚动画布 |
| ZoomCanvas | 'zoom-canvas' | 缩放画布 |
配置方式:
在 `GraphOptions.behaviors` 中配置,示例:
```ts
const graph = new Graph({
// ... 其他配置
behaviors: ['drag-canvas', 'zoom-canvas', 'drag-element'],
});
```
## 元素
### 节点
| 扩展 | 注册类型 | 描述 |
| -------- | -------- | ---------- |
| circle | Circle | 圆形节点 |
| diamond | Diamond | 菱形节点 |
| ellipse | Ellipse | 椭圆节点 |
| hexagon | Hexagon | 六边形节点 |
| html | HTML | HTML节点 |
| image | Image | 图片节点 |
| rect | Rect | 矩形节点 |
| star | Star | 星形节点 |
| donut | Donut | 甜甜圈节点 |
| triangle | Triangle | 三角形节点 |
配置方式:
1. 在 `GraphOptions.data.nodes[number].type` 中配置;
2. 在 `GraphOptions.node.type` 中配置;
```ts
const graph = new Graph({
// ... 其他配置
data: {
nodes: [{ id: 'node-1', type: 'circle' }],
},
node: {
type: 'circle',
},
});
```
### 边
| 扩展 | 注册类型 | 描述 |
| --------------- | ------------------ | ------------------ |
| Cubic | 'cubic' | 三次贝塞尔曲线 |
| Line | 'line' | 直线 |
| Polyline | 'polyline' | 折线 |
| Quadratic | 'quadratic' | 二次贝塞尔曲线 |
| CubicHorizontal | 'cubic-horizontal' | 水平三次贝塞尔曲线 |
| CubicVertical | 'cubic-vertical' | 垂直三次贝塞尔曲线 |
| CubicRadial | 'cubic-radial' | 径向三次贝塞尔曲线 |
配置方式同 `节点`:
1. 在 `GraphOptions.data.edges[number].type` 中配置;
2. 在 `GraphOptions.edge.type` 中配置;
### 组合
| 扩展 | 注册类型 | 描述 |
| ----------- | -------- | -------- |
| CircleCombo | 'circle' | 圆形组合 |
| RectCombo | 'rect' | 矩形组合 |
配置方式同 `节点`:
1. 在 `GraphOptions.data.combos[number].type` 中配置;
2. 在 `GraphOptions.combo.type` 中配置;
## 布局
| 扩展 | 注册类型 | 描述 |
| ------------------- | ---------------- | ---------------------- |
| AntVDagreLayout | 'antv-dagre' | AntV Dagre 布局 |
| ComboCombinedLayout | 'combo-combined' | 组合布局 |
| CompactBoxLayout | 'compact-box' | 紧凑树 |
| ForceAtlas2Layout | 'force-atlas2' | ForceAlas2 力导向布局 |
| CircularLayout | 'circular' | 环形布局 |
| ConcentricLayout | 'concentric' | 同心圆布局 |
| D3ForceLayout | 'd3-force' | D3 力导向布局 |
| DagreLayout | 'dagre' | Dagre 布局 |
| DendrogramLayout | 'dendrogram' | 生态树 |
| ForceLayout | 'force' | 力导向布局 |
| FruchtermanLayout | 'fruchterman' | Fruchterman 力导向布局 |
| GridLayout | 'grid' | 网格布局 |
| IndentedLayout | 'indented' | 缩进树 |
| MDSLayout | 'mds' | 高维数据降维布局 |
| MindmapLayout | 'mindmap' | 脑图树 |
| RadialLayout | 'radial' | 径向布局 |
| RandomLayout | 'random' | 随机布局 |
配置方式:
在 `GraphOptions.layout` 中配置,示例:
```ts
const graph = new Graph({
// ... 其他配置
layout: {
type: 'force',
},
});
```
## 色板
<embed src="@/common/manual/getting-started/extensions/palettes.md"></embed>
配置方式:
在 `GraphOptions.[node|edge|combo].palette` 中配置,示例:
```ts
const graph = new Graph({
// ... 其他配置
node: {
palette: 'tableau',
},
});
```
## 主题
| 注册类型 | 描述 |
| -------- | -------- |
| dark | 深色主题 |
| light | 浅色主题 |
配置方式:
在 `GraphOptions.theme` 中配置,示例:
```ts
const graph = new Graph({
// ... 其他配置
theme: 'dark',
});
```
## 插件
| 扩展 | 注册类型 | 描述 |
| -------------- | ------------------ | ---------- |
| BubbleSets | 'bubble-sets' | 气泡集 |
| EdgeFilterLens | 'edge-filter-lens' | 边过滤镜 |
| GridLine | 'grid-line' | 网格线 |
| Background | 'background' | 背景 |
| Contextmenu | 'contextmenu' | 上下文菜单 |
| Fisheye | 'fisheye' | 鱼眼放大镜 |
| Fullscreen | 'fullscreen' | 全屏展示 |
| History | 'history' | 历史记录 |
| Hull | 'hull' | 轮廓包围 |
| Legend | 'legend' | 图例 |
| Minimap | 'minimap' | 小地图 |
| Snapline | 'snapline' | 对齐线 |
| Timebar | 'timebar' | 时间条 |
| Toolbar | 'toolbar' | 工具栏 |
| Tooltip | 'tooltip' | 提示框 |
| Watermark | 'watermark' | 水印 |
配置方式:
在 `GraphOptions.plugins` 中配置,示例:
```ts
const graph = new Graph({
// ... 其他配置
plugins: ['minimap', 'contextmenu'],
});
```
## 数据转换
| 扩展 | 注册类型 | 描述 |
| -------------------- | ------------------------ | -------- |
| ProcessParallelEdges | 'process-parallel-edges' | 平行边 |
| PlaceRadialLabels | 'place-radial-labels' | 径向标签 |
配置方式:
在 `GraphOptions.transforms` 中配置,示例:
```ts
const graph = new Graph({
// ... 其他配置
transform: ['process-parallel-edges', 'place-radial-labels'],
});
```
## 图形
| 注册类型 | 描述 |
| -------- | ------ |
| circle | 圆形 |
| ellipse | 椭圆 |
| group | 分组 |
| html | HTML |
| image | 图片 |
| line | 直线 |
| path | 路径 |
| polygon | 多边形 |
| polyline | 折线 |
| rect | 矩形 |
| text | 文本 |
| label | 标签 |
| badge | 徽标 |
使用方式:
自定义图形时,元素类成员方法 [upsert](/manual/element/node/custom-node) 方法第二个参数传入:
```ts
this.upsert('shape-key', 'text', { text: 'label', fontSize: 16 }, this);
```
Graph Skill
packages/site/docs/manual/graph/graph.en.md anthropic-skill ~793 tokens---
title: Graph
order: 0
---
## Overview
### Definition of Graph
In Chinese, the character "图" (Graph) can often be used to represent many different concepts, such as image,shape,and chart or diagram,etc.
In Graph Theory, a graph is a mathematical structure used to model pairwise relationships between objects, which we typically represent with nodes (or Vertex) and edges (or Link) to denote the objects and the relationships between them.
The "graph" in G6:
- Conceptually, it is the "graph" from Graph Theory, a data structure composed of nodes and edges.
- Visually, a "graph" is a figure composed of a set of graphical elements representing nodes and edges.
- In terms of code implementation, a "graph" is a class capable of transforming data into a graphical display.
### Types of Graph
Graph Theory categorizes graphs into many different types based on their structure and properties, such as:
- Directed Graph and Undirected Graph
- Weighted Graph and Unweighted Graph
- Simple Graph and Multigraph
- Cyclic Graph and Acyclic Graph
- Connected Graph and Disconnected Graph
- Complete Graph and Non-Complete Graph
- Sparse Graph and Dense Graph
- ...
In G6, we provide a universal graph representation capable of depicting the various types of graphs mentioned above, for example:
- Directed Graph and Undirected Graph: Defined by the start and end points of the edges.
- Weighted Graph and Unweighted Graph: Defined by the `weight` data on the edges.
- Simple Graph and Multigraph: Defined by the uniqueness of the edges.
- ...
### Use Scenarios
Graphs are a very versatile data structure that can be used to represent a variety of scenarios, such as:
- Social Networks
- Knowledge Graphs
- Traffic Networks
- Power Grids
In G6, we provide a rich expression capability for graphs that can meet the needs of different scenarios. We also offer a wealth of interactive and animated effects to make the graphs more vivid and intuitive.
## Use G6 Graph
To create a Graph with G6, you first need to import the `@antv/g6` library, and then instantiate the Graph class.
> For installation instructions, refer to: [Getting Started - Installation](/en/manual/getting-started/installation)
The Graph class accepts an instantiation argument object, known as **options** (Options, in visualization theory it is referred to as: `Specification`), which is used to configure the graph's data, element styles, layout, interactions, etc.
```typescript
import { Graph } from '@antv/g6';
const graph = new Graph({
container: 'container',
width: 800,
height: 600,
// ... other other options
});
```
:::warning{title=note}
The instantiation process only configures the basic information of the graph. To render the graph onto the page, you still need to call the `render` method.
:::
- To learn how to quickly create a graph, please refer to [Quick Start](/en/manual/getting-started/quick-start).
- For more detailed information about the configuration options, please refer to [Options](/en/manual/graph/option).
- To gain an in-depth understanding of the concepts within the configuration options, please read the rest of the content in this section.
Graph Skill
packages/site/docs/manual/graph/graph.zh.md anthropic-skill ~1,731 tokens---
title: Graph - 图
order: 0
---
## 什么是 Graph
中文字“图”在大家的传统认知里指的是图画、图像,而图论与可视化中的“图”—— Graph 则有着更精确的定位:主体(objects)与关系(relationships)的组成。它甚至不局限于视觉,主体与关系的数据也可以称为图。
> —— 摘自 [AntV 专栏](https://zhuanlan.zhihu.com/aiux-antv) 文章:[Graph Visualization · 知多少 之 《HelloWorld 图可视化》](https://zhuanlan.zhihu.com/p/83685690)。
在 G6 中,Graph 对象是图的载体,它包含了图上的所有元素(节点、边等),同时挂载了图的相关操作(如交互监听、元素操作、渲染等)。
Graph 对象的完整生命周期包括:
1. **创建**: 通过 `new Graph(options)` 实例化
2. **初始化**: 在创建时进行内部初始化
3. **渲染**: 调用 `graph.render()` 进行首次渲染
4. **更新**: 通过各种 API 更新图的数据和配置
5. **销毁**: 调用 `graph.destroy()` 销毁实例并释放资源
## 使用 G6 Graph
要使用 G6 创建 Graph,首先需要引入 `@antv/g6` 库,然后实例化 Graph 类。
> 安装教程参考:[开始使用 - 安装](/manual/getting-started/installation)
Graph 类接收一个实例化参数对象,称之为**配置项**(Options,在可视化理论中将其称为:`Specification`),用于配置图的数据、元素样式、布局、交互等。
```typescript
import { Graph } from '@antv/g6';
const graph = new Graph({
container: 'container', // 通过 DOM ID 指定容器
width: 800, // 画布宽高(若容器已设尺寸可省略)
height: 600,
data: {
// 初始数据
nodes: [{ id: 'start', data: { label: 'Hello G6!' } }],
},
});
```
:::warning{title=注意}
实例化过程仅是配置图的基本信息,要将图渲染到页面上,还需要调用 `render` 方法
:::
## 图配置项
通过下表速查图的配置项,更多类型定义说明和详细用法请参考 [API - 图配置项](/manual/graph/option)。
| 属性 | 类型 | 默认值 | 描述 |
| ---------------- | ---------------------------------- | ----------- | ------------------------------------------------------------- |
| container | string \| HTMLElement \| Canvas | - | 图容器,可以是 DOM 元素 ID、DOM 元素实例或 Canvas 实例 |
| width | number | 容器宽度 | 画布宽度(像素) |
| height | number | 容器高度 | 画布高度(像素) |
| autoFit | 'view' \| 'center' \| object | - | 自动适配策略,'view'(适应视图)或'center'(居中) |
| autoResize | boolean | false | 是否在窗口大小变化时自动调整画布大小 |
| background | string | - | 画布背景色,也作为导出图片时的背景色 |
| canvas | CanvasConfig | - | 画布配置 |
| cursor | Cursor | `'default'` | 指针样式 |
| devicePixelRatio | number | 2 | 设备像素比 |
| padding | number \| number[] | - | 画布内边距,在自适应时会根据内边距进行适配 |
| renderer | (layer: string) => IRenderer | - | 手动指定渲染器 |
| rotation | number | 0 | 旋转角度(弧度) |
| zoom | number | 1 | 缩放比例 |
| zoomRange | [number, number] | [0.01, 10] | 缩放比例的限制范围 |
| x | number | - | 视口 x 坐标 |
| y | number | - | 视口 y 坐标 |
| data | GraphData | - | 图数据,详见 [数据](/manual/data) |
| node | NodeOptions | - | 节点全局配置,详见 [节点](/manual/element/node/overview) |
| edge | EdgeOptions | - | 边全局配置,详见 [边](/manual/element/edge/overview) |
| combo | ComboOptions | - | 组合全局配置,详见 [组合](/manual/element/combo/overview) |
| animation | boolean \| AnimationEffectTiming | - | 全局动画配置,详见 [动画](/manual/animation/animation) |
| theme | string \| false | `'light'` | 主题配置,支持 `'light'`、`'dark'` 或自定义主题名 |
| layout | LayoutOptions \| LayoutOptions[] | - | 布局配置,详见 [布局](/manual/layout/overview) |
| behaviors | (string \| CustomBehaviorOption)[] | - | 交互行为配置,详见 [交互](/manual/behavior/overview) |
| plugins | (string \| CustomPluginOption)[] | - | 插件配置,详见 [插件](/manual/plugin/overview) |
| transforms | TransformOptions | - | 数据转换器配置,详见 [数据转换器](/manual/transform/overview) |
## 图属性
图实例提供了一些只读属性,用于获取图的状态信息:
| 属性 | 类型 | 描述 |
| --------- | ------- | ------------------------ |
| destroyed | boolean | 当前图实例是否已被销毁 |
| rendered | boolean | 当前图实例是否已完成渲染 |
## 参考示例
### 完整的创建和配置示例
```js | ob { pin: false, inject: true }
import { Graph } from '@antv/g6';
const graph = new Graph({
container: 'container',
width: 300,
height: 200,
width: 300,
height: 200,
padding: 30,
autoResize: true,
// 视口配置
zoom: 0.8,
autoFit: 'view',
padding: 20,
// 主题配置
theme: 'dark',
// 节点配置
node: {
style: {
fill: '#7FFFD4',
stroke: '#5CACEE',
lineWidth: 2,
},
},
// 边配置
edge: {
style: {
stroke: '#A4D3EE',
lineWidth: 1.5,
endArrow: true,
},
},
// 布局配置
layout: {
type: 'force',
preventOverlap: true,
linkDistance: 100,
},
// 交互行为
behaviors: ['drag-canvas', 'zoom-canvas', 'drag-element'],
// 初始数据
data: {
nodes: [
{ id: 'node1', data: { label: '节点1' } },
{ id: 'node2', data: { label: '节点2' } },
],
edges: [{ source: 'node1', target: 'node2', data: { label: '关系' } }],
},
});
graph.render();
```
```typescript
import { Graph } from '@antv/g6';
// 创建图实例
const graph = new Graph({
// 基础配置
container: 'container',
width: 300,
height: 200,
padding: 30,
autoResize: true,
// 视口配置
zoom: 0.8,
autoFit: 'view',
padding: 20,
// 主题配置
theme: 'dark',
// 节点配置
node: {
style: {
fill: '#7FFFD4',
stroke: '#5CACEE',
lineWidth: 2,
},
},
// 边配置
edge: {
style: {
stroke: '#A4D3EE',
lineWidth: 1.5,
endArrow: true,
},
},
// 布局配置
layout: {
type: 'force',
preventOverlap: true,
linkDistance: 100,
},
// 交互行为
behaviors: ['drag-canvas', 'zoom-canvas', 'drag-element'],
// 初始数据
data: {
nodes: [
{ id: 'node1', data: { label: '节点1' } },
{ id: 'node2', data: { label: '节点2' } },
],
edges: [{ source: 'node1', target: 'node2', data: { label: '关系' } }],
},
});
// 渲染图
graph.render();
```
- 要了解如何快速创建一个图,请参考[快速上手](/manual/getting-started/quick-start)。
- 要深入了解配置项中个部分的概念,请阅读本章节的其他内容。
Graph Skill
packages/site/docs/manual/graph/option.en.md anthropic-skill ~6,341 tokens---
title: Options
order: 0
---
## autoFit
> _{ type: 'view'; options?: [FitViewOptions](#fitviewoptions); animation?: [ViewportAnimationEffectTiming](#viewportanimationeffecttiming); } \| { type: 'center'; animation?: [ViewportAnimationEffectTiming](#viewportanimationeffecttiming); } \| 'view' \| 'center'_
Whether to automatically fit the canvas. ⚠️ **Note**: Each time `render` is executed, it will adapt according to `autoFit`.
Two basic adaptation modes:
- `'view'` - Automatically scale to ensure all content is visible within the view
- `'center'` - Center the content without changing the zoom level
More precise adaptation control can be achieved through object form:
```javascript
const graph = new Graph({
autoFit: {
type: 'view', // Adaptation type: 'view' or 'center'
options: {
// Only applicable to 'view' type
when: 'overflow', // When to adapt: 'overflow' (only when content overflows) or 'always' (always adapt)
direction: 'x', // Adaptation direction: 'x', 'y', or 'both'
},
animation: {
// Adaptation animation effect
duration: 1000, // Animation duration (milliseconds)
easing: 'ease-in-out', // Animation easing function
},
},
});
```
#### FitViewOptions
| Property | Description | Type | Default | Required |
| --------- | ----------------------------------------------------------------------------------------------------------------------------------------------------------------------- | -------------------------- | ---------- | -------- |
| when | Adaptation occurs under the following conditions <br/> - `'overflow'` adapt only when content overflows <br/> - `'always'` always adapt | `'overflow'` \| `'always'` | `'always'` | |
| direction | Adapt only in the specified direction <br/> - `'x'` adapt only in x direction <br/> - `'y'` adapt only in y direction <br/> - `'both'` adapt in both x and y directions | `'x'` \| `'y'` \| `'both'` | `'both'` | |
#### ViewportAnimationEffectTiming
```typescript
type ViewportAnimationEffectTiming =
| boolean // true to enable default animation, false to disable animation
| {
easing?: string; // Animation easing function: 'ease-in-out', 'ease-in', 'ease-out', 'linear'
duration?: number; // Animation duration (milliseconds)
};
```
## autoResize
> _boolean_ **Default:** `false`
Whether to automatically resize the canvas.
Implemented based on the `window.onresize` event. When the browser window size changes, the canvas will automatically resize to fit the container.
## background
> _string_
Canvas background color.
This color is used as the background color when exporting images. Any valid CSS color value can be used, such as hexadecimal, RGB, RGBA, etc.
## canvas
> [CanvasConfig](#canvasconfig)
Canvas configuration. Related configuration items under GraphOptions (such as `container`, `width`, `height`, `devicePixelRatio`, `background`, `cursor`) are shortcut configuration items and will be converted to canvas configuration items.
#### CanvasConfig
| Property | Description | Type | Default | Required |
| ---------------- | ------------------------------------------------------------------------------------------ | ------------------------------------------------------------------------------ | ------- | -------- |
| container | Canvas container | string \| HTMLElement | - | |
| devicePixelRatio | Device pixel ratio | number | - | |
| width | Canvas width | number | - | |
| height | Canvas height | number | - | |
| cursor | Cursor style, same as [GraphOptions.cursor](#cursor) | string | - | |
| background | Canvas background color | string | - | |
| renderer | Renderer, same as [GraphOptions.renderer](#renderer) | (layer: `'background'` \| `'main'` \| `'label'` \| `'transient'`) => IRenderer | - | |
| enableMultiLayer | Whether to enable multi-layer. Non-dynamic parameter, effective only during initialization | boolean | - | |
## container
> _string \|_ _HTMLElement_ _\|_ Canvas
Canvas container, can be one of the following three assignments:
- ID string of the DOM element, such as `'container'`
- HTML element object, such as `document.getElementById('container')`
- Canvas instance, such as `new Canvas(options)`, where `options` is of type [CanvasConfig](#canvasconfig).
## cursor
> string
Cursor style, controls the cursor shape when hovering over the canvas. Any valid CSS cursor value can be used.
Supported values include: `'auto'`, `'default'`, `'none'`, `'context-menu'`, `'help'`, `'pointer'`, `'progress'`, `'wait'`, `'cell'`, `'crosshair'`, `'text'`, `'vertical-text'`, `'alias'`, `'copy'`, `'move'`, `'no-drop'`, `'not-allowed'`, `'grab'`, `'grabbing'`, `'all-scroll'`, `'col-resize'`, `'row-resize'`, `'n-resize'`, `'e-resize'`, `'s-resize'`, `'w-resize'`, `'ne-resize'`, `'nw-resize'`, `'se-resize'`, `'sw-resize'`, `'ew-resize'`, `'ns-resize'`, `'nesw-resize'`, `'nwse-resize'`, `'zoom-in'`, `'zoom-out'.
Cursor values are referenced from [MDN - cursor](https://developer.mozilla.org/en-US/docs/Web/CSS/cursor).
## devicePixelRatio
> _number_
Device pixel ratio.
Used for high-definition screens, the default is [window.devicePixelRatio](https://developer.mozilla.org/en-US/docs/Web/API/Window/devicePixelRatio).
## width
> _number_
Canvas width. If not set, the container width will be automatically obtained.
## height
> _number_
Canvas height. If not set, the container height will be automatically obtained.
## renderer
> _(layer: 'background' \| 'main' \| 'label' \| 'transient') =>_ _IRenderer_
Manually specify the renderer
G6 uses a layered rendering approach, divided into four layers: `background`, `main`, `label`, `transient`. Users can set the renderer for each layer of the canvas through this configuration item.
**Example**: Use SVG renderer for rendering
```javascript
import { Renderer as SVGRenderer } from '@antv/g-svg';
import { Graph } from '@antv/g6';
const graph = new Graph({
renderer: () => new SVGRenderer(),
});
```
## padding
> _number \| number[]_
Canvas padding
Usually, during adaptation, it will be adapted according to the padding. It can be a single value (same padding on all sides) or an array form (specify the padding for top, right, bottom, left in order).
**Example:**
```javascript
// Single value
const graph1 = new Graph({
padding: 20, // 20 pixels of padding on all sides
});
// Array form
const graph2 = new Graph({
padding: [20, 40, 20, 40], // Padding for top, right, bottom, left
});
```
## rotation
> _number_ **Default:** `0`
Rotation angle (in radians)
## x
> _number_
Viewport x coordinate, sets the initial horizontal position of the viewport.
## y
> _number_
Viewport y coordinate, sets the initial vertical position of the viewport.
## zoom
> _number_ **Default:** `1`
Sets the initial zoom level of the viewport, 1 means 100% (original size).
## zoomRange
> _[number, number]_ **Default:** `[0.01, 10]`
Zoom range, limits the minimum and maximum scale that users can zoom.
## animation
> _boolean \| [AnimationEffectTiming](#animationeffecttiming)_
Enable or disable global animation
When configured as an animation option, animation will be enabled, and this animation configuration will be used as the base configuration for global animation.
#### AnimationEffectTiming
| Property | Description | Type | Default | Required |
| ---------- | ------------------------------ | ------------------------------------------------------------------- | ----------- | -------- |
| delay | Animation delay time | number | - | |
| direction | Animation direction | `'alternate'` \| `'alternate-reverse'` \| `'normal'` \| `'reverse'` | `'forward'` | |
| duration | Animation duration | number | - | |
| easing | Animation easing function | string | - | |
| fill | Fill mode after animation ends | `'auto'` \| `'backwards'` \| `'both'` \| `'forwards'` \| `'none'` | `'none'` | |
| iterations | Animation iteration count | number | - | |
**Example:**
```javascript
// Simple enable
const graph1 = new Graph({
animation: true,
});
// Detailed configuration
const graph2 = new Graph({
animation: {
duration: 500, // Animation duration (milliseconds)
easing: 'ease-in-out', // Easing function
},
});
```
## data
> [GraphData](#graphdata)
Data.
#### GraphData
| Property | Description | Type | Default | Required |
| -------- | ----------- | ------------------------- | ------- | -------- |
| nodes | Node data | [NodeData](#nodedata)[] | - | ✓ |
| edges | Edge data | [EdgeData](#edgedata)[] | - | ✓ |
| combos | Combo data | [ComboData](#combodata)[] | - | ✓ |
#### NodeData
| Property | Description | Type | Default | Required |
| -------- | --------------------------------------------------------------------------------------------------------------------------------------------------- | -------------- | ------- | -------- |
| id | Unique identifier for the node, used to distinguish different nodes | string | - | ✓ |
| type | Node type, built-in node type name or custom node name | string | - | |
| data | Node data, used to store custom data for the node, such as node name, description, etc. Can be accessed in style mapping through callback functions | object | - | |
| style | Node style, including visual attributes such as position, size, color, etc. | object | - | |
| states | Initial state of the node, such as selected, activated, hovered, etc. | string[] | - | |
| combo | ID of the combo to which it belongs, used to organize the hierarchical relationship of nodes, if none, it is null | string \| null | - | |
| children | Collection of child node IDs, used only in tree graph scenarios | string[] | - | |
#### EdgeData
| Property | Description | Type | Default | Required |
| -------- | -------------------------------------------------------------------------------------------------------------- | -------- | ------- | -------- |
| source | Starting node ID of the edge | string | - | ✓ |
| target | Target node ID of the edge | string | - | ✓ |
| id | Unique identifier for the edge | string | - | |
| type | Edge type, built-in edge type name or custom edge name | string | - | |
| data | Edge data, used to store custom data for the edge, can be accessed in style mapping through callback functions | object | - | |
| style | Edge style, including visual attributes such as line color, width, arrow, etc. | object | - | |
| states | Initial state of the edge | string[] | - | |
#### ComboData
| Property | Description | Type | Default | Required |
| -------- | ---------------------------------------------------------------------------------------------------------------- | -------------- | ------- | -------- |
| id | Unique identifier for the combo | string | - | ✓ |
| type | Combo type, built-in combo type name or custom combo name | string | - | |
| data | Combo data, used to store custom data for the combo, can be accessed in style mapping through callback functions | object | - | |
| style | Combo style | object | - | |
| states | Initial state of the combo | string[] | - | |
| combo | Parent combo ID. If there is no parent combo, it is null | string \| null | - | |
**Example:**
```javascript
const graph = new Graph({
data: {
nodes: [
{ id: 'node1', style: { x: 100, y: 100 } },
{ id: 'node2', style: { x: 200, y: 200 } },
],
edges: [{ id: 'edge1', source: 'node1', target: 'node2' }],
combos: [{ id: 'combo1', style: { x: 150, y: 150 } }],
},
});
```
- Read [Data](/en/manual/data) to learn more about graph data, including but not limited to data formats, how to manipulate data, etc.
## node
> [NodeOptions](#nodeoptions)
Node configuration options.
#### NodeOptions
| Property | Description | Type | Default | Required |
| --------- | -------------------------------------------------------------------------------- | -------------------------------------------------------- | -------- | -------- |
| type | Node type, built-in node type name or custom node name | [Type](/en/manual/element/node/base-node#type) | `circle` | |
| style | Node style, including color, size, etc. | [Style](/en/manual/element/node/base-node#style) | - | |
| state | Define the style of the node in different states | [State](/en/manual/element/node/base-node#state) | - | |
| palette | Define the color palette of the node, used to map colors based on different data | [Palette](/en/manual/element/node/base-node#palette) | - | |
| animation | Define the animation effect of the node | [Animation](/en/manual/element/node/base-node#animation) | - | |
See [Node](/en/manual/element/node/base-node) for details
**Example:**
```javascript
const graph = new Graph({
node: {
type: 'circle', // Node type
style: {
fill: '#e6f7ff', // Fill color
stroke: '#91d5ff', // Border color
lineWidth: 1, // Border width
r: 20, // Radius
labelText: (d) => d.id, // Label text
},
// Node state style
state: {
hover: {
lineWidth: 2,
stroke: '#69c0ff',
},
selected: {
fill: '#bae7ff',
stroke: '#1890ff',
lineWidth: 2,
},
},
},
});
```
## edge
> [EdgeOptions](#edgeoptions)
Edge configuration options
#### EdgeOptions
| Property | Description | Type | Default | Required |
| --------- | -------------------------------------------------------------------------------- | -------------------------------------------------------- | ------- | -------- |
| type | Edge type, built-in edge type name or custom edge name | [Type](/en/manual/element/edge/base-edge#type) | `line` | |
| style | Edge style, including color, size, etc. | [Style](/en/manual/element/edge/base-edge#style) | - | |
| state | Define the style of the edge in different states | [State](/en/manual/element/edge/base-edge#state) | - | |
| palette | Define the color palette of the edge, used to map colors based on different data | [Palette](/en/manual/element/edge/base-edge#palette) | - | |
| animation | Define the animation effect of the edge | [Animation](/en/manual/element/edge/base-edge#animation) | - | |
See [Edge](/en/manual/element/edge/base-edge) for details
**Example:**
```javascript
const graph = new Graph({
edge: {
type: 'polyline', // Edge type
style: {
stroke: '#91d5ff', // Edge color
lineWidth: 2, // Edge width
endArrow: true, // Whether there is an arrow
},
// Edge state style
state: {
selected: {
stroke: '#1890ff',
lineWidth: 3,
},
},
},
});
```
## combo
> [ComboOptions](#combooptions)
Combo configuration options
| Property | Description | Type | Default | Required |
| --------- | --------------------------------------------------------------------------------- | ---------------------------------------------------------- | -------- | -------- |
| type | Combo type, built-in combo type name or custom combo name | [Type](/en/manual/element/combo/base-combo#type) | `circle` | |
| style | Combo style, including color, size, etc. | [Style](/en/manual/element/combo/base-combo#style) | - | |
| state | Define the style of the combo in different states | [State](/en/manual/element/combo/base-combo#state) | - | |
| palette | Define the color palette of the combo, used to map colors based on different data | [Palette](/en/manual/element/combo/base-combo#palette) | - | |
| animation | Define the animation effect of the combo | [Animation](/en/manual/element/combo/base-combo#animation) | - | |
See [Combo](/en/manual/element/combo/base-combo) for details
**Example:**
```javascript
const graph = new Graph({
combo: {
type: 'circle', // Combo type
style: {
fill: '#f0f0f0', // Background color
stroke: '#d9d9d9', // Border color
lineWidth: 1, // Border width
},
// Combo state style
state: {
selected: {
stroke: '#1890ff',
lineWidth: 2,
},
},
},
});
```
## layout
> _CustomLayoutOptions \| CustomLayoutOptions[]_
Layout configuration options, can be an object (normal layout) or an array (pipeline layout).
**Example**:
```javascript
const graph = new Graph({
container: 'container',
layout: {
type: 'force', // Force-directed layout
preventOverlap: true, // Prevent node overlap
nodeStrength: -50, // Repulsion between nodes
edgeStrength: 0.5, // Elastic coefficient of edges
iterations: 200, // Number of iterations
animation: true, // Enable layout animation
},
});
```
## theme
> _false \| 'light' \| 'dark' \| string_
Set the theme of the chart, can be the built-in `'light'`, `'dark'` theme, or the name of a custom theme. Set to `false` to use no theme.
## behaviors
> _(string \| [CustomExtensionOptions](#customextensionoptions) \| ((this:Graph) =>CustomExtensionOptions))[]_
Configure the interaction behaviors of the chart, can be a string (using default configuration), an object (custom configuration), or a function (dynamic configuration, the graph instance can be accessed within the function).
**Example:**
```javascript
const graph = new Graph({
behaviors: [
'drag-canvas', // Enable canvas dragging with default configuration
'zoom-canvas', // Enable canvas zooming with default configuration
{
type: 'drag-element', // Custom configuration for dragging elements
key: 'drag-node-only',
enable: (event) => event.targetType === 'node', // Only allow dragging nodes
},
function () {
console.log(this); // Output graph instance
return {
type: 'hover-activate',
};
},
],
});
```
- View [Interaction Overview](/en/manual/behavior/overview) to learn more about interaction principles
- Browse [Built-in Interactions](/en/manual/behavior/auto-adapt-label) to get a list of all built-in interactions and their configuration options
## plugins
> _(string \| [CustomExtensionOptions](#customextensionoptions) \| ((this:Graph) =>CustomExtensionOptions))[]_
Set the plugins of the chart, can be a string (using default configuration), an object (custom configuration), or a function (dynamic configuration, the graph instance can be accessed within the function).
**Example:**
```javascript
const graph = new Graph({
container: 'container',
plugins: [
'minimap', // Enable minimap with default configuration
{
type: 'grid', // Enable grid background
key: 'grid-plugin',
line: {
stroke: '#d9d9d9',
lineWidth: 1,
},
},
{
type: 'toolbar', // Enable toolbar
key: 'graph-toolbar',
position: 'top-right', // Position
},
],
});
```
- View [Plugin Overview](/en/manual/plugin/overview) to learn more about plugin principles
- Browse [Built-in Plugins](/en/manual/plugin/background) to get a list of all built-in plugins and their configuration options
## transforms
> _(string \| [CustomExtensionOptions](#customextensionoptions) \| ((this:Graph) =>CustomExtensionOptions))[]_
Configure data processing, used to process data before rendering, does not affect the original data. Can be a string (using default configuration), an object (custom configuration), or a function (dynamic configuration, the graph instance can be accessed within the function).
**Example:**
```javascript
const graph = new Graph({
transforms: [
'process-parallel-edges', // Process parallel edges with default configuration
{
type: 'map-node-size', // Map node size based on node data
field: 'value', // Use the value of the field
max: 50, // Maximum radius
min: 20, // Minimum radius
},
],
});
```
- View [Data Processing Overview](/en/manual/transform/overview) to learn more about data processing principles
- Browse [Built-in Data Processing](/en/manual/transform/map-node-size) to get a list of all built-in data processing and their configuration options
#### CustomExtensionOptions
```typescript
interface CustomExtensionOption extends Record<string, any> {
/** Extension type */
type: string;
/** Extension key, i.e., unique identifier */
key?: string;
}
```
Graph Skill
packages/site/docs/manual/graph/option.zh.md anthropic-skill ~4,356 tokens---
title: Options 配置项
order: 0
---
## autoFit
> _{ type: 'view'; options?: [FitViewOptions](#fitviewoptions); animation?: [ViewportAnimationEffectTiming](#viewportanimationeffecttiming); } \| { type: 'center'; animation?: [ViewportAnimationEffectTiming](#viewportanimationeffecttiming); } \| 'view' \| 'center'_
是否自动适应画布。⚠️ **注意**:每次执行 `render` 时,都会根据 `autoFit` 进行自适应。
两种基本自适应模式:
- `'view'` - 自动缩放,确保所有内容都在视图内可见
- `'center'` - 内容居中显示,但不改变缩放比例
还可通过对象形式实现更精细的自适应控制:
```javascript
const graph = new Graph({
autoFit: {
type: 'view', // 自适应类型:'view' 或 'center'
options: {
// 仅适用于 'view' 类型
when: 'overflow', // 何时适配:'overflow'(仅当内容溢出时) 或 'always'(总是适配)
direction: 'x', // 适配方向:'x'、'y' 或 'both'
},
animation: {
// 自适应动画效果
duration: 1000, // 动画持续时间(毫秒)
easing: 'ease-in-out', // 动画缓动函数
},
},
});
```
#### FitViewOptions
| 属性 | 描述 | 类型 | 默认值 | 必选 |
| --------- | -------------------------------------------------------------------------------------------------------------- | -------------------------- | ---------- | ---- |
| when | 在以下情况下进行适配 <br/> - `'overflow'` 仅当图内容超出视口时进行适配 <br/> - `'always'` 总是进行适配 | `'overflow`' \| `'always'` | `'always'` | |
| direction | 仅对指定方向进行适配 <br/> - `'x'` 仅适配 x 方向 <br/> - `'y'` 仅适配 y 方向 <br/> - `'both'` 适配 x 和 y 方向 | `'x`' \| `'y`' \| `'both'` | `'both'` | |
#### ViewportAnimationEffectTiming
```typescript
type ViewportAnimationEffectTiming =
| boolean // true 启用默认动画,false 禁用动画
| {
easing?: string; // 动画缓动函数:'ease-in-out'、'ease-in'、'ease-out'、'linear'
duration?: number; // 动画持续时间(毫秒)
};
```
## autoResize
> _boolean_ **默认值:** `false`
是否自动调整画布大小。
基于 `window.onresize` 事件实现。当浏览器窗口大小变化时,画布将自动调整大小以适应容器。
## background
> _string_
画布背景色。
该颜色作为导出图片时的背景色。可以使用任何有效的 CSS 颜色值,如十六进制、RGB、RGBA 等。
## canvas
> [CanvasConfig](#canvasconfig)
画布配置。GraphOptions 下相关配置项(如 `container`、`width`、`height`、`devicePixelRatio`、`background`、`cursor`)为快捷配置项,会被转换为 canvas 配置项。
#### CanvasConfig
| 属性 | 描述 | 类型 | 默认值 | 必填 |
| ---------------- | ------------------------------------------------------ | ------------------------------------------------------------------------------ | ------ | ---- |
| container | 画布容器 | string \| HTMLElement | - | |
| devicePixelRatio | 设备像素比 | number | - | |
| width | 画布宽度 | number | - | |
| height | 画布高度 | number | - | |
| cursor | 指针样式,与 [GraphOptions.cursor](#cursor) 配置相同 | string | - | |
| background | 画布背景色 | string | - | |
| renderer | 渲染器,与 [GraphOptions.renderer](#renderer) 配置相同 | (layer: `'background'` \| `'main'` \| `'label'` \| `'transient'`) => IRenderer | - | |
| enableMultiLayer | 是否启用多图层。非动态参数,仅在初始化时生效 | boolean | - | |
## container
> _string \|_ _HTMLElement_ _\|_ Canvas
画布容器,可以是以下三种赋值之一:
- DOM 元素的 ID 字符串,如 `'container'`
- HTML 元素对象,如 `document.getElementById('container')`
- Canvas 实例,如 `new Canvas(options)`,其中 `options` 为 [CanvasConfig](#canvasconfig) 类型。
## cursor
> string
指针样式,控制鼠标悬停在画布上时的光标形状。可以使用任何有效的 CSS cursor 值。
支持的值有: `'auto'`、`'default'`、`'none'`、`'context-menu'`、`'help'`、`'pointer'`、`'progress'`、`'wait'`、`'cell'`、`'crosshair'`、`'text'`、`'vertical-text'`、`'alias'`、`'copy'`、`'move'`、`'no-drop'`、`'not-allowed'`、`'grab'`、`'grabbing'`、`'all-scroll'`、`'col-resize'`、`'row-resize'`、`'n-resize'`、`'e-resize'`、`'s-resize'`、`'w-resize'`、`'ne-resize'`、`'nw-resize'`、`'se-resize'`、`'sw-resize'`、`'ew-resize'`、`'ns-resize'`、`'nesw-resize'`、`'nwse-resize'`、`'zoom-in'`、`'zoom-out'`。
这里的 Cursor 值参考 [MDN - cursor](https://developer.mozilla.org/zh-CN/docs/Web/CSS/cursor)。
## devicePixelRatio
> _number_
设备像素比。
用于高清屏的设备像素比,默认为 [window.devicePixelRatio](https://developer.mozilla.org/zh-CN/docs/Web/API/Window/devicePixelRatio)。
## width
> _number_
画布宽度。如果未设置,则会自动获取容器宽度。
## height
> _number_
画布高度。如果未设置,则会自动获取容器高度。
## renderer
> _(layer: 'background' \| 'main' \| 'label' \| 'transient') =>_ _IRenderer_
手动指定渲染器
G6 采用了分层渲染的方式,分为 `background`、`main`、`label`、`transient` 四层,用户可以通过该配置项分别设置每层画布的渲染器。
**示例**: 使用 SVG 渲染器进行渲染
```javascript
import { Renderer as SVGRenderer } from '@antv/g-svg';
import { Graph } from '@antv/g6';
const graph = new Graph({
renderer: () => new SVGRenderer(),
});
```
## padding
> _number \| number[]_
画布内边距
通常在自适应时,会根据内边距进行适配。可以是单个数值(四边相同)或者数组形式(按顺序指定上、右、下、左的内边距)。
**示例:**
```javascript
// 单个数值
const graph1 = new Graph({
padding: 20, // 四边均为 20 像素的内边距
});
// 数组形式
const graph2 = new Graph({
padding: [20, 40, 20, 40], // 上、右、下、左的内边距
});
```
## rotation
> _number_ **默认值:** `0`
旋转角度(以弧度为单位)
## x
> _number_
视口 x 坐标,设置视口的初始水平位置。
## y
> _number_
视口 y 坐标,设置视口的初始垂直位置。
## zoom
> _number_ **默认值:** `1`
设置视口的初始缩放级别,1 表示 100%(原始大小)。
## zoomRange
> _[number, number]_ **默认值:** `[0.01, 10]`
缩放范围,限制用户可以缩放的最小和最大比例。
## animation
> _boolean \| [AnimationEffectTiming](#animationeffecttiming)_
启用或关闭全局动画
为动画配置项时,会启用动画,并将该动画配置作为全局动画的基础配置。
#### AnimationEffectTiming
| 属性 | 描述 | 类型 | 默认值 | 必选 |
| ---------- | -------------------- | ------------------------------------------------------------------- | ----------- | ---- |
| delay | 动画延迟时间 | number | - | |
| direction | 动画方向 | `'alternate'` \| `'alternate-reverse'` \| `'normal'` \| `'reverse'` | `'forward'` | |
| duration | 动画持续时间 | number | - | |
| easing | 动画缓动函数 | string | - | |
| fill | 动画结束后的填充模式 | `'auto'` \| `'backwards'` \| `'both'` \| `'forwards'` \| `'none'` | `'none'` | |
| iterations | 动画迭代次数 | number | - | |
**示例:**
```javascript
// 简单启用
const graph1 = new Graph({
animation: true,
});
// 详细配置
const graph2 = new Graph({
animation: {
duration: 500, // 动画持续时间(毫秒)
easing: 'ease-in-out', // 缓动函数
},
});
```
## data
> [GraphData](#graphdata)
数据。
#### GraphData
| 属性 | 描述 | 类型 | 默认值 | 必选 |
| ------ | -------- | ------------------------- | ------ | ---- |
| nodes | 节点数据 | [NodeData](#nodedata)[] | - | ✓ |
| edges | 边数据 | [EdgeData](#edgedata)[] | - | ✓ |
| combos | 组合数据 | [ComboData](#combodata)[] | - | ✓ |
#### NodeData
| 属性 | 描述 | 类型 | 默认值 | 必选 |
| -------- | -------------------------------------------------------------------------------------------- | -------------- | ------ | ---- |
| id | 节点的唯一标识符,用于区分不同的节点 | string | - | ✓ |
| type | 节点类型,内置节点类型名称或者自定义节点的名称 | string | - | |
| data | 节点数据,用于存储节点的自定义数据,例如节点的名称、描述等。可以在样式映射中通过回调函数获取 | object | - | |
| style | 节点样式,包括位置、大小、颜色等视觉属性 | object | - | |
| states | 节点初始状态,如选中、激活、悬停等 | string[] | - | |
| combo | 所属的组合 ID,用于组织节点的层级关系,如果没有则为 null | string \| null | - | |
| children | 子节点 ID 集合,仅在树图场景下使用 | string[] | - | |
#### EdgeData
| 属性 | 描述 | 类型 | 默认值 | 必选 |
| ------ | ---------------------------------------------------------------- | -------- | ------ | ---- |
| source | 边起始节点 ID | string | - | ✓ |
| target | 边目标节点 ID | string | - | ✓ |
| id | 边的唯一标识符 | string | - | |
| type | 边类型,内置边类型名称或者自定义边的名称 | string | - | |
| data | 边数据,用于存储边的自定义数据,可以在样式映射中通过回调函数获取 | object | - | |
| style | 边样式,包括线条颜色、宽度、箭头等视觉属性 | object | - | |
| states | 边初始状态 | string[] | - | |
#### ComboData
| 属性 | 描述 | 类型 | 默认值 | 必选 |
| ------ | -------------------------------------------------------------------- | -------------- | ------ | ---- |
| id | 组合的唯一标识符 | string | - | ✓ |
| type | 组合类型,内置组合类型名称或者自定义组合名称 | string | - | |
| data | 组合数据,用于存储组合的自定义数据,可以在样式映射中通过回调函数获取 | object | - | |
| style | 组合样式 | object | - | |
| states | 组合初始状态 | string[] | - | |
| combo | 组合的父组合 ID。如果没有父组合,则为 null | string \| null | - | |
**示例:**
```javascript
const graph = new Graph({
data: {
nodes: [
{ id: 'node1', style: { x: 100, y: 100 } },
{ id: 'node2', style: { x: 200, y: 200 } },
],
edges: [{ id: 'edge1', source: 'node1', target: 'node2' }],
combos: [{ id: 'combo1', style: { x: 150, y: 150 } }],
},
});
```
- 阅读 [数据](/manual/data) 深入了解图数据,包括不限于数据格式、如何操作数据等。
## node
> [NodeOptions](#nodeoptions)
节点配置项。
#### NodeOptions
| 属性 | 描述 | 类型 | 默认值 | 必选 |
| --------- | -------------------------------------------- | ----------------------------------------------------- | -------- | ---- |
| type | 节点类型,内置节点类型名称或自定义节点的名称 | [Type](/manual/element/node/base-node#type) | `circle` | |
| style | 节点样式,包括颜色、大小等 | [Style](/manual/element/node/base-node#style) | - | |
| state | 定义节点在不同状态下的样式 | [State](/manual/element/node/base-node#state) | - | |
| palette | 定义节点的色板,用于根据不同数据映射颜色 | [Palette](/manual/element/node/base-node#palette) | - | |
| animation | 定义节点的动画效果 | [Animation](/manual/element/node/base-node#animation) | - | |
详见 [Node](/manual/element/node/base-node)
**示例:**
```javascript
const graph = new Graph({
node: {
type: 'circle', // 节点类型
style: {
fill: '#e6f7ff', // 填充色
stroke: '#91d5ff', // 边框色
lineWidth: 1, // 边框宽度
r: 20, // 半径
labelText: (d) => d.id, // 标签文本
},
// 节点状态样式
state: {
hover: {
lineWidth: 2,
stroke: '#69c0ff',
},
selected: {
fill: '#bae7ff',
stroke: '#1890ff',
lineWidth: 2,
},
},
},
});
```
## edge
> [EdgeOptions](#edgeoptions)
边配置项
#### EdgeOptions
| 属性 | 描述 | 类型 | 默认值 | 必选 |
| --------- | -------------------------------------- | ----------------------------------------------------- | ------ | ---- |
| type | 边类型,内置边类型名称或自定义边的名称 | [Type](/manual/element/edge/base-edge#type) | `line` | |
| style | 边样式,包括颜色、大小等 | [Style](/manual/element/edge/base-edge#style) | - | |
| state | 定义边在不同状态下的样式 | [State](/manual/element/edge/base-edge#state) | - | |
| palette | 定义边的色板,用于根据不同数据映射颜色 | [Palette](/manual/element/edge/base-edge#palette) | - | |
| animation | 定义边的动画效果 | [Animation](/manual/element/edge/base-edge#animation) | - | |
详见 [Edge](/manual/element/edge/base-edge)
**示例:**
```javascript
const graph = new Graph({
edge: {
type: 'polyline', // 边类型
style: {
stroke: '#91d5ff', // 边的颜色
lineWidth: 2, // 边的宽度
endArrow: true, // 是否有箭头
},
// 边的状态样式
state: {
selected: {
stroke: '#1890ff',
lineWidth: 3,
},
},
},
});
```
## combo
> [ComboOptions](#combooptions)
组合配置项
| 属性 | 描述 | 类型 | 默认值 | 必选 |
| --------- | -------------------------------------------- | ------------------------------------------------------- | -------- | ---- |
| type | 组合类型,内置组合类型名称或自定义组合的名称 | [Type](/manual/element/combo/base-combo#type) | `circle` | |
| style | 组合样式,包括颜色、大小等 | [Style](/manual/element/combo/base-combo#style) | - | |
| state | 定义组合在不同状态下的样式 | [State](/manual/element/combo/base-combo#state) | - | |
| palette | 定义组合的色板,用于根据不同数据映射颜色 | [Palette](/manual/element/combo/base-combo#palette) | - | |
| animation | 定义组合的动画效果 | [Animation](/manual/element/combo/base-combo#animation) | - | |
详见 [Combo](/manual/element/combo/base-combo)
**示例:**
```javascript
const graph = new Graph({
combo: {
type: 'circle', // 组合类型
style: {
fill: '#f0f0f0', // 背景色
stroke: '#d9d9d9', // 边框色
lineWidth: 1, // 边框宽度
},
// 组合状态样式
state: {
selected: {
stroke: '#1890ff',
lineWidth: 2,
},
},
},
});
```
## layout
> _CustomLayoutOptions \| CustomLayoutOptions[]_
布局配置项,可以是对象(普通布局)或数组(流水线布局)。
**示例**:
```javascript
const graph = new Graph({
container: 'container',
layout: {
type: 'force', // 力导向布局
preventOverlap: true, // 防止节点重叠
nodeStrength: -50, // 节点之间的斥力
edgeStrength: 0.5, // 边的弹性系数
iterations: 200, // 迭代次数
animation: true, // 启用布局动画
},
});
```
## theme
> _false \| 'light' \| 'dark' \| string_
设置图表的主题,可以是内置的 `'light'`、`'dark'` 主题,也可以是自定义主题的名称。设为 `false` 则不使用任何主题。
## behaviors
> _(string \| [CustomExtensionOptions](#customextensionoptions) \| ((this:Graph) =>CustomExtensionOptions))[]_
配置图表的交互行为,可以是字符串(使用默认配置)、对象(自定义配置)或函数(动态配置、函数内可访问图实例)。
**示例:**
```javascript
const graph = new Graph({
behaviors: [
'drag-canvas', // 使用默认配置启用画布拖拽
'zoom-canvas', // 使用默认配置启用画布缩放
{
type: 'drag-element', // 自定义配置拖拽元素
key: 'drag-node-only',
enable: (event) => event.targetType === 'node', // 只允许拖拽节点
},
function () {
console.log(this); // 输出 graph 实例
return {
type: 'hover-activate',
};
},
],
});
```
- 查看 [交互总览](/manual/behavior/overview) 深入了解交互原理
- 浏览 [内置交互](/manual/behavior/auto-adapt-label) 获取所有内置交互列表及其配置选项
## plugins
> _(string \| [CustomExtensionOptions](#customextensionoptions) \| ((this:Graph) =>CustomExtensionOptions))[]_
设置图表的插件,可以是字符串(使用默认配置)、对象(自定义配置)或函数(动态配置、函数内可访问图实例)。
**示例:**
```javascript
const graph = new Graph({
container: 'container',
plugins: [
'minimap', // 启用小地图,使用默认配置
{
type: 'grid', // 启用网格背景
key: 'grid-plugin',
line: {
stroke: '#d9d9d9',
lineWidth: 1,
},
},
{
type: 'toolbar', // 启用工具栏
key: 'graph-toolbar',
position: 'top-right', // 位置
},
],
});
```
- 查看 [插件总览](/manual/plugin/overview) 深入了解插件原理
- 浏览 [内置插件](/manual/plugin/background) 获取所有内置插件列表及其配置项
## transforms
> _(string \| [CustomExtensionOptions](#customextensionoptions) \| ((this:Graph) =>CustomExtensionOptions))[]_
配置数据处理,用于在渲染前对数据进行处理,不会影响原始数据。可以是字符串(使用默认配置)、对象(自定义配置)或函数(动态配置、函数内可访问图实例)。
**示例:**
```javascript
const graph = new Graph({
transforms: [
'process-parallel-edges', // 处理平行边,使用默认配置
{
type: 'map-node-size', // 根据节点数据映射节点大小
field: 'value', // 使用 value 字段的值
max: 50, // 最大半径
min: 20, // 最小半径
},
],
});
```
- 查看 [数据处理总览](/manual/transform/overview) 深入了解数据处理原理
- 浏览 [内置数据处理](/manual/transform/map-node-size) 获取所有内置数据处理列表及其配置项
#### CustomExtensionOptions
```typescript
interface CustomExtensionOption extends Record<string, any> {
/** 拓展类型 */
type: string;
/** 拓展 key,即唯一标识 */
key?: string;
}
```
Manual Skill
packages/site/docs/manual/introduction.en.md anthropic-skill ~1,178 tokens---
title: Introduction
order: 0
---
[](https://github.com/antvis//actions)
[](https://coveralls.io/github/antvis/G6?branch=v5)


[](https://www.npmjs.com/package/@antv/g6)
[](https://npmjs.org/package/@antv/g6)
[](http://isitmaintained.com/project/antvis/g6 'Percentage of issues still open')
<h3 style="text-align: center;">AntV G6</h3>
<h3 style="text-align: center;"><image width="500" src="https://gw.alipayobjects.com/mdn/rms_f8c6a0/afts/img/A*zTjwQaXokeQAAAAAAAAAAABkARQnAQ" /></h3>
<p style="text-align: center;">G6 is a graph visualization engine. It provides capabilities for graph drawing, layout, analysis, interaction, animation, and other aspects of graph visualization. It aims to offer developers a set of tools that are easy to use, professionally reliable, and highly customizable for graph visualization development.</p>
<h4 style="text-align: center; color: #678ff3;">Rich Elements</h4>
<p style="text-align: center;">Built-in 10+ elements to meet the needs of common scenarios.</p>
<h4 style="text-align: center; color: #678ff3;">Flexible Interactions</h4>
<p style="text-align: center;">Built-in 10+ interactions that can be freely combined according to different scenarios.</p>
<h4 style="text-align: center; color: #678ff3;">High-Performance Layout Algorithms</h4>
<p style="text-align: center;">High-performance layouts, built-in 10+ common graph layouts, with support for WebGPU and WASM computational acceleration.</p>
<h4 style="text-align: center; color: #678ff3;">Multicolor Themes for Various Scenarios</h4>
<p style="text-align: center;"><img height="200" src="https://mdn.alipayobjects.com/huamei_qa8qxu/afts/img/A*QjJoSbD7GTwAAAAAAAAAAAAADmJ7AQ/original"></p>
<h4 style="text-align: center; color: #678ff3;">3D Scenes</h4>
<p style="text-align: center;"><img width="400" src="https://mdn.alipayobjects.com/huamei_qa8qxu/afts/img/A*IUOnSbLisyoAAAAAAAAAAAAADmJ7AQ/original"></p>
<p style="text-align: center;"><img width="400" src="https://mdn.alipayobjects.com/huamei_qa8qxu/afts/img/A*BK0OSYplirUAAAAAAAAAAAAADmJ7AQ/original"></p>
<p style="text-align: center;">Supports 3D elements and layouts to create immersive graph visualization scenarios.</p>
<h4 style="text-align: center; color: #678ff3;">High Customizability</h4>
<p style="text-align: center;">Elements, layouts, interactions, and plugins are all customizable, enabling every creative idea you have.</p>
<h4 style="text-align: center; color: #678ff3;">Start Your G6 Journey in Just 3 Minutes</h4>
<p style="text-align: center;">Click to enter 👉 <a href="/manual/getting-started/quick-start">Quick Start</a></p>
<div>
<image width="200" src="https://mdn.alipayobjects.com/huamei_qa8qxu/afts/img/A*YXHtRZUKAZcAAAAAAAAAAAAADmJ7AQ/original" />
<image width="200" src="https://mdn.alipayobjects.com/huamei_qa8qxu/afts/img/A*VChnTLySxScAAAAAAAAAAAAADmJ7AQ/original" />
<image width="200" src="https://mdn.alipayobjects.com/huamei_qa8qxu/afts/img/A*tqlbS7ukmYUAAAAAAAAAAAAADmJ7AQ/original" />
<image width="200" src="https://mdn.alipayobjects.com/huamei_qa8qxu/afts/img/A*I5uDQZWTzMsAAAAAAAAAAAAADmJ7AQ/original" />
<image width="200" src="https://mdn.alipayobjects.com/huamei_qa8qxu/afts/img/A*hnLoRJR8EvMAAAAAAAAAAAAADmJ7AQ/original" />
<image width="200" src="https://mdn.alipayobjects.com/huamei_qa8qxu/afts/img/A*8LqvQJ09-EEAAAAAAAAAAAAADmJ7AQ/original" />
<image width="200" src="https://mdn.alipayobjects.com/huamei_qa8qxu/afts/img/A*UgMZS6vrUlgAAAAAAAAAAAAADmJ7AQ/original" />
<image width="200" src="https://mdn.alipayobjects.com/huamei_qa8qxu/afts/img/A*SDQKSb8gcxgAAAAAAAAAAAAADmJ7AQ/original" />
<image width="200" src="https://mdn.alipayobjects.com/huamei_qa8qxu/afts/img/A*ZC1CT7q0fM4AAAAAAAAAAAAADmJ7AQ/original" />
<image width="200" src="https://mdn.alipayobjects.com/huamei_qa8qxu/afts/img/A*YMxxTZwt54UAAAAAAAAAAAAADmJ7AQ/original" />
<image width="200" src="https://mdn.alipayobjects.com/huamei_qa8qxu/afts/img/A*h3eWT4loiTwAAAAAAAAAAAAADmJ7AQ/original" />
<image width="200" src="https://mdn.alipayobjects.com/huamei_qa8qxu/afts/img/A*XTcoRKPMDloAAAAAAAAAAAAADmJ7AQ/original" />
</div>
Manual Skill
packages/site/docs/manual/introduction.zh.md anthropic-skill ~1,005 tokens---
title: 简介
order: 0
sidebar: false
---

[](https://github.com/antvis//actions)
[](https://coveralls.io/github/antvis/G6?branch=v5)


[](https://www.npmjs.com/package/@antv/g6)
[](https://npmjs.org/package/@antv/g6)
[](http://isitmaintained.com/project/antvis/g6 'Percentage of issues still open')
<h3 style="text-align: center;">AntV G6</h3>
<h3 style="text-align: center;"><image width="500" src="https://gw.alipayobjects.com/mdn/rms_f8c6a0/afts/img/A*zTjwQaXokeQAAAAAAAAAAABkARQnAQ" /></h3>
<p style="text-align: center;">G6 是一个图可视化引擎。它提供了图的绘制、布局、分析、交互、动画等图可视化能力。旨在为开发者提供一套简单易用、专业可靠、可高度定制的图可视化开发工具</p>
<h4 style="text-align: center; color: #678ff3;">丰富元素</h4>
<p style="text-align: center;">内置 10+ 元素,满足常规场景需求</p>
<h4 style="text-align: center; color: #678ff3;">灵活交互</h4>
<p style="text-align: center;">内置 10+ 交互,并可根据不同场景自由组合</p>
<h4 style="text-align: center; color: #678ff3;">高性能布局算法</h4>
<p style="text-align: center;">高性能布局,内置 10+ 常用的图布局,支持 WebGPU、 WASM 计算加速</p>
<h4 style="text-align: center; color: #678ff3;">多色主题,适用多种场景</h4>
<p style="text-align: center;"><image height="200" src="https://mdn.alipayobjects.com/huamei_qa8qxu/afts/img/A*QjJoSbD7GTwAAAAAAAAAAAAADmJ7AQ/original"></p>
<h4 style="text-align: center; color: #678ff3;">3D 场景</h4>
<p style="text-align: center;"><image width="400" src="https://mdn.alipayobjects.com/huamei_qa8qxu/afts/img/A*IUOnSbLisyoAAAAAAAAAAAAADmJ7AQ/original"></p>
<p style="text-align: center;"><image width="400" src="https://mdn.alipayobjects.com/huamei_qa8qxu/afts/img/A*BK0OSYplirUAAAAAAAAAAAAADmJ7AQ/original"></p>
<p style="text-align: center;">支持 3D 元素、布局,打造沉浸式的图可视化场景</p>
<h4 style="text-align: center; color: #678ff3;">高可定制性</h4>
<p style="text-align: center;">元素、布局、交互、插件统统可定制,实现你的每一个创意</p>
<h4 style="text-align: center; color: #678ff3;">仅需 3 分钟,开启 G6 之旅</h4>
<p style="text-align: center;">点击进入👉 <a href="/manual/getting-started/quick-start">快速开始</a></p>
<div>
<image width="200" src="https://mdn.alipayobjects.com/huamei_qa8qxu/afts/img/A*YXHtRZUKAZcAAAAAAAAAAAAADmJ7AQ/original" />
<image width="200" src="https://mdn.alipayobjects.com/huamei_qa8qxu/afts/img/A*VChnTLySxScAAAAAAAAAAAAADmJ7AQ/original" />
<image width="200" src="https://mdn.alipayobjects.com/huamei_qa8qxu/afts/img/A*tqlbS7ukmYUAAAAAAAAAAAAADmJ7AQ/original" />
<image width="200" src="https://mdn.alipayobjects.com/huamei_qa8qxu/afts/img/A*I5uDQZWTzMsAAAAAAAAAAAAADmJ7AQ/original" />
<image width="200" src="https://mdn.alipayobjects.com/huamei_qa8qxu/afts/img/A*hnLoRJR8EvMAAAAAAAAAAAAADmJ7AQ/original" />
<image width="200" src="https://mdn.alipayobjects.com/huamei_qa8qxu/afts/img/A*8LqvQJ09-EEAAAAAAAAAAAAADmJ7AQ/original" />
<image width="200" src="https://mdn.alipayobjects.com/huamei_qa8qxu/afts/img/A*UgMZS6vrUlgAAAAAAAAAAAAADmJ7AQ/original" />
<image width="200" src="https://mdn.alipayobjects.com/huamei_qa8qxu/afts/img/A*SDQKSb8gcxgAAAAAAAAAAAAADmJ7AQ/original" />
<image width="200" src="https://mdn.alipayobjects.com/huamei_qa8qxu/afts/img/A*ZC1CT7q0fM4AAAAAAAAAAAAADmJ7AQ/original" />
<image width="200" src="https://mdn.alipayobjects.com/huamei_qa8qxu/afts/img/A*YMxxTZwt54UAAAAAAAAAAAAADmJ7AQ/original" />
<image width="200" src="https://mdn.alipayobjects.com/huamei_qa8qxu/afts/img/A*h3eWT4loiTwAAAAAAAAAAAAADmJ7AQ/original" />
<image width="200" src="https://mdn.alipayobjects.com/huamei_qa8qxu/afts/img/A*XTcoRKPMDloAAAAAAAAAAAAADmJ7AQ/original" />
</div>
Layout Skill
packages/site/docs/manual/layout/AntvDagreLayout.en.md anthropic-skill ~2,583 tokens---
title: AntvDagre Layout
order: 2
---
## Overview
AntvDagre builds upon the original [dagre](https://github.com/dagrejs/dagre/wiki) layout and adds more useful options, such as `nodeOrder`, `edgeLabelSpace`, and more. The `dagre` layout itself is a hierarchical layout suitable for directed acyclic graphs (DAGs), which can automatically handle node direction and spacing, and supports both horizontal and vertical layouts. See more Dagre layout [examples](/en/examples#layout-dagre), [source code](https://github.com/dagrejs/dagre/blob/master/lib/layout.js), and [official documentation](https://github.com/dagrejs/dagre/wiki).
<img src='https://gw.alipayobjects.com/mdn/rms_f8c6a0/afts/img/A*2uMmRo5wYPUAAAAAAAAAAABkARQnAQ' width=350 alt='Dagre Layout'/>
## Configuration
```js
const graph = new Graph({
layout: {
type: 'antv-dagre',
rankdir: 'TB',
align: 'UL',
nodesep: 50,
ranksep: 50,
controlPoints: false,
},
});
```
## Options
> For more native `dagre` options, refer to the [official documentation](https://github.com/dagrejs/dagre/wiki#configuring-the-layout). Here, only some core and new options are listed.
<img src="https://img.alicdn.com/imgextra/i3/O1CN01OpQHBZ1HcpZuWZLS7_!!6000000000779-0-tps-1274-1234.jpg" width="400" alt="Dagre Layout Options Diagram" />
| Property | Description | Type | Default | Required |
| -------------- | -------------------------------------------------------------------------------------------------------------------------------------------------------------------------------------------------- | --------------------------------------------------- | ------- | -------- |
| type | Layout type | `antv-dagre` | - | ✓ |
| rankdir | Layout direction, options | `TB` \| `BT` \| `LR` \| `RL` | `TB` | |
| align | Node alignment, options | `UL` \| `UR` \| `DL` \| `DR` | `UL` | |
| nodesep | Node spacing (px). For `TB` or `BT`, it's horizontal spacing; for `LR` or `RL`, it's vertical spacing. | number | 50 | |
| nodesepFunc | Callback for node spacing (px), allows different spacing for different nodes. For `TB` or `BT`, it's horizontal spacing; for `LR` or `RL`, it's vertical spacing. Takes precedence over `nodesep`. | (d?: Node) => number | | |
| ranksep | Rank spacing (px). For `TB` or `BT`, it's vertical spacing between adjacent ranks; for `LR` or `RL`, it's horizontal spacing. | number | 50 | |
| ranksepFunc | Callback for rank spacing (px), allows different spacing for different ranks. For `TB` or `BT`, it's vertical spacing; for `LR` or `RL`, it's horizontal spacing. Takes precedence over `ranksep`. | (d?: Node) => number | | |
| ranker | Algorithm for assigning ranks to nodes: `longest-path`, `tight-tree`, or `network-simplex` | `network-simplex` \| `tight-tree` \| `longest-path` | - | |
| nodeSize | Specify node size for all nodes or each node, used for occupying space and spacing calculation | Size \| ((nodeData: Node) => Size) | - | |
| controlPoints | Whether to keep edge control points. Only effective when using built-in polyline edges (`type: 'polyline-edge'`) or any edge that consumes `style.controlPoints` as control points | boolean | false | |
| begin | Top-left alignment position of the layout | [number, number] \| [number, number, number] | - | |
| sortByCombo | Whether to sort nodes in the same rank based on `parentId` in each node's data to avoid Combo overlap | boolean | false | |
| edgeLabelSpace | Whether to reserve space for edge labels | boolean | true | |
| nodeOrder | Reference array for node order in the same rank, storing node ids | string[] | - | |
| radial | Whether to use radial layout based on `dagre` | boolean | - | |
| focusNode | Focus node, only effective when `radial` is true | ID \| Node \| null | - | |
| preset | Reference node positions for layout calculation, usually used to keep transitions smooth when switching data | NodeData[] | - | |
> Note: In G6, the control points computed by `antv-dagre` are written into `edge.style.controlPoints`.
### align
> _DagreAlign_ **Default:** `UL`
Node alignment: U = upper, D = down, L = left, R = right
- `UL`: align to upper left
- `UR`: align to upper right
- `DL`: align to lower left
- `DR`: align to lower right
### rankdir
> _DagreRankdir_ **Default:** `TB`
Layout direction. T = top, B = bottom, L = left, R = right
- `TB`: top to bottom
- `BT`: bottom to top
- `LR`: left to right
- `RL`: right to left
### ranker
> _`network-simplex` \| `tight-tree` \| `longest-path`_
Layout mode
### ranksep
> _number_ **Default:** 50
Rank spacing (px)
For 'TB' or 'BT', it's vertical spacing; for 'LR' or 'RL', it's horizontal spacing. `ranksepFunc` has higher priority.
### ranksepFunc
> _(d?: Node) => number_
Callback for rank spacing (px)
For 'TB' or 'BT', it's vertical spacing; for 'LR' or 'RL', it's horizontal spacing. Takes precedence over nodesep if set.
### nodesep
> _number_ **Default:** 50
Node spacing (px)
For 'TB' or 'BT', it's horizontal spacing; for 'LR' or 'RL', it's vertical spacing. `nodesepFunc` has higher priority.
### nodesepFunc
> _(d?: Node) => number_
Callback for node spacing (px), allows different spacing for different nodes
For 'TB' or 'BT', it's horizontal spacing; for 'LR' or 'RL', it's vertical spacing. Takes precedence over nodesep if set.
### begin
> _[number, number] \| [number, number, number]_ **Default:** undefined
Top-left alignment position of the layout
### controlPoints
> _boolean_ **Default:** false
Whether to keep edge control points. Only effective when using built-in polyline edges (`type: 'polyline-edge'`) or any edge that uses `style.controlPoints` as control points. Adds `style.controlPoints` to edge data.
### edgeLabelSpace
> _boolean_ **Default:** true
Whether to reserve space for edge labels
This affects whether a dummy node is added in the middle of the edge.
### focusNode
> _ID \| Node \| null_
Focus node, only effective when `radial` is true
- ID: node id
- Node: node instance
- null: cancel focus
### nodeOrder
> _string[]_ **Default:** undefined
Reference array for node order in the same rank, stores node ids
If not specified, dagre's default order is used.
### nodeSize
> _Size \| ((nodeData: Node) => Size)_ **Default:** undefined
Specify node size for all or each node.
Used for collision detection to prevent node overlap
### preset
> _OutNode[]_ **Default:** undefined
Reference node positions for layout calculation
Usually for smooth transitions when switching data. In G6, if updating data, the existing layout result is used as input.
### radial
> _boolean_
Whether to use radial layout based on dagre
### sortByCombo
> _boolean_ **Default:** false
Whether to sort nodes in the same rank by their parentId to prevent Combo overlap
Recommended to enable when using Combo
## Suitable Scenarios
- **Flowcharts**: Suitable for displaying flowcharts, node direction and spacing are automatically handled
- **Dependency Graphs**: Display dependencies between packages or modules
- **Task Scheduling Graphs**: Show dependencies and execution order between tasks
## Related Documentation
> The following documents can help you better understand the Dagre layout
- [Graph Layout Algorithms: In-depth Dagre Layout](https://mp.weixin.qq.com/s/EdyTfFUH7fyMefNSBXI2nA)
- [In-depth Dagre Layout Algorithm](https://www.yuque.com/antv/g6-blog/xxp5nl)
Layout Skill
packages/site/docs/manual/layout/AntvDagreLayout.zh.md anthropic-skill ~1,872 tokens---
title: AntV Dagre 布局 AntvDagre
order: 2
---
## 概述
AntvDagre 在原先[dagre](https://github.com/dagrejs/dagre/wiki)布局的基础上增加了更多有用的设置项,比如`nodeOrder`、`edgeLabelSpace`等等。 `dagre`布局本身一种层次化布局,适用于有向无环图(DAG)的布局场景,能够自动处理节点之间的方向和间距,支持水平和垂直布局。参考更多 Dagre 布局[样例](/examples#layout-dagre)或[源码](https://github.com/dagrejs/dagre/blob/master/lib/layout.js)以及[官方文档](https://github.com/dagrejs/dagre/wiki)。
<img src='https://gw.alipayobjects.com/mdn/rms_f8c6a0/afts/img/A*2uMmRo5wYPUAAAAAAAAAAABkARQnAQ' width=350 alt='Dagre布局'/>
## 配置方式
```js
const graph = new Graph({
layout: {
type: 'antv-dagre',
rankdir: 'TB',
align: 'UL',
nodesep: 50,
ranksep: 50,
controlPoints: false,
},
});
```
## 配置项
> 更多`dagre`原生配置项可参考[官方文档](https://github.com/dagrejs/dagre/wiki#configuring-the-layout),这里仅列出部分核心配置和新增的配置
<img src="https://img.alicdn.com/imgextra/i3/O1CN01OpQHBZ1HcpZuWZLS7_!!6000000000779-0-tps-1274-1234.jpg" width="400" alt="Dagre 布局配置项图解" />
| 属性 | 描述 | 类型 | 默认值 | 必选 |
| -------------- | -------------------------------------------------------------------------------------------------------------------------------------------------- | --------------------------------------------------- | ------ | ---- |
| type | 布局类型 | `antv-dagre` | - | ✓ |
| rankdir | 布局方向,可选值 | `TB` \| `BT` \| `LR` \| `RL` | `TB` | |
| align | 节点对齐方式,可选值 | `UL` \| `UR` \| `DL` \| `DR` | `UL` | |
| nodesep | 节点间距(px)。在 rankdir 为 `TB` 或 `BT` 时是节点的水平间距;在 rankdir 为 `LR` 或 `RL` 时代表节点的竖直方向间距 | number | 50 | |
| nodesepFunc | 节点间距(px)的回调函数,优先级高于 `nodesep` | (d?: Node) => number | - | |
| ranksep | 层间距(px)。在 rankdir 为 `TB` 或 `BT` 时是竖直方向相邻层间距;在 rankdir 为 `LR` 或 `RL` 时代表水平方向相邻层间距 | number | 50 | |
| ranksepFunc | 层间距(px)的回调函数,优先级高于 `ranksep` | (d?: Node) => number | - | |
| ranker | 为每个节点分配等级的算法,共支持三种算法:`longest-path`、`tight-tree`、`network-simplex` | `network-simplex` \| `tight-tree` \| `longest-path` | - | |
| nodeSize | 统一指定或为每个节点指定节点大小,用于占位与间距计算 | Size \| ((nodeData: Node) => Size) | - | |
| controlPoints | 是否保留边的控制点,仅在边配置中使用了内置折线(type: 'polyline-edge')时,或任何将自定义消费了 `style.controlPoints` 字段作为控制点位置的边时生效 | boolean | false | |
| begin | 布局的左上角对齐位置 | [number, number] \| [number, number, number] | - | |
| sortByCombo | 同一层节点是否根据每个节点数据中的 `parentId` 进行排序,以防止 Combo 重叠 | boolean | false | |
| edgeLabelSpace | 是否为边的 label 预留位置 | boolean | true | |
| nodeOrder | 同层节点顺序的参考数组,存放节点 id 值 | string[] | - | |
| radial | 是否基于 `dagre` 进行辐射布局 | boolean | - | |
| focusNode | 关注的节点,仅在 `radial` 为 true 时生效 | ID \| Node \| null | - | |
| preset | 布局计算时参考的节点位置,一般用于切换数据时保证重新布局的连续性 | NodeData[] | - | |
> 补充:在 G6 中,`antv-dagre` 计算得到的控制点会被写入边的 `style.controlPoints`。
### align
> _DagreAlign_ **Default:** `UL`
节点对齐方式 U:upper(上);D:down(下);L:left(左);R:right(右)
- `UL`:对齐到左上角
- `UR`:对齐到右上角
- `DL`:对齐到左下角
- `DR`:对齐到右下角
### rankdir
> _DagreRankdir_ **Default:** `TB`
布局的方向。T:top(上);B:bottom(下);L:left(左);R:right(右)
- `TB`:从上至下布局
- `BT`:从下至上布局
- `LR`:从左至右布局
- `RL`:从右至左布局
### ranker
> _`network-simplex` \| `tight-tree` \| `longest-path`_
布局的模式
### ranksep
> _number_ **Default:** 50
层间距(px)
在 rankdir 为 'TB' 或 'BT' 时是竖直方向相邻层间距;在 rankdir 为 'LR' 或 'RL' 时代表水平方向相邻层间距。ranksepFunc 拥有更高的优先级
### ranksepFunc
> _(d?: Node) => number_
层间距(px)的回调函数
在 rankdir 为 'TB' 或 'BT' 时是竖直方向相邻层间距;在 rankdir 为 'LR' 或 'RL' 时代表水平方向相邻层间距。优先级高于 nodesep,即若设置了 nodesepFunc,则 nodesep 不生效
### nodesep
> _number_ **Default:** 50
节点间距(px)
在 rankdir 为 'TB' 或 'BT' 时是节点的水平间距;在 rankdir 为 'LR' 或 'RL' 时代表节点的竖直方向间距。nodesepFunc 拥有更高的优先级
### nodesepFunc
> _(d?: Node) => number_
节点间距(px)的回调函数,通过该参数可以对不同节点设置不同的节点间距
在 rankdir 为 'TB' 或 'BT' 时是节点的水平间距;在 rankdir 为 'LR' 或 'RL' 时代表节点的竖直方向间距。优先级高于 nodesep,即若设置了 nodesepFunc,则 nodesep 不生效
### begin
> _[number, number] \| [number, number, number]_ **Default:** undefined
布局的左上角对齐位置
### controlPoints
> _boolean_ **Default:** false
是否保留边的控制点,仅在边配置中使用了内置折线(type: 'polyline-edge') 时,或任何将自定义消费了 `style.controlPoints` 字段作为控制点位置的边时生效。本质上就是给边数据增加了 `style.controlPoints`
### edgeLabelSpace
> _boolean_ **Default:** true
是否为边的label留位置
这会影响是否在边中间添加dummy node
### focusNode
> _ID \| Node \| null_
关注的节点,注意,仅在`radial` 为 true 时生效
- ID: 节点 id
- Node: 节点实例
- null: 取消关注
### nodeOrder
> _string[]_ **Default:** undefined
同层节点顺序的参考数组,存放节点 id 值
若未指定,则将按照 dagre 本身机制排列同层节点顺序
### nodeSize
> _Size \| ((nodeData: Node) => Size)_ **Default:** undefined
统一指定或为每个节点指定节点大小。
用于防止节点重叠时的碰撞检测
### preset
> _OutNode[]_ **Default:** undefined
布局计算时参考的节点位置
一般用于切换数据时保证重新布局的连续性。在 G6 中,若是更新数据,则将自动使用已存在的布局结果数据作为输入
### radial
> _boolean_
是否基于 dagre 进行辐射布局
### sortByCombo
> _boolean_ **Default:** false
同一层节点是否根据每个节点数据中的 parentId 进行排序,以防止 Combo 重叠
建议在有 Combo 的情况下配置
## 布局适用场景
- **流程图**:适合展示流程图,节点之间的方向和间距会自动处理;
- **依赖关系图**:展示软件包或模块之间的依赖关系;
- **任务调度图**:展示任务之间的依赖关系和执行顺序。
## 相关文档
> 以下文档可以帮助你更好地理解 Dagre 布局
- [图布局算法|详解 Dagre 布局](https://mp.weixin.qq.com/s/EdyTfFUH7fyMefNSBXI2nA)
- [深入解读Dagre布局算法](https://www.yuque.com/antv/g6-blog/xxp5nl)
Layout Skill
packages/site/docs/manual/layout/BaseLayout.en.md anthropic-skill ~1,292 tokens---
title: Common Layout Configuration Options
order: 1
---
This article introduces the common attribute configurations for built-in layouts.
## General Configuration
| Property | Description | Type | Default | Required |
| ---------------------- | --------------------------------------------------------------------------------------- | ----------------------------------------------------- | ---------- | -------- |
| type | Layout type, name of built-in or custom layout | [Type](#Type) | - | ✓ |
| isLayoutInvisibleNodes | Whether invisible nodes participate in the layout (takes effect when preLayout is true) | boolean | false | |
| nodeFilter | Nodes participating in the layout | (node: NodeData) => boolean | () => true | |
| comboFilter | Combos participating in the layout | (combo: ComboData) => boolean | () => true | |
| preLayout | Use pre-layout, calculate layout before initializing elements | boolean | false | |
| enableWorker | Whether to run the layout in a WebWorker | boolean | - | |
| iterations | Number of iterations for iterative layout | number | - | |
| animation | Whether to enable layout animation | boolean | false | |
| width | Width of the layout area, defaults to the current container width | number | - | |
| height | Height of the layout area, defaults to the current container height | number | - | |
| center | Layout center point | [number, number] \| [number, number, number] | - | |
| node | Node field mapping, used to map business fields to layout fields | (datum) => ({ id?, x?, y?, z?, parentId?, isCombo? }) | - | |
| edge | Edge field mapping, used to map business fields to layout fields | (datum) => ({ id?, source?, target? }) | - | |
Additional notes:
- `width` / `height` / `center` are common layout fields uniformly supported by `@antvis/layout`.
- `node` / `edge` are used to adapt non-standard business fields such as custom `id` / `source` / `target`.
- `iterations` is the step count used by the G6 runtime to drive iterative layouts, and is not the same as some layouts' internal algorithm parameters.
### Type
Specifies the layout type, either the name of a built-in layout type or a custom layout.
```js {4}
const graph = new Graph({
// Other configurations...
layout: {
type: 'antv-dagre',
},
});
```
Optional values include:
- `antv-dagre`: [Custom layout based on dagre](/en/manual/layout/antv-dagre-layout)
- `circular`: [Circular layout](/en/manual/layout/circular-layout)
- `combo-combined`: [Layout suitable for combinations](/en/manual/layout/combo-combined-layout)
- `concentric`: [Concentric layout](/en/manual/layout/concentric-layout)
- `d3-force`: [Force-directed layout based on D3](/en/manual/layout/d3-force-layout)
- `d3-force-3d`: [3D Force-directed layout](/en/manual/layout/d3-force3-d-layout)
- `dagre`: [Dagre layout](/en/manual/layout/dagre-layout)
- `fishbone`: [Fishbone layout](/en/manual/layout/fishbone)
- `force`: [Force-directed layout](/en/manual/layout/force-layout)
- `force-atlas2`: [ForceAtlas2 layout](/en/manual/layout/force-atlas2-layout)
- `fruchterman`: [Fruchterman layout](/en/manual/layout/fruchterman-layout)
- `grid`: [Grid layout](/en/manual/layout/grid-layout)
- `mds`: [MDS layout for high-dimensional data](/en/manual/layout/mds-layout)
- `radial`: [Radial layout](/en/manual/layout/radial-layout)
- `random`: [Random layout](/en/manual/layout/random-layout)
- `snake`: [Snake layout](/en/manual/layout/snake)
- `compact-box`: [Compact box tree layout](/en/manual/layout/compact-box-layout)
- `dendrogram`: [Dendrogram layout](/en/manual/layout/dendrogram-layout)
- `mindmap`: [Mindmap layout](/en/manual/layout/mindmap-layout)
- `indented`: [Indented tree layout](/en/manual/layout/indented-layout)
Layout Skill
packages/site/docs/manual/layout/BaseLayout.zh.md anthropic-skill ~918 tokens---
title: 布局通用配置项
order: 1
---
本文介绍内置布局通用属性配置。
## 通用配置
| 属性 | 描述 | 类型 | 默认值 | 必选 |
| ---------------------- | ----------------------------------------------------- | ----------------------------------------------------- | ---------- | ---- |
| type | 布局类型,内置布局或自定义布局的名称 | [Type](#Type) | - | ✓ |
| isLayoutInvisibleNodes | 不可见节点是否参与布局(当 preLayout 为 true 时生效) | boolean | false | |
| nodeFilter | 参与该布局的节点 | (node: NodeData) => boolean | () => true | |
| comboFilter | 参与该布局的combo元素 | (combo: ComboData) => boolean | () => true | |
| preLayout | 使用前布局,在初始化元素前计算布局 | boolean | false | |
| enableWorker | 是否在 WebWorker 中运行布局 | boolean | - | |
| iterations | 迭代布局的迭代次数 | number | - | |
| animation | 是否启用布局动画 | boolean | false | |
| width | 布局区域宽度,默认使用当前容器宽度 | number | - | |
| height | 布局区域高度,默认使用当前容器高度 | number | - | |
| center | 布局中心点 | [number, number] \| [number, number, number] | - | |
| node | 节点字段映射,用于把业务字段映射为布局字段 | (datum) => ({ id?, x?, y?, z?, parentId?, isCombo? }) | - | |
| edge | 边字段映射,用于把业务字段映射为布局字段 | (datum) => ({ id?, source?, target? }) | - | |
补充说明:
- `width` / `height` / `center` 是 `@antvis/layout` 统一支持的通用布局字段。
- `node` / `edge` 用于适配非标准 `id/source/target` 业务数据。
- `iterations` 是 G6 运行时用于驱动迭代布局的步数,不等同于某些布局内部自己的算法参数。
### Type
指定布局类型,内置布局类型名称或自定义布局的名称。
```js {4}
const graph = new Graph({
// 其他配置...
layout: {
type: 'antv-dagre',
},
});
```
可选值有:
- `antv-dagre`:[基于 dagre 定制的布局](/manual/layout/antv-dagre-layout)
- `circular`:[环形布局](/manual/layout/circular-layout)
- `combo-combined`:[适用于存在组合的布局](/manual/layout/combo-combined-layout)
- `concentric`:[同心圆布局](/manual/layout/concentric-layout)
- `d3-force`[基于 D3 的力导向布局](/manual/layout/d3-force-layout)
- `d3-force-3d`:[3D力导向布局](/manual/layout/d3-force3-d-layout)
- `dagre`:[dagre 布局](/manual/layout/dagre-layout)
- `fishbone`:[鱼骨布局](/manual/layout/fishbone)
- `force`:[力导向布局](/manual/layout/force-layout)
- `force-atlas2`:[ForceAtlas2 布局](/manual/layout/force-atlas2-layout)
- `fruchterman`:[Fruchterman 布局](/manual/layout/fruchterman-layout)
- `grid`:[网格布局](/manual/layout/grid-layout)
- `mds`:[高维数据降维算法布局](/manual/layout/mds-layout)
- `radial`:[径向布局](/manual/layout/radial-layout)
- `random`:[随机布局](/manual/layout/random-layout)
- `snake`:[蛇形布局](/manual/layout/snake)
- `compact-box`:[紧凑树布局](/manual/layout/compact-box-layout)
- `dendrogram`:[树状布局](/manual/layout/dendrogram-layout)
- `mindmap`:[思维导图布局](/manual/layout/mindmap-layout)
- `indented`:[缩进树布局](/manual/layout/indented-layout)
Layout Skill
packages/site/docs/manual/layout/CircularLayout.en.md anthropic-skill ~1,685 tokens---
title: Circular Layout
order: 3
---
## Overview
Circular layout arranges nodes evenly or at intervals on a circle, and also supports spiral layouts by configuring different startRadius and endRadius. See more circular layout [examples](en/examples#layout-circular) or [source code](https://github.com/antvis/layout/blob/v5/packages/layout/src/circular.ts).
## Usage Scenarios
**Circular layout**:
- Suitable for networks with equal relationships and no hierarchical structure
**Spiral layout**:
- Suitable for implicit hierarchies or time series graphs (such as organizational charts, propagation networks)
## Basic Usage
Other settings use the default configuration (layout width and height default to the entire canvas container)
```js
const graph = new Graph({
// other configurations
layout: {
type: 'circular',
},
});
```
## Options
| Property | Description | Type | Default | Required |
| ----------- | ----------------------------------------------------------------------------------------------------------------- | --------------------------------------------- | ----------------------------------------- | -------- |
| type | Layout type | circular | - | ✓ |
| angleRatio | How many 2\*PI between the first and last node | number | 1 | |
| center | Center of the layout | [number, number]\|[number, number, number] | [`layout width` / 2, `layout height` / 2] | |
| clockwise | Whether to arrange clockwise | boolean | true | |
| divisions | Number of segments on the ring (segments will be evenly distributed, effective when endRadius - startRadius != 0) | number | 1 | |
| nodeSize | Node size (diameter), used for collision detection | Size \| ((nodeData: Node) => Size) | 10 | |
| nodeSpacing | Minimum spacing between rings, used to adjust radius | number \| ((nodeData: Node) => number) | 10 | |
| ordering | Node ordering on the ring, [see details](#ordering) | `topology` \| `topology-directed` \| `degree` | - | |
| radius | Circle radius, if set, spiral layout configs `startRadius` and `endRadius` are ignored, [see details](#radius) | number | - | |
| startAngle | Start angle of the layout | number | 0 | |
| endAngle | End angle of the layout | number | 2 \* Math.PI | |
| startRadius | Start radius for spiral layout, [usage](#spiral-layout) | number | - | |
| endRadius | End radius for spiral layout | number | - | |
| width | Layout width | number | canvas width | |
| height | Layout height | number | canvas height | |
### ordering
Node ordering on the ring
- `topology`: topological order
- `topology-directed`: topological order (directed graph)
- `degree`: order by degree
If not set (`null`), the order in the array is used directly
### radius
If radius, startRadius, and endRadius are not set, the default is `Math.min(layout width, layout height) / 2`, i.e., fills the entire layout area
## Code Examples
### Basic Circular Layout
```javascript
const graph = new Graph({
// other configurations
layout: {
type: 'circular',
},
});
```
```js | ob { inject: true }
import { Graph } from '@antv/g6';
fetch('https://assets.antv.antgroup.com/g6/circular.json')
.then((res) => res.json())
.then((data) => {
const graph = new Graph({
container: 'container',
autoFit: 'view',
data,
node: {
style: {
labelText: (d) => d.id,
labelFill: '#fff',
labelPlacement: 'center',
},
},
layout: {
type: 'circular',
},
behaviors: ['drag-canvas', 'drag-element'],
});
graph.render();
});
```
### Spiral Layout
```javascript
const graph = new Graph({
// other configurations
layout: {
type: 'circular',
startRadius: 10,
endRadius: 300,
},
});
```
```js | ob { inject: true }
import { Graph } from '@antv/g6';
fetch('https://assets.antv.antgroup.com/g6/circular.json')
.then((res) => res.json())
.then((data) => {
const graph = new Graph({
container: 'container',
autoFit: 'center',
data,
node: {
style: {
labelText: (d) => d.id,
labelFill: '#fff',
labelPlacement: 'center',
},
},
layout: {
type: 'circular',
startRadius: 10,
endRadius: 300,
},
behaviors: ['drag-canvas', 'drag-element'],
});
graph.render();
});
```
Layout Skill
packages/site/docs/manual/layout/CircularLayout.zh.md anthropic-skill ~1,291 tokens---
title: 环形布局 Circular
order: 3
---
## 概述
环形布局是一种把节点均匀或者按间隔放置在圆上的布局,也支持通过配置 startRadius 和 endRadius 为不一样的值实现螺旋状布局。参考更多环形布局[样例](/examples#layout-circular)或[源码](https://github.com/antvis/layout/blob/v5/packages/layout/src/circular.ts)。
## 使用场景
**环形布局**:
- 适用于平等关系网络、无层级结构的图
**螺旋状布局**:
- 适用于隐式层级或时间序列图(如组织架构、传播网络)
## 基本用法
其余均使用默认配置(布局宽高默认是整个画布容器)
```js
const graph = new Graph({
// 其他配置
layout: {
type: 'circular',
},
});
```
## 配置项
| 属性 | 描述 | 类型 | 默认值 | 必选 |
| ----------- | ----------------------------------------------------------------------------------- | --------------------------------------------- | -------------------------------- | ---- |
| type | 布局类型 | circular | - | ✓ |
| angleRatio | 从第一个节点到最后节点之间相隔多少个 2\*PI | number | 1 | |
| center | 布局的中心 | [number, number]\|[number, number, number] | [`布局宽度` / 2, `布局高度` / 2] | |
| clockwise | 是否顺时针排列 | boolean | true | |
| divisions | 节点在环上的分段数(几个段将均匀分布,在 endRadius - startRadius != 0 时生效) | number | 1 | |
| nodeSize | 节点大小(直径)。用于防止节点重叠时的碰撞检测 | Size \| ((nodeData: Node) => Size) | 10 | |
| nodeSpacing | 环与环之间最小间距,用于调整半径 | number \| ((nodeData: Node) => number) | 10 | |
| ordering | 节点在环上排序的依据,[说明](#ordering) | `topology` \| `topology-directed` \| `degree` | - | |
| radius | 圆的半径,设置了则螺旋状布局的配置`startRadius`、`endRadius`不生效,[说明](#radius) | number | - | |
| startAngle | 布局的开始角度 | number | 0 | |
| endAngle | 布局的结束角度 | number | 2 \* Math.PI | |
| startRadius | 螺旋状布局的开始半径,[用法](#螺旋状布局) | number | - | |
| endRadius | 螺旋状布局的结束半径 | number | - | |
| width | 布局的宽度 | number | 画布宽度 | |
| height | 布局的高度 | number | 画布高度 | |
### ordering
节点在环上排序的依据
- `topology`: 按照拓扑排序
- `topology-directed`: 按照拓扑排序(有向图)
- `degree`: 按照度数大小排序
不配置(`null`)则直接使用数组中的顺序
### radius
如果radius、startRadius、endRadius都没配置,则默认为最终计算出来的`Math.min(布局宽度, 布局高度) / 2`,即布满整个布局区域
## 代码示例
### 基础环形布局
```javascript
const graph = new Graph({
// 其他配置
layout: {
type: 'circular',
},
});
```
```js | ob { inject: true }
import { Graph } from '@antv/g6';
fetch('https://assets.antv.antgroup.com/g6/circular.json')
.then((res) => res.json())
.then((data) => {
const graph = new Graph({
container: 'container',
autoFit: 'view',
data,
node: {
style: {
labelText: (d) => d.id,
labelFill: '#fff',
labelPlacement: 'center',
},
},
layout: {
type: 'circular',
},
behaviors: ['drag-canvas', 'drag-element'],
});
graph.render();
});
```
### 螺旋状布局
```javascript
const graph = new Graph({
// 其他配置
layout: {
type: 'circular',
startRadius: 10,
endRadius: 300,
},
});
```
```js | ob { inject: true }
import { Graph } from '@antv/g6';
fetch('https://assets.antv.antgroup.com/g6/circular.json')
.then((res) => res.json())
.then((data) => {
const graph = new Graph({
container: 'container',
autoFit: 'center',
data,
node: {
style: {
labelText: (d) => d.id,
labelFill: '#fff',
labelPlacement: 'center',
},
},
layout: {
type: 'circular',
startRadius: 10,
endRadius: 300,
},
behaviors: ['drag-canvas', 'drag-element'],
});
graph.render();
});
```
Layout Skill
packages/site/docs/manual/layout/ComboCombinedLayout.en.md anthropic-skill ~1,247 tokens---
title: ComboCombined Layout
order: 4
---
## Overview
ComboCombined composite layout is suitable for graph data with composite group structures. It supports flexible configuration of the layout for elements inside combos as well as the layout between the outermost combos and nodes. By default, the internal elements use the Concentric layout, and the outer layout uses the gForce force-directed layout, balancing layout effect and overall stability. See more ComboCombined layout [examples](/en/examples#layout-combo-layout) and [source code](https://github.com/antvis/layout/blob/v5/packages/layout/src/combo-combined.ts).
## Usage Scenarios
- User profile analysis: Analyze user behavior and product relationships, use user interest circles as combos, display specific products and behavior tags as internal nodes, and help operators identify user consumption paths.
- Supply chain management graph: Divide suppliers, manufacturers, warehouses, and distributors into combos by role or region, display resources, personnel, or equipment as internal nodes, and clearly show the internal structure of each link in the supply chain.
## Options
| Property | Description | Type | Default | Required |
| ------------ | -------------------------------------------------------------------------------------------------------------------------------------------------- | ------------------------------------------------------------------------------------------ | ------------ | -------- |
| type | Layout type | `combo-combined` | - | ✓ |
| center | Layout center | [`PointTuple`](https://github.com/antvis/layout/blob/v5/packages/layout/src/types.ts#L829) | Graph center | |
| layout | Layout configuration. Can be fixed, or returned dynamically based on `comboId` | `string` \| `object` \| `(comboId?: string) => string \| object` | - | |
| nodeSize | Node size (diameter), used for collision detection | `number` \| `number[]` \| (d?: [NodeData](/en/manual/data#节点数据nodedata)) => number | - | |
| nodeSpacing | Spacing between nodes | `number` \| (d?: [NodeData](/en/manual/data#节点数据nodedata)) => number | - | |
| comboSpacing | Spacing between combos | `number` \| (d?: unknown) => number | - | |
| comboPadding | Padding value inside the combo, used only for force calculation, not for rendering. It is recommended to set the same value as the visual padding. | `((d?: unknown) => number)` \| `number` \| `number[]` \| `undefined` | - | |
### layout
> _`string | object | (comboId?: string) => string | object`_
In `5.1`, it is recommended to use a single `layout` field to choose layouts for different levels, instead of configuring `innerLayout` and `outerLayout` separately.
**Example**:
```ts
new Graph({
layout: {
type: 'combo-combined',
layout: (comboId) => (comboId ? { type: 'grid' } : { type: 'force' }),
},
});
```
## Example Code
```js | ob { inject: true }
import { Graph } from '@antv/g6';
fetch('https://assets.antv.antgroup.com/g6/combo.json')
.then((res) => res.json())
.then((data) => {
const graph = new Graph({
container: 'container',
data,
layout: {
type: 'combo-combined',
comboPadding: 2,
},
node: {
style: {
size: 20,
labelText: (d) => d.id,
},
palette: {
type: 'group',
field: (d) => d.combo,
},
},
edge: {
style: (model) => {
const { size, color } = model.data;
return {
stroke: color || '#99ADD1',
lineWidth: size || 1,
};
},
},
behaviors: ['drag-element', 'drag-canvas', 'zoom-canvas'],
autoFit: 'view',
});
graph.render();
});
```
Layout Skill
packages/site/docs/manual/layout/ComboCombinedLayout.zh.md anthropic-skill ~902 tokens---
title: 复合布局 ComboCombined
order: 4
---
## 概述
ComboCombined 复合布局适用于复合分组结构的图数据展示场景,支持灵活配置 Combo 内部元素的布局以及最外层 Combo 和节点之间的布局。 默认情况内部元素采用 Concentric 同心圆布局,外部布局采用 gForce 力导向布局,兼顾布局效果与整体稳定性。参考更多 ComboCombined 复合布局[样例](/examples#layout-combo-layout)和[源码](https://github.com/antvis/layout/blob/v5/packages/layout/src/combo-combined.ts)
## 使用场景
- 用户画像分析: 分析用户行为与商品关系,将用户兴趣圈层作为 Combo,内部节点展示具体商品和行为标签,帮助运营人员识别用户消费路径。
- 供应链管理图:供应商、制造商、仓储、分销商按角色或区域划分 Combo,内部节点展示资源、人员或设备,清晰展示供应链各环节内部结构。
## 配置项
| 属性 | 描述 | 类型 | 默认值 | 必选 |
| ------------ | --------------------------------------------------------------------------------------------------- | ------------------------------------------------------------------------------------------ | ------ | ---- |
| type | 布局类型 | `combo-combined` | - | ✓ |
| center | 布局中心 | [`PointTuple`](https://github.com/antvis/layout/blob/v5/packages/layout/src/types.ts#L829) | 图中心 | |
| layout | 布局配置。可固定指定,也可根据 `comboId` 动态返回 | `string` \| `object` \| `(comboId?: string) => string \| object` | - | |
| nodeSize | 节点大小(直径)。用于碰撞检测 | `number` \| `number[]` \| (d?: [NodeData](/manual/data#节点数据nodedata)) => number | - | |
| nodeSpacing | 节点间距 | `number` \| (d?: [NodeData](/manual/data#节点数据nodedata)) => number | - | |
| comboSpacing | Combo 之间的间距 | `number` \| (d?: unknown) => number | - | |
| comboPadding | Combo 内部的 padding 值,不用于渲染,仅用于计算力。推荐设置为与视图上 Combo 内部 padding 值相同的值 | `((d?: unknown) => number)` \| `number` \| `number[]` \| `undefined` | - | |
### layout
> _`string | object | (comboId?: string) => string | object`_
5.1 中推荐使用单个 `layout` 字段为不同层级选择布局,而不是分别配置 `innerLayout` 和 `outerLayout`。
**示例**:
```ts
new Graph({
layout: {
type: 'combo-combined',
layout: (comboId) => (comboId ? { type: 'grid' } : { type: 'force' }),
},
});
```
## 示例代码
```js | ob { inject: true }
import { Graph } from '@antv/g6';
fetch('https://assets.antv.antgroup.com/g6/combo.json')
.then((res) => res.json())
.then((data) => {
const graph = new Graph({
container: 'container',
data,
layout: {
type: 'combo-combined',
comboPadding: 2,
},
node: {
style: {
size: 20,
labelText: (d) => d.id,
},
palette: {
type: 'group',
field: (d) => d.combo,
},
},
edge: {
style: (model) => {
const { size, color } = model.data;
return {
stroke: color || '#99ADD1',
lineWidth: size || 1,
};
},
},
behaviors: ['drag-element', 'drag-canvas', 'zoom-canvas'],
autoFit: 'view',
});
graph.render();
});
```
Layout Skill
packages/site/docs/manual/layout/CompactBoxLayout.en.md anthropic-skill ~1,809 tokens---
title: CompactBox Layout
order: 5
---
## Overview
The CompactBox layout is suitable for visualizing structured tree data. It is evolved from the classic [Reingold–Tilford tidy layout algorithm](http://emr.cs.iit.edu/~reingold/tidier-drawings.pdf), and considers the bounding box of each tree node during layout, effectively maintaining the compactness and hierarchical clarity of the tree structure. See more CompactBox layout [examples](/en/examples#layout-compact-box) and [source code](https://github.com/antvis/hierarchy/blob/master/src/compact-box.js).
<img src='https://gw.alipayobjects.com/mdn/rms_f8c6a0/afts/img/A*z-ESRoHTpvIAAAAAAAAAAABkARQnAQ' width=650 alt='CompactBox Tidy Tree Layout Example'/>
## Usage Scenarios
- Decision trees: The compact tree layout can visually and intuitively display each decision path.
- Knowledge graphs: Show hierarchical relationships and connections between concepts. The compact layout can present complex knowledge networks in limited space.
## Configuration
```js
const graph = new Graph({
layout: {
type: 'compact-box',
direction: 'LR',
getHeight: () => 16,
getWidth: () => 16,
getVGap: () => 16,
getHGap: () => 40,
},
});
```
## Options
| Property | Description | Type | Default | Required |
| --------- | ------------------------------------------------------------------------------------------------------------- | ------------------------------------------------------------ | ------- | -------- |
| type | Layout type | `compact-box` | - | ✓ |
| direction | Layout direction, [options](#direction) | `LR` \| `RL` \| `TB` \| `BT` \| `H` \| `V` | `LR` | |
| getSide | Set whether the node is on the left or right of the root. Only works for `H` direction. [See below](#getside) | (d: { data?: [NodeData](/en/manual/data#节点数据nodedata) }) => string | | |
| getId | Callback for node id | (d?: [NodeData](/en/manual/data#节点数据nodedata)) => string | | |
| getWidth | Callback for node width | (d?: [NodeData](/en/manual/data#节点数据nodedata)) => number | | |
| getHeight | Callback for node height | (d?: [NodeData](/en/manual/data#节点数据nodedata)) => number | | |
| getHGap | Callback for horizontal gap | (d?: [NodeData](/en/manual/data#节点数据nodedata)) => number | | |
| getVGap | Callback for vertical gap | (d?: [NodeData](/en/manual/data#节点数据nodedata)) => number | | |
| radial | Whether to enable radial layout, [see below](#radial) | boolean | false | |
### direction
> `LR` \| `RL` \| `TB` \| `BT` \| `H` \| `V` **Default:** `LR`
Tree layout direction
- `TB`: Root at the top, layout downwards
- `BT`: Root at the bottom, layout upwards
- `LR`: Root at the left, layout to the right
- `RL`: Root at the right, layout to the left
- `H`: Root in the middle, horizontal symmetric layout. You can use `getSide` to specify the left/right logic for each node
- `V`: Root in the middle, vertical symmetric layout
### getSide
> _(d: { data?: [NodeData](/en/manual/data#节点数据nodedata) }) => string_
Set whether the node is on the left or right of the root. Only works for `H` direction. If not set, the algorithm will automatically assign left/right. See [getSide auto logic](https://github.com/antvis/hierarchy/blob/d786901874f59d96c47e2a5dfe17b373eefd72e3/src/layout/separate-root.js#L11).
Example:
```javascript
({ data }) => {
// data is a node
if (data.id === 'test-child-id') return 'right';
return 'left';
};
```
### getId
> _(d?: [NodeData](/en/manual/data#节点数据nodedata)) => string_
Callback for node id
Example:
```javascript
(d) => {
// d is a node
return d.id + '_node';
};
```
### getWidth
> _(d?: [NodeData](/en/manual/data#节点数据nodedata)) => number_
Callback for node width
Example:
```javascript
(d) => {
// d is a node
if (d.id === 'testId') return 50;
return 100;
};
```
### getHeight
> _(d?: [NodeData](/en/manual/data#节点数据nodedata)) => number_
Callback for node height
Example:
```javascript
(d) => {
// d is a node
if (d.id === 'testId') return 50;
return 100;
};
```
### getHGap
> _(d?: [NodeData](/en/manual/data#节点数据nodedata)) => number_
Callback for horizontal gap
Example:
```javascript
(d) => {
// d is a node
if (d.id === 'testId') return 50;
return 100;
};
```
### getVGap
> _(d?: [NodeData](/en/manual/data#节点数据nodedata)) => number_
Callback for vertical gap
Example:
```javascript
(d) => {
// d is a node
if (d.id === 'testId') return 50;
return 100;
};
```
### radial
> _boolean_
Whether to use radial layout. If `radial` is `true`, it is recommended to set `direction` to `'LR'` or `'RL'`.
<img src='https://gw.alipayobjects.com/mdn/rms_f8c6a0/afts/img/A*E0c8TIYRPYoAAAAAAAAAAABkARQnAQ' width=200 alt='img'/>
## Example Code
```js | ob { inject: true }
import { Graph, treeToGraphData } from '@antv/g6';
/**
* If the node is a leaf node
* @param {*} d - node data
* @returns {boolean} - whether the node is a leaf node
*/
function isLeafNode(d) {
return !d.children || d.children.length === 0;
}
fetch('https://gw.alipayobjects.com/os/antvdemo/assets/data/algorithm-category.json')
.then((res) => res.json())
.then((data) => {
const graph = new Graph({
container: 'container',
autoFit: 'view',
data: treeToGraphData(data),
behaviors: ['drag-canvas', 'zoom-canvas', 'drag-element', 'collapse-expand'],
node: {
style: {
labelText: (d) => d.id,
labelPlacement: (d) => (isLeafNode(d) ? 'right' : 'left'),
labelBackground: true,
ports: [{ placement: 'right' }, { placement: 'left' }],
},
animation: {
enter: false,
},
},
edge: {
type: 'cubic-horizontal',
animation: {
enter: false,
},
},
layout: {
type: 'compact-box',
direction: 'LR',
getHeight: function getHeight() {
return 32;
},
getWidth: function getWidth() {
return 32;
},
getVGap: function getVGap() {
return 10;
},
getHGap: function getHGap() {
return 100;
},
},
});
graph.render();
});
```
Layout Skill
packages/site/docs/manual/layout/CompactBoxLayout.zh.md anthropic-skill ~1,680 tokens---
title: 紧凑树布局 CompactBox
order: 5
---
## 概述
紧凑树布局适用于结构化树形数据的展示,基于经典的 [Reingold–Tilford tidy 布局算法](http://emr.cs.iit.edu/~reingold/tidier-drawings.pdf) 演进而来,通过布局时综合考虑每个树节点的包围盒,有效保持树结构的紧凑性与层次清晰。参考更多 CompactBox 布局[样例](/examples#layout-compact-box)和[源码](https://github.com/antvis/hierarchy/blob/master/src/compact-box.js)
<img src='https://gw.alipayobjects.com/mdn/rms_f8c6a0/afts/img/A*z-ESRoHTpvIAAAAAAAAAAABkARQnAQ' width=650 alt='CompactBox 紧凑树布局示例'/>
## 使用场景
- 决策树: 通过紧凑树布局可简单直观的图形化展示每个决策路径
- 知识图谱: 展示概念之间的层级关系和连接,紧凑布局可以在有限空间内呈现复杂的知识网络
## 配置方式
```js
const graph = new Graph({
layout: {
type: 'compact-box',
direction: 'LR',
getHeight: () => 16,
getWidth: () => 16,
getVGap: () => 16,
getHGap: () => 40,
},
});
```
## 配置项
| 属性 | 描述 | 类型 | 默认值 | 必选 |
| --------- | ------------------------------------------------------------------------------------------------------- | --------------------------------------------------------- | ------ | ---- |
| type | 布局类型 | `compact-box` | - | ✓ |
| direction | 布局方向,[可选值](#direction) | `LR` \| `RL` \| `TB` \| `BT` \| `H` \| `V` | `LR` | |
| getSide | 设置节点排布在根节点的左侧/右侧,如未设置,则算法自动分配左侧/右侧。注意:该参数仅在 `H` 布局方向上生效 | (d: { data?: [NodeData](/manual/data#节点数据nodedata) }) => string | | |
| getId | 节点 id 的回调函数 | (d?: [NodeData](/manual/data#节点数据nodedata)) => string | | |
| getWidth | 计算每个节点的宽度 | (d?: [NodeData](/manual/data#节点数据nodedata)) => number | | |
| getHeight | 计算每个节点的高度 | (d?: [NodeData](/manual/data#节点数据nodedata)) => number | | |
| getHGap | 计算每个节点的水平间隙 | (d?: [NodeData](/manual/data#节点数据nodedata)) => number | | |
| getVGap | 计算每个节点的垂直间隙 | (d?: [NodeData](/manual/data#节点数据nodedata)) => number | | |
| radial | 是否启用辐射状布局,[说明](#radial) | boolean | false | |
### direction
> `LR` \| `RL` \| `TB` \| `BT` \| `H` \| `V` **Default:** `LR`
树布局方向
- `TB`:根节点在上,往下布局
<img src='https://gw.alipayobjects.com/mdn/rms_f8c6a0/afts/img/A*KrAqTrFbNjMAAAAAAAAAAABkARQnAQ' width=150 alt='垂直布局'/>
- `BT`:根节点在下,往上布局
<img src='https://gw.alipayobjects.com/mdn/rms_f8c6a0/afts/img/A*vNmOTJ4q0uwAAAAAAAAAAABkARQnAQ' width=150 alt='垂直布局'/>
- `LR`:根节点在左,往右布局
<img src='https://gw.alipayobjects.com/mdn/rms_f8c6a0/afts/img/A*ffD6S74MXw4AAAAAAAAAAABkARQnAQ' width=150 alt='水平布局'/>
- `RL`:根节点在右,往左布局
<img src='https://gw.alipayobjects.com/mdn/rms_f8c6a0/afts/img/A*vTg2SJbtj_sAAAAAAAAAAABkARQnAQ' width=150 alt='水平布局'/>
- `H`:根节点在中间,水平对称布局。可传入 `getSide` 方法指定每个节点的左右分布逻辑
<img src='https://gw.alipayobjects.com/mdn/rms_f8c6a0/afts/img/A*0GsIQISvieYAAAAAAAAAAABkARQnAQ' width=150 alt='水平布局'/>
- `V`:根节点在中间,垂直对称布局
<img src='https://gw.alipayobjects.com/mdn/rms_f8c6a0/afts/img/A*E0c8TIYRPYoAAAAAAAAAAABkARQnAQ' width=150 alt='垂直布局'/>
### getSide
> _(d: { data?: [NodeData](/manual/data#节点数据nodedata) }) => string_
设置节点排布在根节点的左侧/右侧。注意:该参数仅在 `direction` 为 `H` 时生效。如未设置,会默认将子节点前半部分放置在右侧,后半部分放置在左侧,参考 [getSide自动计算逻辑](https://github.com/antvis/hierarchy/blob/d786901874f59d96c47e2a5dfe17b373eefd72e3/src/layout/separate-root.js#L11)。
示例:
```javascript
({ data }) => {
// data 是一个节点
if (data.id === 'test-child-id') return 'right';
return 'left';
};
```
### getId
> _(d?: [NodeData](/manual/data#节点数据nodedata)) => string_
节点 id 的回调函数
示例:
```javascript
(d) => {
// d 是一个节点
return d.id + '_node';
};
```
### getWidth
> _(d?: [NodeData](/manual/data#节点数据nodedata)) => number_
每个节点的宽度
示例:
```javascript
(d) => {
// d 是一个节点
if (d.id === 'testId') return 50;
return 100;
};
```
### getHeight
> _(d?: [NodeData](/manual/data#节点数据nodedata)) => number_
每个节点的高度
示例:
```javascript
(d) => {
// d 是一个节点
if (d.id === 'testId') return 50;
return 100;
};
```
### getHGap
> _(d?: [NodeData](/manual/data#节点数据nodedata)) => number_
每个节点的水平间隙
示例:
```javascript
(d) => {
// d 是一个节点
if (d.id === 'testId') return 50;
return 100;
};
```
### getVGap
> _(d?: [NodeData](/manual/data#节点数据nodedata)) => number_
每个节点的垂直间隙
示例:
```javascript
(d) => {
// d 是一个节点
if (d.id === 'testId') return 50;
return 100;
};
```
### radial
> _boolean_
是否按照辐射状布局。若 `radial` 为 `true`,建议 `direction` 设置为 `'LR'` 或 `'RL'`
<img src='https://gw.alipayobjects.com/mdn/rms_f8c6a0/afts/img/A*E0c8TIYRPYoAAAAAAAAAAABkARQnAQ' width=200 alt='img'/>
## 代码示例
```js | ob { inject: true }
import { Graph, treeToGraphData } from '@antv/g6';
/**
* If the node is a leaf node
* @param {*} d - node data
* @returns {boolean} - whether the node is a leaf node
*/
function isLeafNode(d) {
return !d.children || d.children.length === 0;
}
fetch('https://gw.alipayobjects.com/os/antvdemo/assets/data/algorithm-category.json')
.then((res) => res.json())
.then((data) => {
const graph = new Graph({
container: 'container',
autoFit: 'view',
data: treeToGraphData(data),
behaviors: ['drag-canvas', 'zoom-canvas', 'drag-element', 'collapse-expand'],
node: {
style: {
labelText: (d) => d.id,
labelPlacement: (d) => (isLeafNode(d) ? 'right' : 'left'),
labelBackground: true,
ports: [{ placement: 'right' }, { placement: 'left' }],
},
animation: {
enter: false,
},
},
edge: {
type: 'cubic-horizontal',
animation: {
enter: false,
},
},
layout: {
type: 'compact-box',
direction: 'LR',
getHeight: function getHeight() {
return 32;
},
getWidth: function getWidth() {
return 32;
},
getVGap: function getVGap() {
return 10;
},
getHGap: function getHGap() {
return 100;
},
},
});
graph.render();
});
```
Layout Skill
packages/site/docs/manual/layout/ConcentricLayout.en.md anthropic-skill ~2,131 tokens---
title: Concentric Layout
order: 6
---
## Overview
The concentric layout arranges nodes in layers according to a certain sorting rule, with each layer of nodes placed around a common center. See more concentric layout [examples](/en/examples#layout-concentric) or [source code](https://github.com/antvis/layout/blob/v5/packages/layout/src/circular.ts).
## Usage Scenarios
- Layered data visualization, such as permission structures, organizational charts, etc., with the center as the top-level role and outer rings as lower-level nodes.
- Visualization of ranking analysis results, with high-importance nodes in the center and low-importance nodes on the periphery, quickly expressing the relative influence of nodes in the graph.
## Options
| Property | Description | Type | Default | Required |
| -------------- | --------------------------------------------------------------------------------------------------------------------------------------------------------------------------- | -------------------------------------------------- | --------------------------------------------------------- | -------- | --------- | --- |
| type | Layout type | `concentric` | - | ✓ |
| center | Center position of the circular layout, defaults to the center of the container | [number, number] \| [number, number, number] | - | |
| clockwise | Whether to arrange nodes clockwise | boolean | false | |
| equidistant | Whether the distance between rings is equal | boolean | false | |
| width | Layout width, defaults to container width | number | - | |
| height | Layout height, defaults to container height | number | - | |
| sortBy | The property to sort by (node attribute name). The higher the value, the closer to the center. If set to 'degree', nodes with higher degree are placed closer to the center | string | `degree` | |
| maxLevelDiff | Maximum attribute difference in the same layer. If undefined, set to maxValue / 4, where maxValue is the maximum value of the sorting property | number | undefined | |
| nodeSize | Node size (diameter), used for collision detection | number \| number[] \| ((nodeData: Node) => number) | 30 | |
| nodeSpacing | Minimum spacing between rings, used to adjust the radius | number \| number[] \| ((node?: Node) => number) | 10 | |
| preventOverlap | Whether to prevent overlap. Must be used with nodeSize or data.size. Only works if node size is set in data or in this layout config. | boolean | false | |
| startAngle | The angle (in radians) to start laying out nodes | number | 3 / 2 \* Math.PI | |
| sweep | The angle difference between the first and last node in the same layer. If undefined, it is set to `2 _ Math.PI _ (1 - 1 / | level.nodes | )`, where `level.nodes` is the set of nodes in that layer | number | undefined | |
## Example Code
```js | ob { inject: true }
import { Graph } from '@antv/g6';
const graph = new Graph({
container: 'container',
width: 500,
height: 250,
autoFit: 'view',
data: {
nodes: [
{ id: 'center', data: { label: 'Center', level: 0 } },
{ id: 'level1-0', data: { label: 'L1-0', level: 1 } },
{ id: 'level1-1', data: { label: 'L1-1', level: 1 } },
{ id: 'level1-2', data: { label: 'L1-2', level: 1 } },
{ id: 'level1-3', data: { label: 'L1-3', level: 1 } },
{ id: 'level1-4', data: { label: 'L1-4', level: 1 } },
{ id: 'level1-5', data: { label: 'L1-5', level: 1 } },
{ id: 'level2-0', data: { label: 'L2-0', level: 2 } },
{ id: 'level2-1', data: { label: 'L2-1', level: 2 } },
{ id: 'level2-2', data: { label: 'L2-2', level: 2 } },
{ id: 'level2-3', data: { label: 'L2-3', level: 2 } },
{ id: 'level2-4', data: { label: 'L2-4', level: 2 } },
{ id: 'level2-5', data: { label: 'L2-5', level: 2 } },
{ id: 'level2-6', data: { label: 'L2-6', level: 2 } },
{ id: 'level2-7', data: { label: 'L2-7', level: 2 } },
{ id: 'level2-8', data: { label: 'L2-8', level: 2 } },
{ id: 'level2-9', data: { label: 'L2-9', level: 2 } },
{ id: 'level2-10', data: { label: 'L2-10', level: 2 } },
{ id: 'level2-11', data: { label: 'L2-11', level: 2 } },
],
edges: [
{ id: 'e-center-level1-0', source: 'center', target: 'level1-0' },
{ id: 'e-center-level1-1', source: 'center', target: 'level1-1' },
{ id: 'e-center-level1-2', source: 'center', target: 'level1-2' },
{ id: 'e-center-level1-3', source: 'center', target: 'level1-3' },
{ id: 'e-center-level1-4', source: 'center', target: 'level1-4' },
{ id: 'e-center-level1-5', source: 'center', target: 'level1-5' },
{ id: 'e-level1-0-level2-0', source: 'level1-0', target: 'level2-0' },
{ id: 'e-level1-0-level2-1', source: 'level1-0', target: 'level2-1' },
{ id: 'e-level1-1-level2-2', source: 'level1-1', target: 'level2-2' },
{ id: 'e-level1-1-level2-3', source: 'level1-1', target: 'level2-3' },
{ id: 'e-level1-2-level2-4', source: 'level1-2', target: 'level2-4' },
{ id: 'e-level1-2-level2-5', source: 'level1-2', target: 'level2-5' },
{ id: 'e-level1-3-level2-6', source: 'level1-3', target: 'level2-6' },
{ id: 'e-level1-3-level2-7', source: 'level1-3', target: 'level2-7' },
{ id: 'e-level1-4-level2-8', source: 'level1-4', target: 'level2-8' },
{ id: 'e-level1-4-level2-9', source: 'level1-4', target: 'level2-9' },
{ id: 'e-level1-5-level2-10', source: 'level1-5', target: 'level2-10' },
{ id: 'e-level1-5-level2-11', source: 'level1-5', target: 'level2-11' },
],
},
layout: {
type: 'concentric',
nodeSize: 32,
sortBy: 'degree',
preventOverlap: true,
},
behaviors: ['zoom-canvas', 'drag-canvas', 'drag-element'],
animation: false,
});
graph.render();
```
Layout Skill
packages/site/docs/manual/layout/ConcentricLayout.zh.md anthropic-skill ~2,611 tokens---
title: 同心圆布局 Concentric
order: 6
---
## 概述
同心圆布局是一种将节点根据某种排序规则分层,并以圆心为中心、沿圆周排列每层节点的布局方式。参考更多同心圆布局[样例](/examples#layout-concentric)或[源码](https://github.com/antvis/layout/blob/v5/packages/layout/src/circular.ts)。
## 使用场景
- 分层数据可视化,如权限控制结构、组织架构图等,中心是顶级角色,外圈为下级节点。
- 排序分析结果可视化,高重要度放中心,低重要度放外围,快速表达图中节点的相对影响力。
## 配置项
| 属性 | 描述 | 类型 | 默认值 | 必选 |
| -------------- | ----------------------------------------------------------------------------------------------------------------------------------------------------------------------------------------------------------- | -------------------------------------------------- | ---------------- | ---- |
| type | 布局类型 | `concentric` | - | ✓ |
| center | 圆形布局的中心位置,默认为当前容器的中心位置 | [number, number] \| [number, number, number] | - | |
| clockwise | 是否按照顺时针排列 | boolean | false |
| equidistant | 环与环之间的距离是否相等 | boolean | false | |
| width | 布局的宽度,默认使用容器宽度 | number | - | |
| height | 布局的高度,默认使用容器高度 | number | - | |
| sortBy | 指定排序的依据(节点属性名)<br>数值越高则该节点被放置得越中心。若为 degree,则会计算节点的度数,度数越高,节点将被放置得越中心 | string | `degree` | |
| maxLevelDiff | 同一层节点的最大属性差值<br>若为 undefined,则将会被设置为 maxValue / 4 ,其中 maxValue 为最大的排序依据的属性值。例如,若 sortBy 为 'degree',则 maxValue 为所有节点中度数最大的节点的度数 | number | undefined | |
| nodeSize | 节点大小(直径)。用于防止节点重叠时的碰撞检测 | number \| number[] \| ((nodeData: Node) => number) | 30 | |
| nodeSpacing | 环与环之间最小间距,用于调整半径 | number \| number[] \| ((node?: Node) => number) | 10 | |
| preventOverlap | 是否防止重叠<br>必须配合 nodeSize 属性或节点数据中的 data.size 属性,只有在数据中设置了 data.size 或在该布局中配置了与当前图节点大小相同的 nodeSize 值,才能够进行节点重叠的碰撞检测 | boolean | false | |
| startAngle | 开始布局节点的弧度 | number | 3 / 2 \* Math.PI | |
| sweep | 同一层中第一个节点与最后一个节点之间的弧度差<br>若为 undefined ,则将会被设置为 2 \* Math.PI \* (1 - 1 / \|level.nodes\|) ,其中 level.nodes 为该算法计算出的每一层的节点,\|level.nodes\| 代表该层节点数量 | number | undefined | |
## 代码示例
```js | ob { pin: false, inject: true }
import { Graph } from '@antv/g6';
const graph = new Graph({
container: 'container',
width: 500,
height: 250,
autoFit: 'view',
data: {
nodes: [
{ id: 'center', data: { label: '中心', level: 0 } },
{ id: 'level1-0', data: { label: 'L1-0', level: 1 } },
{ id: 'level1-1', data: { label: 'L1-1', level: 1 } },
{ id: 'level1-2', data: { label: 'L1-2', level: 1 } },
{ id: 'level1-3', data: { label: 'L1-3', level: 1 } },
{ id: 'level1-4', data: { label: 'L1-4', level: 1 } },
{ id: 'level1-5', data: { label: 'L1-5', level: 1 } },
{ id: 'level2-0', data: { label: 'L2-0', level: 2 } },
{ id: 'level2-1', data: { label: 'L2-1', level: 2 } },
{ id: 'level2-2', data: { label: 'L2-2', level: 2 } },
{ id: 'level2-3', data: { label: 'L2-3', level: 2 } },
{ id: 'level2-4', data: { label: 'L2-4', level: 2 } },
{ id: 'level2-5', data: { label: 'L2-5', level: 2 } },
{ id: 'level2-6', data: { label: 'L2-6', level: 2 } },
{ id: 'level2-7', data: { label: 'L2-7', level: 2 } },
{ id: 'level2-8', data: { label: 'L2-8', level: 2 } },
{ id: 'level2-9', data: { label: 'L2-9', level: 2 } },
{ id: 'level2-10', data: { label: 'L2-10', level: 2 } },
{ id: 'level2-11', data: { label: 'L2-11', level: 2 } },
],
edges: [
{ id: 'e-center-level1-0', source: 'center', target: 'level1-0' },
{ id: 'e-center-level1-1', source: 'center', target: 'level1-1' },
{ id: 'e-center-level1-2', source: 'center', target: 'level1-2' },
{ id: 'e-center-level1-3', source: 'center', target: 'level1-3' },
{ id: 'e-center-level1-4', source: 'center', target: 'level1-4' },
{ id: 'e-center-level1-5', source: 'center', target: 'level1-5' },
{ id: 'e-level1-0-level2-0', source: 'level1-0', target: 'level2-0' },
{ id: 'e-level1-0-level2-1', source: 'level1-0', target: 'level2-1' },
{ id: 'e-level1-1-level2-2', source: 'level1-1', target: 'level2-2' },
{ id: 'e-level1-1-level2-3', source: 'level1-1', target: 'level2-3' },
{ id: 'e-level1-2-level2-4', source: 'level1-2', target: 'level2-4' },
{ id: 'e-level1-2-level2-5', source: 'level1-2', target: 'level2-5' },
{ id: 'e-level1-3-level2-6', source: 'level1-3', target: 'level2-6' },
{ id: 'e-level1-3-level2-7', source: 'level1-3', target: 'level2-7' },
{ id: 'e-level1-4-level2-8', source: 'level1-4', target: 'level2-8' },
{ id: 'e-level1-4-level2-9', source: 'level1-4', target: 'level2-9' },
{ id: 'e-level1-5-level2-10', source: 'level1-5', target: 'level2-10' },
{ id: 'e-level1-5-level2-11', source: 'level1-5', target: 'level2-11' },
],
},
layout: {
type: 'concentric',
nodeSize: 32,
sortBy: 'degree',
preventOverlap: true,
},
behaviors: ['zoom-canvas', 'drag-canvas', 'drag-element'],
animation: false,
});
graph.render();
```
<details><summary>展开查看完整代码</summary>
```javascript
import { Graph } from '@antv/g6';
const graph = new Graph({
container: 'container',
autoFit: 'view',
data: {
nodes: [
{ id: 'center', data: { label: '中心', level: 0 } },
{ id: 'level1-0', data: { label: 'L1-0', level: 1 } },
{ id: 'level1-1', data: { label: 'L1-1', level: 1 } },
{ id: 'level1-2', data: { label: 'L1-2', level: 1 } },
{ id: 'level1-3', data: { label: 'L1-3', level: 1 } },
{ id: 'level1-4', data: { label: 'L1-4', level: 1 } },
{ id: 'level1-5', data: { label: 'L1-5', level: 1 } },
{ id: 'level2-0', data: { label: 'L2-0', level: 2 } },
{ id: 'level2-1', data: { label: 'L2-1', level: 2 } },
{ id: 'level2-2', data: { label: 'L2-2', level: 2 } },
{ id: 'level2-3', data: { label: 'L2-3', level: 2 } },
{ id: 'level2-4', data: { label: 'L2-4', level: 2 } },
{ id: 'level2-5', data: { label: 'L2-5', level: 2 } },
{ id: 'level2-6', data: { label: 'L2-6', level: 2 } },
{ id: 'level2-7', data: { label: 'L2-7', level: 2 } },
{ id: 'level2-8', data: { label: 'L2-8', level: 2 } },
{ id: 'level2-9', data: { label: 'L2-9', level: 2 } },
{ id: 'level2-10', data: { label: 'L2-10', level: 2 } },
{ id: 'level2-11', data: { label: 'L2-11', level: 2 } },
],
edges: [
{ id: 'e-center-level1-0', source: 'center', target: 'level1-0' },
{ id: 'e-center-level1-1', source: 'center', target: 'level1-1' },
{ id: 'e-center-level1-2', source: 'center', target: 'level1-2' },
{ id: 'e-center-level1-3', source: 'center', target: 'level1-3' },
{ id: 'e-center-level1-4', source: 'center', target: 'level1-4' },
{ id: 'e-center-level1-5', source: 'center', target: 'level1-5' },
{ id: 'e-level1-0-level2-0', source: 'level1-0', target: 'level2-0' },
{ id: 'e-level1-0-level2-1', source: 'level1-0', target: 'level2-1' },
{ id: 'e-level1-1-level2-2', source: 'level1-1', target: 'level2-2' },
{ id: 'e-level1-1-level2-3', source: 'level1-1', target: 'level2-3' },
{ id: 'e-level1-2-level2-4', source: 'level1-2', target: 'level2-4' },
{ id: 'e-level1-2-level2-5', source: 'level1-2', target: 'level2-5' },
{ id: 'e-level1-3-level2-6', source: 'level1-3', target: 'level2-6' },
{ id: 'e-level1-3-level2-7', source: 'level1-3', target: 'level2-7' },
{ id: 'e-level1-4-level2-8', source: 'level1-4', target: 'level2-8' },
{ id: 'e-level1-4-level2-9', source: 'level1-4', target: 'level2-9' },
{ id: 'e-level1-5-level2-10', source: 'level1-5', target: 'level2-10' },
{ id: 'e-level1-5-level2-11', source: 'level1-5', target: 'level2-11' },
],
},
layout: {
type: 'concentric',
nodeSize: 32,
sortBy: 'degree',
preventOverlap: true,
},
behaviors: ['zoom-canvas', 'drag-canvas', 'drag-element'],
animation: false,
});
graph.render();
```
</details>
Layout Skill
packages/site/docs/manual/layout/custom-layout.en.md anthropic-skill ~1,073 tokens---
title: Custom Layout
order: 22
---
## Overview
In G6, layouts are divided into two types: 'iterative layout' and 'non-iterative layout'. An iterative layout refers to a layout algorithm that iterates multiple times until convergence, while a non-iterative layout refers to a layout algorithm that executes only once.
## Implement Layout
### Non-Iterative Layout
Implementing a non-iterative layout is relatively straightforward; you only need to implement the `execute` method in `BaseLayout`. Below is a simple implementation of a custom layout:
```typescript
import { BaseLayout } from '@antv/g6';
import type { GraphData } from '@antv/g6';
class DiagonalLayout extends BaseLayout {
id = 'diagonal-layout';
async execute(data: GraphData): Promise<GraphData> {
const { nodes = [] } = data;
return {
nodes: nodes.map((node, index) => ({
id: node.id,
style: {
x: 50 * index + 25,
y: 50 * index + 25,
},
})),
};
}
}
```
In the code above, we implemented a simple layout algorithm that arranges nodes along a diagonal line starting from the top-left corner.
<embed src="@/common/manual/custom-extension/layout/non-iterative-layout.md"></embed>
:::info{title=info}
The `execute` method returns a GraphData object, which only needs to contain the basic information of the elements (such as id, source, target) and the properties added by the layout (such as x, y, control points of edges, etc.), and does not need to contain other unnecessary information.
If you only need to layout the nodes, you can return only the node information and do not need to return the edge information.
:::
### Iterative Layout
The implementation of an iterative layout also requires inheriting from `BaseLayout`, but in addition to `execute`, you also need to implement the `tick` and `stop` methods. The `tick` method is used to iterate the layout to a specified number of rounds, and the `stop` method is used to stop the layout iteration.
In addition, in iterative layouts, you need to call `options.onTick` each time the layout iterates to trigger the graph update.
```typescript
type onTick = (data: GraphData) => void;
```
Below is a simple implementation of an iterative layout:
```typescript
import { BaseLayout } from '@antv/g6';
import type { GraphData, BaseLayoutOptions } from '@antv/g6';
interface TickTockLayoutOptions extends BaseLayoutOptions {
onTick: (data: GraphData) => void;
}
class TickTockLayout extends BaseLayout<TickTockLayoutOptions> {
public id = 'custom-layout';
private tickCount = 0;
private data?: GraphData;
private timer?: number;
private resolve?: () => void;
private promise?: Promise<void>;
async execute(data: GraphData, options: TickTockLayoutOptions): Promise<GraphData> {
const { onTick } = { ...this.options, ...options };
this.tickCount = 0;
this.data = data;
this.promise = new Promise((resolve) => {
this.resolve = resolve;
});
this.timer = window.setInterval(() => {
onTick(this.simulateTick());
if (this.tickCount === 10) this.stop();
}, 200);
await this.promise;
return this.simulateTick();
}
simulateTick = () => {
const x = this.tickCount++ % 2 === 0 ? 50 : 150;
return {
nodes: (this?.data?.nodes || []).map((node, index) => ({
id: node.id,
style: { x, y: (index + 1) * 30 },
})),
};
};
tick = () => {
return this.simulateTick();
};
stop = () => {
clearInterval(this.timer);
this.resolve?.();
};
}
```
In this example, we have implemented a simple iterative layout algorithm that toggles the x-coordinate of the nodes between 50 and 150 every 200 milliseconds and arranges them in order along the y-axis according to the sequence of the nodes.
<embed src="@/common/manual/custom-extension/layout/iterative-layout.md"></embed>
## Register Layout
You can register through the `register` method provided by G6. For more details, please refer to [Register Layout](/en/manual/core-concept/layout#register-layout)
## Configure Layout
The type and parameters of the layout can be configured in `options.layout`. For more details, please refer to [Configure Layout](/en/manual/core-concept/layout#configure-layout)
Layout Skill
packages/site/docs/manual/layout/custom-layout.zh.md anthropic-skill ~701 tokens---
title: 自定义布局
order: 22
---
## 概述
G6 中布局分为`迭代布局`和`非迭代布局`两种,迭代布局是指布局算法会迭代多次直到收敛,非迭代布局是指布局算法只执行一次。
## 实现布局
### 非迭代布局
实现一个非迭代布局相对简单,只需要实现 `BaseLayout` 中的 `execute` 方法即可,下面是一个简单的自定义布局实现:
```typescript
import { BaseLayout } from '@antv/g6';
import type { GraphData } from '@antv/g6';
class DiagonalLayout extends BaseLayout {
id = 'diagonal-layout';
async execute(data: GraphData): Promise<GraphData> {
const { nodes = [] } = data;
return {
nodes: nodes.map((node, index) => ({
id: node.id,
style: {
x: 50 * index + 25,
y: 50 * index + 25,
},
})),
};
}
}
```
在上面的代码中,我们实现了一个简单的布局算法,将节点从左上角沿对角线排列。
<embed src="@/common/manual/custom-extension/layout/non-iterative-layout.md"></embed>
:::info{title=提示}
`execute` 方法返回的是一个 GraphData 对象,里面仅需要包含元素的基本信息(如 id、source、target)以及布局新增的属性(如 x、y、边的控制点等),不需要包含其他无用的信息。
如果仅需要对节点进行布局,可以只返回节点信息,不需要返回边的信息。
:::
### 迭代布局
迭代布局的实现同样需要继承 `BaseLayout`,但是除 `execute` 外还需要实现 `tick` 和 `stop` 方法,`tick` 方法用于将布局迭代到指定轮次,`stop` 方法用于停止布局迭代。
此外,迭代布局中需要在每次迭代调用 `options.onTick` 以触发图的更新。
```typescript
type onTick = (data: GraphData) => void;
```
下面是一个简单的迭代布局实现:
```typescript
import { BaseLayout } from '@antv/g6';
import type { GraphData, BaseLayoutOptions } from '@antv/g6';
interface TickTockLayoutOptions extends BaseLayoutOptions {
onTick: (data: GraphData) => void;
}
class TickTockLayout extends BaseLayout<TickTockLayoutOptions> {
public id = 'custom-layout';
private tickCount = 0;
private data?: GraphData;
private timer?: number;
private resolve?: () => void;
private promise?: Promise<void>;
async execute(data: GraphData, options: TickTockLayoutOptions): Promise<GraphData> {
const { onTick } = { ...this.options, ...options };
this.tickCount = 0;
this.data = data;
this.promise = new Promise((resolve) => {
this.resolve = resolve;
});
this.timer = window.setInterval(() => {
onTick(this.simulateTick());
if (this.tickCount === 10) this.stop();
}, 200);
await this.promise;
return this.simulateTick();
}
simulateTick = () => {
const x = this.tickCount++ % 2 === 0 ? 50 : 150;
return {
nodes: (this?.data?.nodes || []).map((node, index) => ({
id: node.id,
style: { x, y: (index + 1) * 30 },
})),
};
};
tick = () => {
return this.simulateTick();
};
stop = () => {
clearInterval(this.timer);
this.resolve?.();
};
}
```
在这个例子中,我们实现了一个简单的迭代布局算法,每 200ms 将节点的 x 坐标在 50 和 150 之间切换,并按照节点顺序在 y 方向上排列。
<embed src="@/common/manual/custom-extension/layout/iterative-layout.md"></embed>
## 注册布局
通过 G6 提供的 register 方法注册即可,详见[注册布局](/manual/layout/overview#注册布局)
## 配置布局
可在 `options.layout` 中配置布局的类型和参数,详见[配置布局](/manual/layout/overview#配置布局)
Layout Skill
packages/site/docs/manual/layout/D3Force3DLayout.en.md anthropic-skill ~2,211 tokens---
title: 3D Force-Directed Layout
order: 7
---
## Overview
The D3Force3D layout is a 3D extension based on [d3-force](https://d3js.org/d3-force), which simulates physical forces in three-dimensional space to achieve automatic layout. Compared to 2D layouts, it adds force effects in the Z-axis direction, allowing richer data relationships to be displayed in 3D space.
<img width="300" src="https://mdn.alipayobjects.com/huamei_qa8qxu/afts/img/A*4mbSTJLOXkgAAAAAAAAAAAAADmJ7AQ/original" alt="3D Force-Directed Layout Illustration" />
## Core Concepts
### Force System
D3Force3D extends the traditional 2D force-directed layout with the following forces:
- **3D Centering Force**: Pulls nodes toward the center point in 3D space
- **3D Collision Force**: Prevents node overlap in 3D space
- **3D Radial Force**: Attracts nodes to a sphere in 3D space
- **3D Axis Forces**: Applies forces along the X, Y, and Z axes
### Iteration System
The layout is computed through iterations, mainly involving the following parameters:
- **alpha**: The current energy value of the iteration, controlling node movement speed
- **alphaDecay**: The decay rate of the energy value
- **alphaMin**: The minimum energy value; iteration stops below this value
- **velocityDecay**: The velocity decay factor
## Options
| Property | Description | Type | Default | Required |
| --------------- | ---------------------------------------------------------------- | -------------------------------------------------------------------------- | ------------- | -------- |
| type | Layout type | string | `d3-force-3d` | ✓ |
| nodeSize | Node size (diameter), used for collision detection | number \| ((node: NodeDatum, index: number, nodes: NodeDatum[]) => number) | - | |
| iterations | Number of force iterations; higher means more precise but slower | number | - | |
| numDimensions | Number of dimensions (2 or 3) | number | 3 | |
| forceSimulation | Custom force simulation method | Simulation<NodeDatum, EdgeDatum> | - | |
| onTick | Callback for each iteration | (data: LayoutMapping) => void | - | |
| randomSource | Random number generator | () => number | - | |
### Iteration Control
| Property | Description | Type | Default | Required |
| ------------- | ----------------------------- | ------ | ------- | -------- |
| alpha | Current convergence threshold | number | 1 | |
| alphaDecay | Convergence decay rate (0-1) | number | 0.028 | |
| alphaMin | Stop iteration threshold | number | 0.001 | |
| alphaTarget | Target convergence threshold | number | 0 | |
| velocityDecay | Velocity decay factor | number | 0.4 | |
### Force Model Options
#### Centering Force (center)
| Property | Description | Type | Default | Required |
| --------------- | ------------------- | ------ | ------- | -------- |
| center.x | Center x coordinate | number | 0 | |
| center.y | Center y coordinate | number | 0 | |
| center.z | Center z coordinate | number | 0 | |
| center.strength | Force strength | number | 1 | |
#### Collision Force (collide)
| Property | Description | Type | Default | Required |
| ------------------ | -------------------- | -------------------------------------------------------------------------- | ------- | -------- |
| collide.radius | Collision radius | number \| ((node: NodeDatum, index: number, nodes: NodeDatum[]) => number) | 10 | |
| collide.strength | Force strength | number | 1 | |
| collide.iterations | Collision iterations | number | 1 | |
#### Link Force (link)
| Property | Description | Type | Default | Required |
| --------------- | --------------------- | -------------------------------------------------------------------------- | ------- | -------- |
| link.id | Edge id generator | (edge: EdgeDatum, index: number, edges: EdgeDatum[]) => string | edge.id | |
| link.distance | Ideal edge length | number \| ((edge: EdgeDatum, index: number, edges: EdgeDatum[]) => number) | 30 | |
| link.strength | Force strength | number \| ((edge: EdgeDatum, index: number, edges: EdgeDatum[]) => number) | 1 | |
| link.iterations | Link force iterations | number | 1 | |
#### Many-Body Force (manyBody)
| Property | Description | Type | Default | Required |
| -------------------- | ---------------------------- | -------------------------------------------------------------------------- | -------- | -------- |
| manyBody.strength | Force strength | number \| ((node: NodeDatum, index: number, nodes: NodeDatum[]) => number) | -30 | |
| manyBody.theta | Barnes-Hut accuracy | number | 0.9 | |
| manyBody.distanceMin | Minimum interaction distance | number | 1 | |
| manyBody.distanceMax | Maximum interaction distance | number | Infinity | |
#### Radial Force (radial)
| Property | Description | Type | Default | Required |
| --------------- | --------------- | -------------------------------------------------------------------------- | ------- | -------- |
| radial.strength | Force strength | number \| ((node: NodeDatum, index: number, nodes: NodeDatum[]) => number) | 0.1 | |
| radial.radius | Target radius | number \| ((node: NodeDatum, index: number, nodes: NodeDatum[]) => number) | 100 | |
| radial.x | Sphere center x | number | 0 | |
| radial.y | Sphere center y | number | 0 | |
| radial.z | Sphere center z | number | 0 | |
#### Axis Forces (x, y, z)
Each axis can be configured separately:
| Property | Description | Type | Default | Required |
| ---------- | --------------------- | -------------------------------------------------------------------------- | ------- | -------- |
| x.strength | X-axis force strength | number \| ((node: NodeDatum, index: number, nodes: NodeDatum[]) => number) | - | |
| x.x | Target x coordinate | number \| ((node: NodeDatum, index: number, nodes: NodeDatum[]) => number) | - | |
| y.strength | Y-axis force strength | number \| ((node: NodeDatum, index: number, nodes: NodeDatum[]) => number) | - | |
| y.y | Target y coordinate | number \| ((node: NodeDatum, index: number, nodes: NodeDatum[]) => number) | - | |
| z.strength | Z-axis force strength | number \| ((node: NodeDatum, index: number, nodes: NodeDatum[]) => number) | - | |
| z.z | Target z coordinate | number \| ((node: NodeDatum, index: number, nodes: NodeDatum[]) => number) | - | |
Layout Skill
packages/site/docs/manual/layout/D3Force3DLayout.zh.md anthropic-skill ~1,768 tokens---
title: 3D D3力导向布局 D3Force3D
order: 7
---
## 概述
D3Force3D 布局是基于 [d3-force](https://d3js.org/d3-force) 的三维扩展版本,通过在三维空间中模拟物理力的作用来实现自动布局。相比二维布局,它增加了 Z 轴方向的力作用,能够在三维空间中展现更丰富的数据关系。
<img width="300" src="https://mdn.alipayobjects.com/huamei_qa8qxu/afts/img/A*4mbSTJLOXkgAAAAAAAAAAAAADmJ7AQ/original" alt="3D 力导向布局示意图" />
## 核心概念
### 力系统
D3Force3D 在传统二维力导向布局的基础上,扩展了以下力的作用:
- **三维中心力**:将节点拉向三维空间的中心点
- **三维碰撞力**:在三维空间中防止节点重叠
- **三维径向力**:将节点吸引到三维空间中的球面上
- **三维坐标力**:分别在 X、Y、Z 三个方向上施加作用力
### 迭代系统
布局计算通过迭代来实现,主要涉及以下参数:
- **alpha**:当前迭代的活力值,控制节点移动速度
- **alphaDecay**:活力值的衰减率
- **alphaMin**:最小活力值,低于此值停止迭代
- **velocityDecay**:速度衰减因子
## 配置项
| 属性 | 描述 | 类型 | 默认值 | 必选 |
| --------------- | -------------------------------------------- | -------------------------------------------------------------------------- | ------------- | ---- |
| type | 布局类型 | string | `d3-force-3d` | ✓ |
| nodeSize | 节点大小(直径),用于碰撞检测防止节点重叠 | number \| ((node: NodeDatum, index: number, nodes: NodeDatum[]) => number) | 10 | |
| iterations | 力的迭代次数,值越大布局越精确但性能消耗越大 | number | - | |
| numDimensions | 维度数量,固定为 3 | number | 3 | |
| forceSimulation | 自定义力模拟方法 | Simulation<NodeDatum, EdgeDatum> | - | |
| onTick | 每次迭代的回调函数 | (data: LayoutMapping) => void | - | |
| randomSource | 随机数生成函数 | () => number | - | |
### 迭代控制
| 属性 | 描述 | 类型 | 默认值 | 必选 |
| ------------- | --------------------- | ------ | ------ | ---- |
| alpha | 当前迭代收敛阈值 | number | 1 | |
| alphaDecay | 收敛阈值衰减率(0-1) | number | 0.028 | |
| alphaMin | 停止迭代的阈值 | number | 0.001 | |
| alphaTarget | 目标收敛阈值 | number | 0 | |
| velocityDecay | 速度衰减因子 | number | 0.4 | |
### 力模型配置
#### 中心力(center)
| 属性 | 描述 | 类型 | 默认值 | 必选 |
| --------------- | ------------- | ------ | ------ | ---- |
| center.x | 中心点 x 坐标 | number | 0 | |
| center.y | 中心点 y 坐标 | number | 0 | |
| center.z | 中心点 z 坐标 | number | 0 | |
| center.strength | 力的强度 | number | 1 | |
#### 碰撞力(collide)
| 属性 | 描述 | 类型 | 默认值 | 必选 |
| ------------------ | ------------------ | -------------------------------------------------------------------------- | ------ | ---- |
| collide.radius | 碰撞半径 | number \| ((node: NodeDatum, index: number, nodes: NodeDatum[]) => number) | 10 | |
| collide.strength | 力的强度 | number | 1 | |
| collide.iterations | 碰撞检测的迭代次数 | number | 1 | |
#### 链接力(link)
| 属性 | 描述 | 类型 | 默认值 | 必选 |
| --------------- | ---------------- | -------------------------------------------------------------------------- | ------- | ---- |
| link.id | 边的 id 生成函数 | (edge: EdgeDatum, index: number, edges: EdgeDatum[]) => string | edge.id | |
| link.distance | 理想边长 | number \| ((edge: EdgeDatum, index: number, edges: EdgeDatum[]) => number) | 30 | |
| link.strength | 力的强度 | number \| ((edge: EdgeDatum, index: number, edges: EdgeDatum[]) => number) | 1 | |
| link.iterations | 链接力的迭代次数 | number | 1 | |
#### 多体力(manyBody)
| 属性 | 描述 | 类型 | 默认值 | 必选 |
| -------------------- | ------------------------- | -------------------------------------------------------------------------- | -------- | ---- |
| manyBody.strength | 力的强度 | number \| ((node: NodeDatum, index: number, nodes: NodeDatum[]) => number) | -30 | |
| manyBody.theta | Barnes-Hut 算法的精度参数 | number | 0.9 | |
| manyBody.distanceMin | 最小作用距离 | number | 1 | |
| manyBody.distanceMax | 最大作用距离 | number | Infinity | |
#### 径向力(radial)
| 属性 | 描述 | 类型 | 默认值 | 必选 |
| --------------- | ----------- | -------------------------------------------------------------------------- | ------ | ---- |
| radial.strength | 力的强度 | number \| ((node: NodeDatum, index: number, nodes: NodeDatum[]) => number) | 0.1 | |
| radial.radius | 目标半径 | number \| ((node: NodeDatum, index: number, nodes: NodeDatum[]) => number) | 100 | |
| radial.x | 球心 x 坐标 | number | 0 | |
| radial.y | 球心 y 坐标 | number | 0 | |
| radial.z | 球心 z 坐标 | number | 0 | |
#### 坐标力(x、y、z)
每个方向的力可以单独配置:
| 属性 | 描述 | 类型 | 默认值 | 必选 |
| ---------- | ---------------- | -------------------------------------------------------------------------- | ------ | ---- |
| x.strength | X 轴方向的力强度 | number \| ((node: NodeDatum, index: number, nodes: NodeDatum[]) => number) | - | |
| x.x | 目标 x 坐标 | number \| ((node: NodeDatum, index: number, nodes: NodeDatum[]) => number) | - | |
| y.strength | Y 轴方向的力强度 | number \| ((node: NodeDatum, index: number, nodes: NodeDatum[]) => number) | - | |
| y.y | 目标 y 坐标 | number \| ((node: NodeDatum, index: number, nodes: NodeDatum[]) => number) | - | |
| z.strength | Z 轴方向的力强度 | number \| ((node: NodeDatum, index: number, nodes: NodeDatum[]) => number) | - | |
| z.z | 目标 z 坐标 | number \| ((node: NodeDatum, index: number, nodes: NodeDatum[]) => number) | - | |
Layout Skill
packages/site/docs/manual/layout/D3ForceLayout.en.md anthropic-skill ~4,468 tokens---
title: D3 Force-Directed Layout
order: 8
---
## Overview
The D3Force layout is a force-directed layout based on [d3-force](https://d3js.org/d3-force). It simulates physical forces (such as attraction, repulsion, collision, etc.) to make the graph reach a stable state with minimal energy.
The main features of this layout are:
1. **Automatic arrangement**: No need to manually set node positions, the system will automatically find suitable positions
2. **Real-time adjustment**: When you drag a node, other nodes will adjust their positions in real time
3. **Flexible configuration**:
- You can adjust the attraction and repulsion between nodes
- You can set the ideal length of edges
- You can fix the positions of important nodes
4. **Animation effect**: Nodes move with smooth animation, making changes more natural
<img alt="D3Force layout diagram" src="https://mdn.alipayobjects.com/huamei_qa8qxu/afts/img/A*-_sFS5IRGGcAAAAAAAAAAAAADmJ7AQ/original" />
## Core Concepts
### Force System
The D3Force layout simulates five different forces to achieve automatic layout. Imagine a physical world where these forces act simultaneously and eventually reach equilibrium:
<img width="350" src="https://mdn.alipayobjects.com/huamei_qa8qxu/afts/img/A*p5L2S6gtZ2AAAAAAAAAAAAAAemJ7AQ/original" alt="force" />
> Note: The arrows of different colors in the diagram represent different types of forces. In the actual layout, these forces are invisible and also affected by other forces.
- **Link Force**: Imagine nodes connected by rubber bands, which pull connected nodes to a suitable distance. The tightness of the rubber band is the force strength, and the ideal length is the distance we set.
- **Many-Body Force**: Similar to magnets, it allows all nodes to attract or repel each other. When the force strength is negative, nodes repel each other (like like poles of magnets); when positive, they attract (like opposite poles). This force determines the density of the graph.
- **Center Force**: Like all nodes are tied to the center of the canvas by an invisible string. This force prevents nodes from drifting too far and keeps the graph centered.
- **Collision Force**: Treats nodes as solid balls. When nodes get too close, they automatically bounce apart. This force mainly prevents node overlap and improves readability.
- **Radial Force**: Imagine an invisible ring that attracts nodes to the ring. By setting the radius and force strength, nodes can form a beautiful circular layout.
### Iteration System
Layout calculation is an iterative process with two key concepts:
#### Alpha Value (Energy)
Like the "energy" of the layout, it determines how vigorously nodes move:
- **Initial state**: Alpha = 1, nodes move vigorously
- **During calculation**: Alpha gradually decreases, node movement slows
- **End state**: When Alpha < alphaMin, nodes stop moving
#### Iterations
Controls the number of times forces are applied in each calculation:
- **Effect**: The larger the value, the more precise the layout, but the slower the computation
- **Adjustment**:
- Simple graphs: use the default value
- Complex graphs: increase the number of iterations as needed
- Real-time interaction: use fewer iterations
> Tip: Iterations and alpha value work together. Increasing iterations makes each step more precise, while alpha controls the overall progress.
## Options
| Property | Description | Type | Default | Required |
| --------------- | -------------------------------------------------- | ------------------------------------------ | ---------- | -------- |
| type | Layout type | string | 'd3-force' | ✓ |
| centerX | Layout center x coordinate | number | width / 2 | |
| centerY | Layout center y coordinate | number | height / 2 | |
| centerStrength | Center force strength | number | - | |
| nodeSize | Node size (diameter), for collision detection | number \| ((node, index, nodes) => number) | 10 | |
| nodeSpacing | Extra spacing between nodes | number \| ((node, index, nodes) => number) | 0 | |
| iterations | Number of force iterations, higher is more precise | number | - | |
| onTick | Callback for each iteration, for real-time results | (data: LayoutMapping) => void | - | |
| forceSimulation | Custom force simulation, defaults to d3.js method | Simulation<NodeDatum, EdgeDatum> | - | |
| randomSource | Function to generate random numbers | () => number | - | |
### Iteration Control
| Property | Description | Type | Default | Required |
| ------------- | ---------------------------------------------------- | ------ | ------- | -------- |
| alpha | Current convergence threshold, controls activity | number | 1 | |
| alphaMin | Minimum threshold to stop, when alpha < this, stop | number | 0.001 | |
| alphaDecay | Decay rate of alpha, [0, 1], 0.028 ≈ 300 iterations | number | 0.028 | |
| alphaTarget | Target alpha, system tries to converge to this value | number | 0 | |
| velocityDecay | Velocity decay factor, higher means slower movement | number | 0.4 | |
### Force Model Options
#### Link Force (link)
| Property | Description | Type | Default | Required |
| --------------- | -------------------------------------------- | ------------------------------------------ | ----------- | -------- |
| link.id | Function to generate edge id | (edge, index, edges) => string | (e) => e.id | |
| link.distance | Ideal edge length | number \| ((edge, index, edges) => number) | 30 | |
| link.strength | Force strength, higher means closer to ideal | number \| ((edge, index, edges) => number) | 1 | |
| link.iterations | Number of link force iterations | number | 1 | |
#### Many-Body Force (manyBody)
| Property | Description | Type | Default | Required |
| -------------------- | --------------------------------------------------------------- | ------------------------------------------ | -------- | -------- |
| manyBody.strength | Force strength, negative for repulsion, positive for attraction | number \| ((node, index, nodes) => number) | -30 | |
| manyBody.theta | Barnes-Hut accuracy, smaller is more accurate | number | 0.9 | |
| manyBody.distanceMin | Minimum distance, prevents excessive force | number | 1 | |
| manyBody.distanceMax | Maximum distance, beyond which no force is applied | number | Infinity | |
#### Center Force (center)
| Property | Description | Type | Default | Required |
| --------------- | --------------------------------------------- | ------ | ------- | -------- |
| center.x | Center x coordinate | number | - | |
| center.y | Center y coordinate | number | - | |
| center.strength | Force strength, higher means closer to center | number | - | |
> Note: In `5.1`, `centerX` / `centerY` are the recommended shortcut fields. If you configure the `center` force directly, it follows the native `d3-force` style.
#### Collision Force (collide)
| Property | Description | Type | Default | Required |
| ------------------ | ----------------------------------------------- | ------------------------------------------ | ------- | -------- |
| collide.radius | Collision radius, nodes repel if closer | number \| ((node, index, nodes) => number) | 10 | |
| collide.strength | Force strength, higher means stronger repulsion | number | 1 | |
| collide.iterations | Number of collision iterations | number | 1 | |
#### Radial Force (radial)
| Property | Description | Type | Default | Required |
| --------------- | --------------------------------------------- | ------------------------------------------ | ------- | -------- |
| radial.strength | Force strength, higher means closer to radius | number \| ((node, index, nodes) => number) | 0.1 | |
| radial.radius | Target radius, nodes are attracted to circle | number \| ((node, index, nodes) => number) | 100 | |
| radial.x | Center x coordinate | number | 0 | |
| radial.y | Center y coordinate | number | 0 | |
#### X Axis Force (x)
| Property | Description | Type | Default | Required |
| ---------- | ----------------------------------------- | ------------------------------------------ | ------- | -------- |
| x.strength | Force strength in x direction | number \| ((node, index, nodes) => number) | - | |
| x.x | Target x coordinate, nodes attracted here | number \| ((node, index, nodes) => number) | - | |
#### Y Axis Force (y)
| Property | Description | Type | Default | Required |
| ---------- | ----------------------------------------- | ------------------------------------------ | ------- | -------- |
| y.strength | Force strength in y direction | number \| ((node, index, nodes) => number) | - | |
| y.y | Target y coordinate, nodes attracted here | number \| ((node, index, nodes) => number) | - | |
## Code Examples
### Prevent Node Overlap
```js
{
layout: {
type: 'd3-force',
collide: {
// Prevent nodes from overlapping by specifying a collision radius for each node.
radius: (d) => d.size / 2,
},
},
}
```
See [Example - Prevent Node Overlap in Force-Directed Layout](/en/examples/layout/force-directed/#prevent-overlap)
### Team Clustering Layout
This example shows how to use force-directed layout for team clustering, where nodes of different teams automatically cluster together.
```js | ob { pin: false, inject: true }
import { Graph } from '@antv/g6';
const graph = new Graph({
container: 'container',
width: 500,
height: 250,
autoFit: 'view',
data: {
nodes: [
// Team A
{ id: 'A1', team: 'A', label: 'A1', size: 30 },
{ id: 'A2', team: 'A', label: 'A2', size: 20 },
{ id: 'A3', team: 'A', label: 'A3', size: 20 },
{ id: 'A4', team: 'A', label: 'A4', size: 20 },
// Team B
{ id: 'B1', team: 'B', label: 'B1', size: 30 },
{ id: 'B2', team: 'B', label: 'B2', size: 20 },
{ id: 'B3', team: 'B', label: 'B3', size: 20 },
{ id: 'B4', team: 'B', label: 'B4', size: 20 },
// Team C
{ id: 'C1', team: 'C', label: 'C1', size: 30 },
{ id: 'C2', team: 'C', label: 'C2', size: 20 },
{ id: 'C3', team: 'C', label: 'C3', size: 20 },
{ id: 'C4', team: 'C', label: 'C4', size: 20 },
],
edges: [
// Team A internal connections
{ source: 'A1', target: 'A2' },
{ source: 'A1', target: 'A3' },
{ source: 'A1', target: 'A4' },
// Team B internal connections
{ source: 'B1', target: 'B2' },
{ source: 'B1', target: 'B3' },
{ source: 'B1', target: 'B4' },
// Team C internal connections
{ source: 'C1', target: 'C2' },
{ source: 'C1', target: 'C3' },
{ source: 'C1', target: 'C4' },
// Few connections between teams
{ source: 'A1', target: 'B1' },
{ source: 'B1', target: 'C1' },
],
},
node: {
style: {
size: (d) => d.size,
fill: (d) => {
// Different colors for different teams
const colors = {
A: '#FF6B6B',
B: '#4ECDC4',
C: '#45B7D1',
};
return colors[d.team];
},
labelText: (d) => d.label,
labelPlacement: 'center',
labelFill: '#fff',
},
},
edge: {
style: {
stroke: '#aaa',
},
},
layout: {
type: 'd3-force',
// Configure link force - nodes within the same team are closer
link: {
distance: (d) => {
// Shorter distance within the same team
if (d.source.team === d.target.team) return 50;
// Longer distance between teams
return 200;
},
strength: (d) => {
// Stronger connection within the same team
if (d.source.team === d.target.team) return 0.7;
// Weaker connection between teams
return 0.1;
},
},
// Configure many-body force - control repulsion between nodes
manyBody: {
strength: (d) => {
// Team leader nodes (ending with 1) have stronger repulsion
if (d.label.endsWith('1')) return -100;
return -30;
},
},
// Configure collision force - prevent node overlap
collide: {
radius: 35,
strength: 0.8,
},
// Configure center force - keep the graph centered
center: {
strength: 0.05,
},
},
behaviors: ['drag-element-force'],
});
graph.render();
```
<details><summary>Show full code</summary>
```javascript
import { Graph } from '@antv/g6';
// Create mock data with nodes from different teams
const data = {
nodes: [
// Team A
{ id: 'A1', team: 'A', label: 'A1', size: 30 },
{ id: 'A2', team: 'A', label: 'A2', size: 20 },
{ id: 'A3', team: 'A', label: 'A3', size: 20 },
{ id: 'A4', team: 'A', label: 'A4', size: 20 },
// Team B
{ id: 'B1', team: 'B', label: 'B1', size: 30 },
{ id: 'B2', team: 'B', label: 'B2', size: 20 },
{ id: 'B3', team: 'B', label: 'B3', size: 20 },
{ id: 'B4', team: 'B', label: 'B4', size: 20 },
// Team C
{ id: 'C1', team: 'C', label: 'C1', size: 30 },
{ id: 'C2', team: 'C', label: 'C2', size: 20 },
{ id: 'C3', team: 'C', label: 'C3', size: 20 },
{ id: 'C4', team: 'C', label: 'C4', size: 20 },
],
edges: [
// Team A internal connections
{ source: 'A1', target: 'A2' },
{ source: 'A1', target: 'A3' },
{ source: 'A1', target: 'A4' },
// Team B internal connections
{ source: 'B1', target: 'B2' },
{ source: 'B1', target: 'B3' },
{ source: 'B1', target: 'B4' },
// Team C internal connections
{ source: 'C1', target: 'C2' },
{ source: 'C1', target: 'C3' },
{ source: 'C1', target: 'C4' },
// Few connections between teams
{ source: 'A1', target: 'B1' },
{ source: 'B1', target: 'C1' },
],
};
const graph = new Graph({
container: 'container',
data,
node: {
style: {
size: (d) => d.size,
fill: (d) => {
// Different colors for different teams
const colors = {
A: '#FF6B6B',
B: '#4ECDC4',
C: '#45B7D1',
};
return colors[d.team];
},
labelText: (d) => d.label,
labelPlacement: 'center',
labelFill: '#fff',
},
},
edge: {
style: {
stroke: '#aaa',
},
},
layout: {
type: 'd3-force',
// Configure link force - nodes within the same team are closer
link: {
distance: (d) => {
// Shorter distance within the same team
if (d.source.team === d.target.team) return 50;
// Longer distance between teams
return 200;
},
strength: (d) => {
// Stronger connection within the same team
if (d.source.team === d.target.team) return 0.7;
// Weaker connection between teams
return 0.1;
},
},
// Configure many-body force - control repulsion between nodes
manyBody: {
strength: (d) => {
// Team leader nodes (ending with 1) have stronger repulsion
if (d.label.endsWith('1')) return -100;
return -30;
},
},
// Configure collision force - prevent node overlap
collide: {
radius: 35,
strength: 0.8,
},
// Configure center force - keep the graph centered
center: {
strength: 0.05,
},
},
behaviors: ['drag-element-force'],
});
graph.render();
```
</details>
Main configuration notes:
- `link.distance`: Shorter within teams, longer between teams
- `link.strength`: Stronger within teams, weaker between teams
- `manyBody.strength`: Controls repulsion between nodes
- `collide`: Prevents node overlap
- `center`: Keeps the layout centered
See also [Customize parameters for different nodes](/en/examples/layout/force-directed/#functional-params).
Layout Skill
packages/site/docs/manual/layout/D3ForceLayout.zh.md anthropic-skill ~3,385 tokens---
title: D3力导向布局 D3Force
order: 8
---
## 概述
D3Force 布局是基于 [d3-force](https://d3js.org/d3-force) 实现的力导向布局。它通过模拟物理力的作用(如引力、斥力、碰撞等),使图布局达到一个能量最小的稳定状态。
这种布局的主要特点是:
1. **自动排列**:不需要手动设置节点位置,系统会自动找到合适的位置
2. **实时调整**:当你拖动某个节点时,其他节点会实时跟随调整位置
3. **灵活配置**:
- 可以调整节点间的吸引力和排斥力
- 可以设置边的理想长度
- 可以固定某些重要节点的位置
4. **动画效果**:节点移动时会有平滑的动画,让变化更自然
<img alt="D3Force 布局示意图" src="https://mdn.alipayobjects.com/huamei_qa8qxu/afts/img/A*-_sFS5IRGGcAAAAAAAAAAAAADmJ7AQ/original" />
## 核心概念
### 力系统 Force System
D3Force 布局通过模拟五种不同的力来实现自动布局。想象一个物理世界,这些力同时作用,最终达到平衡:
<img width="350" src="https://mdn.alipayobjects.com/huamei_qa8qxu/afts/img/A*p5L2S6gtZ2AAAAAAAAAAAAAAemJ7AQ/original" alt="force" />
> 注:图中不同颜色的箭头代表不同类型的力,实际布局中这些力是无形的,同时也会受其他力影响。
- **链接力**(Link Force):想象节点之间连着橡皮筋,可以把相连的节点拉到合适的距离。橡皮筋的松紧度就是力的强度(strength),理想长度就是我们设置的距离(distance)。
- **多体力**(Many-Body Force):类似磁铁的效果,可以让所有节点互相吸引或排斥。力的强度为负值时节点会互相排斥(像相同磁极),为正值时会互相吸引(像相反磁极)。这个力决定了图的疏密程度。
- **中心力**(Center Force):就像所有节点都被一根看不见的绳子拴在画布中心。这个力可以防止节点飘得太远,让整个图保持在画布的中心位置。
- **碰撞力**(Collision Force):让节点变成有实体大小的小球,当节点太近时会自动弹开。这个力主要用来防止节点重叠,提高图的可读性。
- **径向力**(Radial Force):想象有一个看不见的圆环,这个力会把节点吸引到圆环上。通过设置圆的半径和力的强度,可以让节点形成漂亮的环形布局。
### 迭代系统(Iteration System)
布局计算是一个反复调整的过程,包含两个关键概念:
#### Alpha 值(活力值)
就像布局的"能量",决定节点移动的剧烈程度:
- **初始状态**:Alpha = 1,节点移动剧烈
- **计算过程**:Alpha 值逐渐降低,节点移动变缓
- **结束状态**:当 Alpha < alphaMin 时,节点停止移动
#### 迭代次数(Iterations)
控制每次计算时力的作用次数:
- **作用**:值越大,布局越精确,但计算越慢
- **调节**:
- 简单图:使用默认值即可
- 复杂图:可以适当增加迭代次数
- 实时交互:建议使用较小的迭代次数
> 提示:迭代次数(iterations)和活力值(alpha)是相互配合的。增加迭代次数可以让每一步计算更精确,而活力值则控制整体计算的进度。
## 配置项
| 属性 | 描述 | 类型 | 默认值 | 必选 |
| --------------- | --------------------------------------------- | ------------------------------------------ | ---------- | ---- |
| type | 布局类型 | string | 'd3-force' | ✓ |
| centerX | 布局中心点 x 坐标 | number | width / 2 | |
| centerY | 布局中心点 y 坐标 | number | height / 2 | |
| centerStrength | 中心力强度 | number | - | |
| nodeSize | 节点大小(直径),用于碰撞检测防止节点重叠 | number \| ((node, index, nodes) => number) | 10 | |
| nodeSpacing | 节点间额外间距 | number \| ((node, index, nodes) => number) | 0 | |
| iterations | 力的迭代次数,值越大布局越精确但性能消耗越大 | number | - | |
| onTick | 每次迭代的回调函数,用于实时获取布局结果 | (data: LayoutMapping) => void | - | |
| forceSimulation | 自定义力模拟方法,若不指定则使用 d3.js 的方法 | Simulation<NodeDatum, EdgeDatum> | - | |
| randomSource | 用于生成随机数的函数 | () => number | - | |
### 迭代控制
| 属性 | 描述 | 类型 | 默认值 | 必选 |
| ------------- | ------------------------------------------------------ | ------ | ------ | ---- |
| alpha | 当前迭代的收敛阈值,控制布局的活跃程度 | number | 1 | |
| alphaMin | 停止迭代的最小阈值,当 alpha 小于该值时停止迭代 | number | 0.001 | |
| alphaDecay | 收敛阈值的衰减率,范围 [0, 1],0.028 对应约 300 次迭代 | number | 0.028 | |
| alphaTarget | 目标收敛阈值,系统会尝试将 alpha 收敛到该值 | number | 0 | |
| velocityDecay | 速度衰减因子,值越大节点运动越缓慢 | number | 0.4 | |
### 力模型配置
#### 链接力(link)
| 属性 | 描述 | 类型 | 默认值 | 必选 |
| --------------- | ---------------------------------- | ------------------------------------------ | ----------- | ---- |
| link.id | 边的 id 生成函数 | (edge, index, edges) => string | (e) => e.id | |
| link.distance | 理想边长,边会趋向于该长度 | number \| ((edge, index, edges) => number) | 30 | |
| link.strength | 力的强度,值越大边长越接近理想边长 | number \| ((edge, index, edges) => number) | 1 | |
| link.iterations | 链接力的迭代次数 | number | 1 | |
#### 多体力(manyBody)
| 属性 | 描述 | 类型 | 默认值 | 必选 |
| -------------------- | ----------------------------------------------------- | ------------------------------------------ | -------- | ---- |
| manyBody.strength | 力的强度,负值为斥力,正值为引力 | number \| ((node, index, nodes) => number) | -30 | |
| manyBody.theta | Barnes-Hut 算法的精度参数,值越小越精确但性能消耗越大 | number | 0.9 | |
| manyBody.distanceMin | 最小作用距离,防止力过大 | number | 1 | |
| manyBody.distanceMax | 最大作用距离,超过该距离的节点不产生力 | number | Infinity | |
#### 中心力(center)
| 属性 | 描述 | 类型 | 默认值 | 必选 |
| --------------- | ---------------------------------- | ------ | ------ | ---- |
| center.x | 中心点 x 坐标 | number | - | |
| center.y | 中心点 y 坐标 | number | - | |
| center.strength | 力的强度,值越大节点越趋向于中心点 | number | - | |
> 补充:5.1 中推荐优先使用 `centerX` / `centerY` 作为快捷配置;如果直接配置 `center` force,则按 d3-force 原生写法生效。
#### 碰撞力(collide)
| 属性 | 描述 | 类型 | 默认值 | 必选 |
| ------------------ | -------------------------------------- | ------------------------------------------ | ------ | ---- |
| collide.radius | 碰撞半径,小于该距离的节点会产生排斥力 | number \| ((node, index, nodes) => number) | 10 | |
| collide.strength | 力的强度,值越大排斥效果越明显 | number | 1 | |
| collide.iterations | 碰撞检测的迭代次数 | number | 1 | |
#### 径向力(radial)
| 属性 | 描述 | 类型 | 默认值 | 必选 |
| --------------- | -------------------------------------- | ------------------------------------------ | ------ | ---- |
| radial.strength | 力的强度,值越大节点越趋向于目标半径 | number \| ((node, index, nodes) => number) | 0.1 | |
| radial.radius | 目标半径,节点会被吸引到该半径的圆周上 | number \| ((node, index, nodes) => number) | 100 | |
| radial.x | 圆心 x 坐标 | number | 0 | |
| radial.y | 圆心 y 坐标 | number | 0 | |
#### X 轴力(x)
| 属性 | 描述 | 类型 | 默认值 | 必选 |
| ---------- | ----------------------------------- | ------------------------------------------ | ------ | ---- |
| x.strength | X 轴方向的力强度 | number \| ((node, index, nodes) => number) | - | |
| x.x | 目标 x 坐标,节点会被吸引到这个位置 | number \| ((node, index, nodes) => number) | - | |
#### Y 轴力(y)
| 属性 | 描述 | 类型 | 默认值 | 必选 |
| ---------- | ----------------------------------- | ------------------------------------------ | ------ | ---- |
| y.strength | Y 轴方向的力强度 | number \| ((node, index, nodes) => number) | - | |
| y.y | 目标 y 坐标,节点会被吸引到这个位置 | number \| ((node, index, nodes) => number) | - | |
## 代码示例
### 防止节点重叠
```js
{
layout: {
type: 'd3-force',
collide: {
// Prevent nodes from overlapping by specifying a collision radius for each node.
radius: (d) => d.size / 2,
},
},
}
```
效果见 [示例 - 力导向布局防止节点重叠](/examples/layout/force-directed/#prevent-overlap)
### 团队聚类布局
该示例展示了如何使用力导向布局实现团队聚类效果,不同团队的节点会自动聚集在一起。
```js | ob { pin: false, inject: true }
import { Graph } from '@antv/g6';
const graph = new Graph({
container: 'container',
width: 500,
height: 250,
autoFit: 'view',
data: {
nodes: [
// 团队 A
{ id: 'A1', team: 'A', label: 'A1', size: 30 },
{ id: 'A2', team: 'A', label: 'A2', size: 20 },
{ id: 'A3', team: 'A', label: 'A3', size: 20 },
{ id: 'A4', team: 'A', label: 'A4', size: 20 },
// 团队 B
{ id: 'B1', team: 'B', label: 'B1', size: 30 },
{ id: 'B2', team: 'B', label: 'B2', size: 20 },
{ id: 'B3', team: 'B', label: 'B3', size: 20 },
{ id: 'B4', team: 'B', label: 'B4', size: 20 },
// 团队 C
{ id: 'C1', team: 'C', label: 'C1', size: 30 },
{ id: 'C2', team: 'C', label: 'C2', size: 20 },
{ id: 'C3', team: 'C', label: 'C3', size: 20 },
{ id: 'C4', team: 'C', label: 'C4', size: 20 },
],
edges: [
// 团队 A 内部连接
{ source: 'A1', target: 'A2' },
{ source: 'A1', target: 'A3' },
{ source: 'A1', target: 'A4' },
// 团队 B 内部连接
{ source: 'B1', target: 'B2' },
{ source: 'B1', target: 'B3' },
{ source: 'B1', target: 'B4' },
// 团队 C 内部连接
{ source: 'C1', target: 'C2' },
{ source: 'C1', target: 'C3' },
{ source: 'C1', target: 'C4' },
// 团队间的少量连接
{ source: 'A1', target: 'B1' },
{ source: 'B1', target: 'C1' },
],
},
node: {
style: {
size: (d) => d.size,
fill: (d) => {
// 不同团队使用不同颜色
const colors = {
A: '#FF6B6B',
B: '#4ECDC4',
C: '#45B7D1',
};
return colors[d.team];
},
labelText: (d) => d.label,
labelPlacement: 'center',
labelFill: '#fff',
},
},
edge: {
style: {
stroke: '#aaa',
},
},
layout: {
type: 'd3-force',
// 配置链接力 - 团队内部节点更靠近
link: {
distance: (d) => {
// 同一团队内的连接距离更短
if (d.source.team === d.target.team) return 50;
// 不同团队间的连接距离更长
return 200;
},
strength: (d) => {
// 同一团队内的连接强度更大
if (d.source.team === d.target.team) return 0.7;
// 不同团队间的连接强度更小
return 0.1;
},
},
// 配置多体力 - 控制节点间的排斥力
manyBody: {
strength: (d) => {
// 团队领导节点(编号1)的排斥力更强
if (d.label.endsWith('1')) return -100;
return -30;
},
},
// 配置碰撞力 - 防止节点重叠
collide: {
radius: 35,
strength: 0.8,
},
// 配置中心力 - 保持图形在画布中心
center: {
strength: 0.05,
},
},
behaviors: ['drag-element-force'],
});
graph.render();
```
<details><summary>展开查看完整代码</summary>
```javascript
import { Graph } from '@antv/g6';
// 创建模拟数据,包含不同团队的节点
const data = {
nodes: [
// 团队 A
{ id: 'A1', team: 'A', label: 'A1', size: 30 },
{ id: 'A2', team: 'A', label: 'A2', size: 20 },
{ id: 'A3', team: 'A', label: 'A3', size: 20 },
{ id: 'A4', team: 'A', label: 'A4', size: 20 },
// 团队 B
{ id: 'B1', team: 'B', label: 'B1', size: 30 },
{ id: 'B2', team: 'B', label: 'B2', size: 20 },
{ id: 'B3', team: 'B', label: 'B3', size: 20 },
{ id: 'B4', team: 'B', label: 'B4', size: 20 },
// 团队 C
{ id: 'C1', team: 'C', label: 'C1', size: 30 },
{ id: 'C2', team: 'C', label: 'C2', size: 20 },
{ id: 'C3', team: 'C', label: 'C3', size: 20 },
{ id: 'C4', team: 'C', label: 'C4', size: 20 },
],
edges: [
// 团队 A 内部连接
{ source: 'A1', target: 'A2' },
{ source: 'A1', target: 'A3' },
{ source: 'A1', target: 'A4' },
// 团队 B 内部连接
{ source: 'B1', target: 'B2' },
{ source: 'B1', target: 'B3' },
{ source: 'B1', target: 'B4' },
// 团队 C 内部连接
{ source: 'C1', target: 'C2' },
{ source: 'C1', target: 'C3' },
{ source: 'C1', target: 'C4' },
// 团队间的少量连接
{ source: 'A1', target: 'B1' },
{ source: 'B1', target: 'C1' },
],
};
const graph = new Graph({
container: 'container',
data,
node: {
style: {
size: (d) => d.size,
fill: (d) => {
// 不同团队使用不同颜色
const colors = {
A: '#FF6B6B',
B: '#4ECDC4',
C: '#45B7D1',
};
return colors[d.team];
},
labelText: (d) => d.label,
labelPlacement: 'center',
labelFill: '#fff',
},
},
edge: {
style: {
stroke: '#aaa',
},
},
layout: {
type: 'd3-force',
// 配置链接力 - 团队内部节点更靠近
link: {
distance: (d) => {
// 同一团队内的连接距离更短
if (d.source.team === d.target.team) return 50;
// 不同团队间的连接距离更长
return 200;
},
strength: (d) => {
// 同一团队内的连接强度更大
if (d.source.team === d.target.team) return 0.7;
// 不同团队间的连接强度更小
return 0.1;
},
},
// 配置多体力 - 控制节点间的排斥力
manyBody: {
strength: (d) => {
// 团队领导节点(编号1)的排斥力更强
if (d.label.endsWith('1')) return -100;
return -30;
},
},
// 配置碰撞力 - 防止节点重叠
collide: {
radius: 35,
strength: 0.8,
},
// 配置中心力 - 保持图形在画布中心
center: {
strength: 0.05,
},
},
behaviors: ['drag-element-force'],
});
graph.render();
```
</details>
主要配置说明:
- `link.distance`:团队内部距离短,团队间距离长
- `link.strength`:团队内部连接强度大,团队间连接强度小
- `manyBody.strength`:控制节点间排斥力
- `collide`:防止节点重叠
- `center`:保持整体布局在画布中心
还可以参考 [定制不同节点的参数](/examples/layout/force-directed/#functional-params) 示例。
Layout Skill
packages/site/docs/manual/layout/DagreLayout.en.md anthropic-skill ~2,055 tokens---
title: Dagre Layout
order: 9
---
# Dagre Layout
## Overview
Dagre is a hierarchical layout suitable for directed acyclic graphs (DAGs). It can automatically handle the direction and spacing between nodes and supports both horizontal and vertical layouts. See more Dagre layout [examples](/en/examples#layout-dagre), [source code](https://github.com/dagrejs/dagre/blob/master/lib/layout.js), and [official documentation](https://github.com/dagrejs/dagre/wiki).
<img src='https://gw.alipayobjects.com/mdn/rms_f8c6a0/afts/img/A*2uMmRo5wYPUAAAAAAAAAAABkARQnAQ' width=350 alt='Dagre Layout'/>
## Configuration
```js
const graph = new Graph({
layout: {
type: 'dagre',
rankdir: 'TB',
align: 'UL',
nodesep: 50,
ranksep: 50,
},
});
```
## Options
> For more options, refer to the [official documentation](https://github.com/dagrejs/dagre/wiki#configuring-the-layout)
<img src="https://img.alicdn.com/imgextra/i3/O1CN01OpQHBZ1HcpZuWZLS7_!!6000000000779-0-tps-1274-1234.jpg" width="400" alt="Dagre Layout Options Illustration" />
| Property | Description | Type | Default | Required |
| --------------- | ------------------------------------------------------------------------------------------------------------------------------------------ | --------------------------------------------------- | ----------------- | -------- |
| type | Layout type | `dagre` | - | ✓ |
| rankdir | Layout direction, options | `TB` \| `BT` \| `LR` \| `RL` | `TB` | |
| align | Node alignment, options | `UL` \| `UR` \| `DL` \| `DR` | `UL` | |
| nodesep | Node spacing (px). For `TB` or `BT`, it is the horizontal spacing; for `LR` or `RL`, it is the vertical spacing | number | 50 | |
| ranksep | Rank spacing (px). For `TB` or `BT`, it is the vertical spacing between adjacent ranks; for `LR` or `RL`, it is the horizontal spacing | number | 100 | |
| ranker | Algorithm for assigning ranks to nodes: `longest-path`, `tight-tree`, or `network-simplex` | `network-simplex` \| `tight-tree` \| `longest-path` | `network-simplex` | |
| directed | Whether to treat the graph as directed | boolean | true | |
| compound | Whether to support nested structures | boolean | true | |
| multigraph | Whether to allow multi-edges | boolean | true | |
| nodeSize | G6 custom property, specify node size for all or each node. If a single number, width and height are the same; if array: `[width, height]` | number \| number[] \| () => (number \| number[]) | [0, 0] | |
| edgeMinLen | Minimum number of ranks crossed by an edge | number \| (edge) => number | 1 | |
| edgeWeight | Edge weight, used to affect optimization priority | number \| (edge) => number | | |
| edgeLabelSize | Edge label size, used to reserve layout space | number[] \| (edge) => number[] | | |
| edgeLabelPos | Edge label position | string \| (edge) => string | | |
| edgeLabelOffset | Offset between the label and the edge | number \| (edge) => number | | |
> Note: `dagre` does not require configuring `controlPoints` separately. G6 automatically converts the polyline points returned by the layout into `style.controlPoints` on the edge.
### rankdir
> `TB` | `BT` | `LR` | `RL`, **Default**: `TB`
Layout direction
- `TB`: Top to Bottom;
<img src='https://img.alicdn.com/imgextra/i3/O1CN01ulI3Se1DeQUfhQ29v_!!6000000000241-0-tps-1092-1218.jpg' width=170 alt='Top to Bottom Layout'/>
- `BT`: Bottom to Top;
<img src='https://img.alicdn.com/imgextra/i1/O1CN01IfytBS1EOE6NXVprx_!!6000000000341-0-tps-1004-1236.jpg' width=170 alt='Bottom to Top Layout'/>
- `LR`: Left to Right;
<img src='https://img.alicdn.com/imgextra/i2/O1CN01tpEdMJ1MsTBKpoP6r_!!6000000001490-0-tps-1452-786.jpg' width=170 alt='Left to Right Layout'/>
- `RL`: Right to Left.
<img src='https://img.alicdn.com/imgextra/i4/O1CN01Lw8JHC27j71xd0wl9_!!6000000007832-0-tps-1460-848.jpg' width=170 alt='Right to Left Layout'/>
### align
> `UL` | `UR` | `DL` | `DR`, **Default**: `UL`
Node alignment
- `UL`: Upper Left
- `UR`: Upper Right
- `DL`: Down Left
- `DR`: Down Right
### nodesep
> number, **Default**: 50
Node spacing (px). For `TB` or `BT`, it's the horizontal spacing; for `LR` or `RL`, it's the vertical spacing
### ranksep
> number, **Default**: 50
Rank spacing (px). For `TB` or `BT`, it's the vertical spacing between ranks; for `LR` or `RL`, it's the horizontal spacing between ranks
### ranker
> `network-simplex` | `tight-tree` | `longest-path`, **Default**: `network-simplex`
Algorithm for assigning ranks to nodes, supports three algorithms:
- `longest-path`: Uses DFS to recursively find the longest path for each node. Simple and fast, but may result in many long edges.
- `tight-tree`: An optimization algorithm to reduce the number of long edges. It first uses `longest-path` to compute initial ranks, then adjusts slack edges to build a feasible tree.
- `network-simplex`: Based on [A Technique for Drawing Directed Graphs](https://www.graphviz.org/documentation/TSE93.pdf), iteratively modifies node ranks to minimize slack edges.
### nodeSize
> number \| number[] \| () => (number \| number[])
G6 custom property, specify node size for all or each node. If a single number, width and height are the same; if array: `[width, height]`
```js
(d) => {
// d is a node
if (d.id === 'testId') return 20;
return [10, 20];
};
```
## Applicable Scenarios
- **Flowcharts**: Suitable for displaying flowcharts, automatically handling direction and spacing between nodes.
- **Dependency Graphs**: Display dependencies between packages or modules.
- **Task Scheduling Graphs**: Show dependencies and execution order between tasks.
## Related Documentation
> The following documents can help you better understand Dagre layout
- [Graph Layout Algorithms|Detailed Dagre Layout](https://mp.weixin.qq.com/s/EdyTfFUH7fyMefNSBXI2nA)
- [In-depth Interpretation of Dagre Layout Algorithm](https://www.yuque.com/antv/g6-blog/xxp5nl)
Layout Skill
packages/site/docs/manual/layout/DagreLayout.zh.md anthropic-skill ~1,702 tokens---
title: Dagre 布局
order: 9
---
## 概述
Dagre 是一种层次化布局,适用于有向无环图(DAG)的布局场景,能够自动处理节点之间的方向和间距,支持水平和垂直布局。参考更多 Dagre 布局[样例](/examples#layout-dagre)或[源码](https://github.com/dagrejs/dagre/blob/master/lib/layout.js)以及[官方文档](https://github.com/dagrejs/dagre/wiki)。
<img src='https://gw.alipayobjects.com/mdn/rms_f8c6a0/afts/img/A*2uMmRo5wYPUAAAAAAAAAAABkARQnAQ' width=350 alt='Dagre布局'/>
## 配置方式
```js
const graph = new Graph({
layout: {
type: 'dagre',
rankdir: 'TB',
align: 'UL',
nodesep: 50,
ranksep: 50,
},
});
```
## 配置项
> 更多配置项可参考[官方文档](https://github.com/dagrejs/dagre/wiki#configuring-the-layout)
<img src="https://img.alicdn.com/imgextra/i3/O1CN01OpQHBZ1HcpZuWZLS7_!!6000000000779-0-tps-1274-1234.jpg" width="400" alt="Dagre 布局配置项图解" />
| 属性 | 描述 | 类型 | 默认值 | 必选 |
| --------------- | ----------------------------------------------------------------------------------------------------------------------------------------------- | --------------------------------------------------- | ----------------- | ---- |
| type | 布局类型 | `dagre` | - | ✓ |
| rankdir | 布局方向,可选值 | `TB` \| `BT` \| `LR` \| `RL` | `TB` | |
| align | 节点对齐方式,可选值 | `UL` \| `UR` \| `DL` \| `DR` | `UL` | |
| nodesep | 节点间距(px)。在 rankdir 为 `TB` 或 `BT` 时是节点的水平间距;在 rankdir 为 `LR` 或 `RL` 时代表节点的竖直方向间距 | number | 50 | |
| ranksep | 层间距(px)。在 rankdir 为 `TB` 或 `BT` 时是竖直方向相邻层间距;在 rankdir 为 `LR` 或 `RL` 时代表水平方向相邻层间距 | number | 100 | |
| ranker | 为每个节点分配等级的算法,共支持三种算法,分别是:`longest-path`、`tight-tree`、`network-simplex` | `network-simplex` \| `tight-tree` \| `longest-path` | `network-simplex` | |
| directed | 是否按有向图处理 | boolean | true | |
| compound | 是否支持嵌套结构 | boolean | true | |
| multigraph | 是否允许多重边 | boolean | true | |
| nodeSize | G6 自定义属性,统一指定或为每个节点指定节点大小。如果仅返回单个 number,则表示节点的宽度和高度相同;如果返回一个数组,则形如:`[width, height]` | number \| number[] \| () => (number \| number[]) | [0, 0] | |
| edgeMinLen | 边跨越的最小层数 | number \| (edge) => number | 1 | |
| edgeWeight | 边权重,用于影响优化优先级 | number \| (edge) => number | | |
| edgeLabelSize | 边标签尺寸,用于预留空间 | number[] \| (edge) => number[] | | |
| edgeLabelPos | 边标签位置 | string \| (edge) => string | | |
| edgeLabelOffset | 标签与边的偏移 | number \| (edge) => number | | |
> 补充:`dagre` 不需要单独配置 `controlPoints`,G6 会把布局输出的折线点自动转换为边的 `style.controlPoints`。
### rankdir
> `TB` | `BT` | `LR` | `RL`, **Default**: `TB`
布局方向
- `TB`:从上到下;
<img src='https://img.alicdn.com/imgextra/i3/O1CN01ulI3Se1DeQUfhQ29v_!!6000000000241-0-tps-1092-1218.jpg' width=170 alt=':从上到下布局'/>
- `BT`:从下到上;
<img src='https://img.alicdn.com/imgextra/i1/O1CN01IfytBS1EOE6NXVprx_!!6000000000341-0-tps-1004-1236.jpg' width=170 alt='从下到上布局'/>
- `LR`:从左到右;
<img src='https://img.alicdn.com/imgextra/i2/O1CN01tpEdMJ1MsTBKpoP6r_!!6000000001490-0-tps-1452-786.jpg' width=170 alt='从左到右布局'/>
- `RL`:从右到左。
<img src='https://img.alicdn.com/imgextra/i4/O1CN01Lw8JHC27j71xd0wl9_!!6000000007832-0-tps-1460-848.jpg' width=170 alt='水平布局'/>
### align
> `UL` | `UR` | `DL` | `DR`, **Default**: `UL`
节点对齐方式
- `UL`:左上对齐
- `UR`:右上对齐
- `DL`:左下对齐
- `DR`:右下对齐
### nodesep
> number, **Default**: 50
节点间距(px)。在rankdir 为 `TB` 或 `BT` 时是节点的水平间距;在rankdir 为 `LR` 或 `RL` 时代表节点的竖直方向间距
### ranksep
> number, **Default**: 50
层间距(px)。在rankdir 为 `TB` 或 `BT` 时是竖直方向相邻层间距;在rankdir 为 `LR` 或 `RL` 时代表水平方向相邻层间距
### ranker
> `network-simplex` | `tight-tree` | `longest-path`, **Default**: `network-simplex`
为每个节点分配层级的算法,共支持三种算法,分别是:
- `longest-path`: 最长路径算法,使用DFS深度优先搜索,递归查找每个节点的最长路径。优点是计算简单速度快,但会导致长边过多;
- `tight-tree`: 紧凑树算法,一种优化算法,目的是减少长边的数量。先用最长路径算法`longest-path`计算出初始层级,然后调整松弛边的长度,从而构建可行树。
- `network-simplex`: 网络单形法,参考算法[A Technique for Drawing Directed Graphs](https://www.graphviz.org/documentation/TSE93.pdf),核心思想是迭代修改节点的层级,缩小松弛边。
### nodeSize
> number \| number[] \| () => (number \| number[])
G6自定义属性,统一指定或为每个节点指定节点大小。如果仅返回单个number,则表示节点的宽度和高度相同;如果返回一个数组,则形如:`[width, height]`
```js
(d) => {
// d 是一个节点
if (d.id === 'testId') return 20;
return [10, 20];
};
```
### controlPoints
> boolean, **Default**: false
是否保留边的控制点。
## 布局适用场景
- **流程图**:适合展示流程图,节点之间的方向和间距会自动处理;
- **依赖关系图**:展示软件包或模块之间的依赖关系;
- **任务调度图**:展示任务之间的依赖关系和执行顺序。
## 相关文档
> 以下文档可以帮助你更好地理解Dagre 布局
- [图布局算法|详解 Dagre 布局](https://mp.weixin.qq.com/s/EdyTfFUH7fyMefNSBXI2nA)
- [深入解读Dagre布局算法](https://www.yuque.com/antv/g6-blog/xxp5nl)
Layout Skill
packages/site/docs/manual/layout/DendrogramLayout.en.md anthropic-skill ~796 tokens---
title: Dendrogram Layout
order: 10
---
## Overview
The dendrogram layout is suitable for visualizing hierarchical clustering data. Its feature is that all child nodes are laid out on the same level, node size is not considered, and each node is treated as 1px.
<img src='https://gw.alipayobjects.com/mdn/rms_f8c6a0/afts/img/A*zX7tSLqBvwcAAAAAAAAAAABkARQnAQ' width=400 alt='Dendrogram Layout Example'/>
## Configuration
```js
const graph = new Graph({
layout: {
type: 'dendrogram',
direction: 'LR',
nodeSep: 30,
rankSep: 250,
radial: false,
},
});
```
## Options
<img src="https://mdn.alipayobjects.com/huamei_qa8qxu/afts/img/A*tTShQLD_dGoAAAAAAAAAAAAAemJ7AQ/original" width="400" alt="Dendrogram Layout Options Illustration" />
| Property | Description | Type | Default | Required |
| --------- | ------------------------------------------------------ | ------------------------------------------ | ------- | -------- |
| type | Layout type | `dendrogram` | - | ✓ |
| direction | Layout direction, [options](#direction) | `LR` \| `RL` \| `TB` \| `BT` \| `H` \| `V` | `LR` | |
| nodeSep | Node spacing, distance between nodes on the same level | number | 20 | |
| rankSep | Rank spacing, distance between different levels | number | 200 | |
| radial | Whether to enable radial layout, [see below](#radial) | boolean | false | |
### direction
Tree layout direction options:
- `TB`: Root at the top, layout downward
<img src='https://gw.alipayobjects.com/mdn/rms_f8c6a0/afts/img/A*krAnRrLTEnEAAAAAAAAAAABkARQnAQ' width=115 alt='TB direction'/>
- `BT`: Root at the bottom, layout upward
<img src='https://gw.alipayobjects.com/mdn/rms_f8c6a0/afts/img/A*0HRyS64i7QoAAAAAAAAAAABkARQnAQ' width=115 alt='BT direction'/>
- `LR`: Root at the left, layout to the right
<img src='https://gw.alipayobjects.com/mdn/rms_f8c6a0/afts/img/A*T5KZTJdA2OUAAAAAAAAAAABkARQnAQ' width=55 alt='LR direction'/>
- `RL`: Root at the right, layout to the left
<img src='https://gw.alipayobjects.com/mdn/rms_f8c6a0/afts/img/A*q7QJQ5RbQ5kAAAAAAAAAAABkARQnAQ' width=55 alt='RL direction'/>
- `H`: Root in the middle, horizontal symmetric layout
<img src='https://gw.alipayobjects.com/mdn/rms_f8c6a0/afts/img/A*tzIfRJ5CuR8AAAAAAAAAAABkARQnAQ' width=85 alt='H direction'/>
- `V`: Root in the middle, vertical symmetric layout
<img src='https://gw.alipayobjects.com/mdn/rms_f8c6a0/afts/img/A*B9sjToOzCiAAAAAAAAAAAABkARQnAQ' width=115 alt='V direction'/>
### radial
Whether to enable radial layout mode. When enabled, nodes are distributed radially around the root node.
If `radial` is set to `true`, it is recommended to set `direction` to `'LR'` or `'RL'` for best results.
<img src='https://gw.alipayobjects.com/mdn/rms_f8c6a0/afts/img/A*AhopQI5j-bcAAAAAAAAAAABkARQnAQ' width=175 alt='Radial Layout'/>
Layout Skill
packages/site/docs/manual/layout/DendrogramLayout.zh.md anthropic-skill ~610 tokens---
title: 生态树 Dendrogram
order: 10
---
## 概述
生态树布局适用于层次聚类数据的可视化,其特点是所有子节点布局在同一层级,不考虑节点大小,每个节点被当成 1px 处理。
<img src='https://gw.alipayobjects.com/mdn/rms_f8c6a0/afts/img/A*zX7tSLqBvwcAAAAAAAAAAABkARQnAQ' width=400 alt='生态树布局示例'/>
## 配置方式
```js
const graph = new Graph({
layout: {
type: 'dendrogram',
direction: 'LR',
nodeSep: 30,
rankSep: 250,
radial: false,
},
});
```
## 配置项
<img src="https://mdn.alipayobjects.com/huamei_qa8qxu/afts/img/A*tTShQLD_dGoAAAAAAAAAAAAAemJ7AQ/original" width="400" alt="生态树配置项图解" />
| 属性 | 描述 | 类型 | 默认值 | 必选 |
| --------- | ---------------------------------------------- | ------------------------------------------ | ------ | ---- |
| type | 布局类型 | `dendrogram` | - | ✓ |
| direction | 布局方向,[可选值](#direction) | `LR` \| `RL` \| `TB` \| `BT` \| `H` \| `V` | `LR` | |
| nodeSep | 节点间距,即同一层级节点之间的距离,单位为像素 | number | 20 | |
| rankSep | 层级间距,即不同层级之间的距离,单位为像素 | number | 200 | |
| radial | 是否启用辐射状布局,[说明](#radial) | boolean | false | |
### direction
树布局的方向,有以下选项:
- `TB`:根节点在上,往下布局
<img src='https://gw.alipayobjects.com/mdn/rms_f8c6a0/afts/img/A*krAnRrLTEnEAAAAAAAAAAABkARQnAQ' width=115 alt='TB方向'/>
- `BT`:根节点在下,往上布局
<img src='https://gw.alipayobjects.com/mdn/rms_f8c6a0/afts/img/A*0HRyS64i7QoAAAAAAAAAAABkARQnAQ' width=115 alt='BT方向'/>
- `LR`:根节点在左,往右布局
<img src='https://gw.alipayobjects.com/mdn/rms_f8c6a0/afts/img/A*T5KZTJdA2OUAAAAAAAAAAABkARQnAQ' width=55 alt='LR方向'/>
- `RL`:根节点在右,往左布局
<img src='https://gw.alipayobjects.com/mdn/rms_f8c6a0/afts/img/A*q7QJQ5RbQ5kAAAAAAAAAAABkARQnAQ' width=55 alt='RL方向'/>
- `H`:根节点在中间,水平对称布局
<img src='https://gw.alipayobjects.com/mdn/rms_f8c6a0/afts/img/A*tzIfRJ5CuR8AAAAAAAAAAABkARQnAQ' width=85 alt='H方向'/>
- `V`:根节点在中间,垂直对称布局
<img src='https://gw.alipayobjects.com/mdn/rms_f8c6a0/afts/img/A*B9sjToOzCiAAAAAAAAAAAABkARQnAQ' width=115 alt='V方向'/>
### radial
是否启用辐射状布局模式。启用后,节点将以根节点为中心呈辐射状分布。
若 `radial` 设置为 `true`,建议将 `direction` 设置为 `'LR'` 或 `'RL'` 以获得最佳效果。
<img src='https://gw.alipayobjects.com/mdn/rms_f8c6a0/afts/img/A*AhopQI5j-bcAAAAAAAAAAABkARQnAQ' width=175 alt='辐射状布局'/>
Layout Skill
packages/site/docs/manual/layout/Fishbone.en.md anthropic-skill ~3,340 tokens---
title: Fishbone Layout
order: 11
---
## Overview
Fishbone layout is a graphical layout specifically designed for representing hierarchical data. By simulating the shape of a fishbone, it arranges data nodes according to their hierarchy, making the hierarchical relationships of the data clearer and more intuitive. Fishbone layout is especially suitable for datasets that need to show causality, hierarchy, or classification information.
## Use Cases
- Displaying hierarchical data, such as organizational structures or classification systems
- Showing problem analysis processes, such as fault analysis or quality analysis
- Displaying decision processes, such as decision trees or factor analysis
## Online Demo
<embed src="@/common/api/layout/fishbone.md"></embed>
## Basic Usage
```js
const graph = new Graph({
layout: {
type: 'fishbone',
direction: 'LR',
hGap: 50,
vGap: 50,
getRibSep: () => 60,
},
});
```
## Options
| Property | Description | Type | Default | Required |
| ---------------------- | ------------------------------------------------------------------------------------------------ | -------------------------------------------------------------------------------------------------------------------------------------- | -------- | -------- |
| type | Layout type | `fishbone` | - | ✓ |
| direction | Layout direction, `RL` (right to left, head on right), `LR` (left to right, head on left) | `RL` \| `LR` | `RL` | |
| hGap | Horizontal gap | number | - | |
| vGap | Vertical gap | number | - | |
| getRibSep | Function to get rib gap | (node: NodeData) => number | () => 60 | |
| width | Layout width | number | - | |
| height | Layout height | number | - | |
| nodeSize | Node size | number \| [number, number] \| [number, number, number] \| ((node: NodeData) => number \| [number, number] \| [number, number, number]) | - | |
| isLayoutInvisibleNodes | Whether invisible nodes participate in layout (effective when preLayout is true) | boolean | - | |
| nodeFilter | Nodes to participate in this layout | (node: NodeData) => boolean | - | |
| preLayout | Use pre-layout, calculate layout before initializing elements (not suitable for pipeline layout) | boolean | - | |
## Code Example
### Basic Usage
The simplest configuration:
```js
import { Graph, treeToGraphData } from '@antv/g6';
const graph = new Graph({
layout: {
type: 'fishbone',
},
autoFit: 'view',
data: treeToGraphData({
nodes: [
{ id: 'root', data: { label: 'Root' } },
{ id: 'child1', data: { label: 'Child 1' } },
{ id: 'child2', data: { label: 'Child 2' } },
{ id: 'child3', data: { label: 'Child 3' } },
],
edges: [
{ id: 'e1', source: 'root', target: 'child1' },
{ id: 'e2', source: 'root', target: 'child2' },
{ id: 'e3', source: 'root', target: 'child3' },
],
}),
edge: {
type: 'polyline',
style: {
lineWidth: 3,
},
},
behaviors: ['drag-canvas'],
});
```
Result:
```js | ob { pin: false, inject: true }
import { Graph } from '@antv/g6';
const graph = new Graph({
container: 'container',
width: 600,
height: 400,
layout: {
type: 'fishbone',
},
autoFit: 'view',
data: {
nodes: [
{
id: 'Quality',
depth: 0,
children: ['Machine', 'Method', 'Material', 'Man Power', 'Measurement', 'Milieu'],
},
{
id: 'Machine',
depth: 1,
children: ['Mill', 'Mixer', 'Metal Lathe'],
},
{
id: 'Mill',
depth: 2,
},
{
id: 'Mixer',
depth: 2,
},
{
id: 'Metal Lathe',
depth: 2,
children: ['Milling'],
},
{
id: 'Milling',
depth: 3,
},
{
id: 'Method',
depth: 1,
},
{
id: 'Material',
depth: 1,
children: ['Masonite', 'Marscapone', 'Meat'],
},
{
id: 'Masonite',
depth: 2,
children: ['spearMint', 'pepperMint', 'test1'],
},
{
id: 'spearMint',
depth: 3,
},
{
id: 'pepperMint',
depth: 3,
children: ['test3'],
},
{
id: 'test3',
depth: 4,
},
{
id: 'test1',
depth: 3,
children: ['test4'],
},
{
id: 'test4',
depth: 4,
},
{
id: 'Marscapone',
depth: 2,
children: ['Malty', 'Minty'],
},
{
id: 'Malty',
depth: 3,
},
{
id: 'Minty',
depth: 3,
},
{
id: 'Meat',
depth: 2,
children: ['Mutton'],
},
{
id: 'Mutton',
depth: 3,
},
{
id: 'Man Power',
depth: 1,
children: ['Manager', "Master's Student", 'Magician', 'Miner', 'Magister', 'Massage Artist'],
},
{
id: 'Manager',
depth: 2,
},
{
id: "Master's Student",
depth: 2,
},
{
id: 'Magician',
depth: 2,
},
{
id: 'Miner',
depth: 2,
},
{
id: 'Magister',
depth: 2,
children: ['Malpractice'],
},
{
id: 'Malpractice',
depth: 3,
},
{
id: 'Massage Artist',
depth: 2,
children: ['Masseur', 'Masseuse'],
},
{
id: 'Masseur',
depth: 3,
},
{
id: 'Masseuse',
depth: 3,
},
{
id: 'Measurement',
depth: 1,
children: ['Malleability'],
},
{
id: 'Malleability',
depth: 2,
},
{
id: 'Milieu',
depth: 1,
children: ['Marine'],
},
{
id: 'Marine',
depth: 2,
},
],
edges: [
{
source: 'Quality',
target: 'Machine',
},
{
source: 'Quality',
target: 'Method',
},
{
source: 'Quality',
target: 'Material',
},
{
source: 'Quality',
target: 'Man Power',
},
{
source: 'Quality',
target: 'Measurement',
},
{
source: 'Quality',
target: 'Milieu',
},
{
source: 'Machine',
target: 'Mill',
},
{
source: 'Machine',
target: 'Mixer',
},
{
source: 'Machine',
target: 'Metal Lathe',
},
{
source: 'Metal Lathe',
target: 'Milling',
},
{
source: 'Material',
target: 'Masonite',
},
{
source: 'Material',
target: 'Marscapone',
},
{
source: 'Material',
target: 'Meat',
},
{
source: 'Masonite',
target: 'spearMint',
},
{
source: 'Masonite',
target: 'pepperMint',
},
{
source: 'Masonite',
target: 'test1',
},
{
source: 'pepperMint',
target: 'test3',
},
{
source: 'test1',
target: 'test4',
},
{
source: 'Marscapone',
target: 'Malty',
},
{
source: 'Marscapone',
target: 'Minty',
},
{
source: 'Meat',
target: 'Mutton',
},
{
source: 'Man Power',
target: 'Manager',
},
{
source: 'Man Power',
target: "Master's Student",
},
{
source: 'Man Power',
target: 'Magician',
},
{
source: 'Man Power',
target: 'Miner',
},
{
source: 'Man Power',
target: 'Magister',
},
{
source: 'Man Power',
target: 'Massage Artist',
},
{
source: 'Magister',
target: 'Malpractice',
},
{
source: 'Massage Artist',
target: 'Masseur',
},
{
source: 'Massage Artist',
target: 'Masseuse',
},
{
source: 'Measurement',
target: 'Malleability',
},
{
source: 'Milieu',
target: 'Marine',
},
],
},
edge: {
type: 'polyline',
style: {
lineWidth: 3,
},
},
behaviors: ['drag-canvas'],
});
graph.render();
```
## Real Case
```js | ob { inject: true }
import { Graph, treeToGraphData } from '@antv/g6';
const data = {
id: 'Quality',
children: [
{
id: 'Machine',
children: [{ id: 'Mill' }, { id: 'Mixer' }, { id: 'Metal Lathe', children: [{ id: 'Milling' }] }],
},
{ id: 'Method' },
{
id: 'Material',
children: [
{
id: 'Masonite',
children: [
{ id: 'spearMint' },
{ id: 'pepperMint', children: [{ id: 'test3' }] },
{ id: 'test1', children: [{ id: 'test4' }] },
],
},
{
id: 'Marscapone',
children: [{ id: 'Malty' }, { id: 'Minty' }],
},
{ id: 'Meat', children: [{ id: 'Mutton' }] },
],
},
{
id: 'Man Power',
children: [
{ id: 'Manager' },
{ id: "Master's Student" },
{ id: 'Magician' },
{ id: 'Miner' },
{ id: 'Magister', children: [{ id: 'Malpractice' }] },
{
id: 'Massage Artist',
children: [{ id: 'Masseur' }, { id: 'Masseuse' }],
},
],
},
{
id: 'Measurement',
children: [{ id: 'Malleability' }],
},
{
id: 'Milieu',
children: [{ id: 'Marine' }],
},
],
};
export const layoutFishbone = async (context) => {
const graph = new Graph({
...context,
container: 'container',
autoFit: 'view',
data: treeToGraphData(data),
node: {
type: 'rect',
style: {
size: [32, 32],
// fill: () => randomColor(),
label: false,
labelFill: '#262626',
labelFontFamily: 'Gill Sans',
labelMaxLines: 2,
labelMaxWidth: '100%',
labelPlacement: 'center',
labelText: (d) => d.id,
labelWordWrap: true,
},
},
edge: {
type: 'polyline',
style: {
lineWidth: 3,
},
},
layout: {
type: 'fishbone',
vGap: 48,
hGap: 48,
direction: 'RL',
},
behaviors: ['drag-canvas', 'zoom-canvas', 'drag-element'],
animation: false,
});
await graph.render();
layoutFishbone.form = (panel) => {
const config = {
type: 'fishbone',
direction: 'RL',
};
return [
panel
.add(config, 'direction', ['LR', 'RL'])
.name('Direction')
.onChange((value) => {
graph.setLayout((prev) => ({ ...prev, direction: value }));
graph.render();
}),
];
};
return graph;
};
layoutFishbone();
```
- [Fishbone Layout](/en/examples/layout/fishbone/#basic)
Layout Skill
packages/site/docs/manual/layout/Fishbone.zh.md anthropic-skill ~3,038 tokens---
title: 鱼骨布局 Fishbone
order: 11
---
## 概述
鱼骨布局是一种专门用于表示层次结构数据的图形布局方式。它通过模拟鱼骨的形状,将数据节点按照层次结构排列,使得数据的层次关系更加清晰直观。鱼骨布局特别适用于需要展示因果关系、层次结构或分类信息的数据集。
## 使用场景
- 需要展示层次结构数据,如组织结构、分类体系
- 需要展示问题分析过程,如故障分析、质量分析
- 需要展示决策过程,如决策树、影响因素分析
## 在线体验
<embed src="@/common/api/layout/fishbone.md"></embed>
## 基本用法
```js
const graph = new Graph({
layout: {
type: 'fishbone',
direction: 'LR',
hGap: 50,
vGap: 50,
getRibSep: () => 60,
},
});
```
## 配置项
| 属性 | 描述 | 类型 | 默认值 | 必选 |
| ---------------------- | ---------------------------------------------------------- | -------------------------------------------------------------------------------------------------------------------------------------- | -------- | ---- |
| type | 布局类型 | `fishbone` | - | ✓ |
| direction | 排布方向,`RL` 从右到左,鱼头在右;`LR` 从左到右,鱼头在左 | `RL` \| `LR` | `RL` | |
| hGap | 水平间距 | number | - | |
| vGap | 垂直间距 | number | - | |
| getRibSep | 获取鱼骨间距 | (node: NodeData) => number | () => 60 | |
| width | 布局宽度 | number | - | |
| height | 布局高度 | number | - | |
| nodeSize | 节点大小 | number \| [number, number] \| [number, number, number] \| ((node: NodeData) => number \| [number, number] \| [number, number, number]) | - | |
| isLayoutInvisibleNodes | 不可见节点是否参与布局,当 preLayout 为 true 时生效 | boolean | - | |
| nodeFilter | 参与该布局的节点 | (node: NodeData) => boolean | - | |
| preLayout | 使用前布局,在初始化元素前计算布局,不适用于流水线布局 | boolean | - | |
## 代码示例
### 基础用法
最简单的配置方式:
```js
import { Graph, treeToGraphData } from '@antv/g6';
const graph = new Graph({
layout: {
type: 'fishbone',
},
autoFit: 'view',
data: treeToGraphData({
nodes: [
{ id: 'root', data: { label: 'Root' } },
{ id: 'child1', data: { label: 'Child 1' } },
{ id: 'child2', data: { label: 'Child 2' } },
{ id: 'child3', data: { label: 'Child 3' } },
],
edges: [
{ id: 'e1', source: 'root', target: 'child1' },
{ id: 'e2', source: 'root', target: 'child2' },
{ id: 'e3', source: 'root', target: 'child3' },
],
}),
edge: {
type: 'polyline',
style: {
lineWidth: 3,
},
},
behaviors: ['drag-canvas'],
});
```
效果如下:
```js | ob { pin: false, inject: true }
import { Graph } from '@antv/g6';
const graph = new Graph({
container: 'container',
width: 600,
height: 400,
layout: {
type: 'fishbone',
},
autoFit: 'view',
data: {
nodes: [
{
id: 'Quality',
depth: 0,
children: ['Machine', 'Method', 'Material', 'Man Power', 'Measurement', 'Milieu'],
},
{
id: 'Machine',
depth: 1,
children: ['Mill', 'Mixer', 'Metal Lathe'],
},
{
id: 'Mill',
depth: 2,
},
{
id: 'Mixer',
depth: 2,
},
{
id: 'Metal Lathe',
depth: 2,
children: ['Milling'],
},
{
id: 'Milling',
depth: 3,
},
{
id: 'Method',
depth: 1,
},
{
id: 'Material',
depth: 1,
children: ['Masonite', 'Marscapone', 'Meat'],
},
{
id: 'Masonite',
depth: 2,
children: ['spearMint', 'pepperMint', 'test1'],
},
{
id: 'spearMint',
depth: 3,
},
{
id: 'pepperMint',
depth: 3,
children: ['test3'],
},
{
id: 'test3',
depth: 4,
},
{
id: 'test1',
depth: 3,
children: ['test4'],
},
{
id: 'test4',
depth: 4,
},
{
id: 'Marscapone',
depth: 2,
children: ['Malty', 'Minty'],
},
{
id: 'Malty',
depth: 3,
},
{
id: 'Minty',
depth: 3,
},
{
id: 'Meat',
depth: 2,
children: ['Mutton'],
},
{
id: 'Mutton',
depth: 3,
},
{
id: 'Man Power',
depth: 1,
children: ['Manager', "Master's Student", 'Magician', 'Miner', 'Magister', 'Massage Artist'],
},
{
id: 'Manager',
depth: 2,
},
{
id: "Master's Student",
depth: 2,
},
{
id: 'Magician',
depth: 2,
},
{
id: 'Miner',
depth: 2,
},
{
id: 'Magister',
depth: 2,
children: ['Malpractice'],
},
{
id: 'Malpractice',
depth: 3,
},
{
id: 'Massage Artist',
depth: 2,
children: ['Masseur', 'Masseuse'],
},
{
id: 'Masseur',
depth: 3,
},
{
id: 'Masseuse',
depth: 3,
},
{
id: 'Measurement',
depth: 1,
children: ['Malleability'],
},
{
id: 'Malleability',
depth: 2,
},
{
id: 'Milieu',
depth: 1,
children: ['Marine'],
},
{
id: 'Marine',
depth: 2,
},
],
edges: [
{
source: 'Quality',
target: 'Machine',
},
{
source: 'Quality',
target: 'Method',
},
{
source: 'Quality',
target: 'Material',
},
{
source: 'Quality',
target: 'Man Power',
},
{
source: 'Quality',
target: 'Measurement',
},
{
source: 'Quality',
target: 'Milieu',
},
{
source: 'Machine',
target: 'Mill',
},
{
source: 'Machine',
target: 'Mixer',
},
{
source: 'Machine',
target: 'Metal Lathe',
},
{
source: 'Metal Lathe',
target: 'Milling',
},
{
source: 'Material',
target: 'Masonite',
},
{
source: 'Material',
target: 'Marscapone',
},
{
source: 'Material',
target: 'Meat',
},
{
source: 'Masonite',
target: 'spearMint',
},
{
source: 'Masonite',
target: 'pepperMint',
},
{
source: 'Masonite',
target: 'test1',
},
{
source: 'pepperMint',
target: 'test3',
},
{
source: 'test1',
target: 'test4',
},
{
source: 'Marscapone',
target: 'Malty',
},
{
source: 'Marscapone',
target: 'Minty',
},
{
source: 'Meat',
target: 'Mutton',
},
{
source: 'Man Power',
target: 'Manager',
},
{
source: 'Man Power',
target: "Master's Student",
},
{
source: 'Man Power',
target: 'Magician',
},
{
source: 'Man Power',
target: 'Miner',
},
{
source: 'Man Power',
target: 'Magister',
},
{
source: 'Man Power',
target: 'Massage Artist',
},
{
source: 'Magister',
target: 'Malpractice',
},
{
source: 'Massage Artist',
target: 'Masseur',
},
{
source: 'Massage Artist',
target: 'Masseuse',
},
{
source: 'Measurement',
target: 'Malleability',
},
{
source: 'Milieu',
target: 'Marine',
},
],
},
edge: {
type: 'polyline',
style: {
lineWidth: 3,
},
},
behaviors: ['drag-canvas'],
});
graph.render();
```
## 实际案例
```js | ob { inject: true }
import { Graph, treeToGraphData } from '@antv/g6';
const data = {
id: 'Quality',
children: [
{
id: 'Machine',
children: [{ id: 'Mill' }, { id: 'Mixer' }, { id: 'Metal Lathe', children: [{ id: 'Milling' }] }],
},
{ id: 'Method' },
{
id: 'Material',
children: [
{
id: 'Masonite',
children: [
{ id: 'spearMint' },
{ id: 'pepperMint', children: [{ id: 'test3' }] },
{ id: 'test1', children: [{ id: 'test4' }] },
],
},
{
id: 'Marscapone',
children: [{ id: 'Malty' }, { id: 'Minty' }],
},
{ id: 'Meat', children: [{ id: 'Mutton' }] },
],
},
{
id: 'Man Power',
children: [
{ id: 'Manager' },
{ id: "Master's Student" },
{ id: 'Magician' },
{ id: 'Miner' },
{ id: 'Magister', children: [{ id: 'Malpractice' }] },
{
id: 'Massage Artist',
children: [{ id: 'Masseur' }, { id: 'Masseuse' }],
},
],
},
{
id: 'Measurement',
children: [{ id: 'Malleability' }],
},
{
id: 'Milieu',
children: [{ id: 'Marine' }],
},
],
};
export const layoutFishbone = async (context) => {
const graph = new Graph({
...context,
container: 'container',
autoFit: 'view',
data: treeToGraphData(data),
node: {
type: 'rect',
style: {
size: [32, 32],
// fill: () => randomColor(),
label: false,
labelFill: '#262626',
labelFontFamily: 'Gill Sans',
labelMaxLines: 2,
labelMaxWidth: '100%',
labelPlacement: 'center',
labelText: (d) => d.id,
labelWordWrap: true,
},
},
edge: {
type: 'polyline',
style: {
lineWidth: 3,
},
},
layout: {
type: 'fishbone',
vGap: 48,
hGap: 48,
direction: 'RL',
},
behaviors: ['drag-canvas', 'zoom-canvas', 'drag-element'],
animation: false,
});
await graph.render();
layoutFishbone.form = (panel) => {
const config = {
type: 'fishbone',
direction: 'RL',
};
return [
panel
.add(config, 'direction', ['LR', 'RL'])
.name('Direction')
.onChange((value) => {
graph.setLayout((prev) => ({ ...prev, direction: value }));
graph.render();
}),
];
};
return graph;
};
layoutFishbone();
```
- [Fishbone布局](/examples/layout/fishbone/#basic)
Layout Skill
packages/site/docs/manual/layout/ForceAtlas2Layout.en.md anthropic-skill ~2,578 tokens---
title: ForceAtlas2 Force-directed Layout
order: 12
---
## Overview
ForceAtlas2 is a force-directed layout algorithm that optimizes node positions by simulating forces in a physical system. This layout is especially suitable for visualizing large-scale network data, effectively revealing relationships and cluster structures among nodes.
## Use Cases
- Social network analysis: Display user relationship networks, with node degree reflecting user influence
- Knowledge graphs: Show associations between concepts, discover knowledge domains through clustering
- System architecture diagrams: Show dependencies between system components, highlight core components via hub mode
## Online Demo
<embed src="@/common/api/layout/force-atlas2.md"></embed>
## Basic Usage
```js
const graph = new Graph({
layout: {
type: 'force-atlas2',
preventOverlap: true,
kr: 20,
center: [250, 250],
},
});
```
## Options
| Property | Description | Type | Default | Required |
| -------------- | ----------------------------------------------------------------------------------------------------------------------------------------------------------------------------- | ----------------------------------- | -------- | -------- |
| type | Layout type, must be `force-atlas2` | `force-atlas2` | - | ✓ |
| maxIteration | Maximum number of iterations | number | 500 | |
| minMovement | Convergence threshold | number | 0.4 | |
| barnesHut | Whether to enable quadtree acceleration. When enabled, improves performance for large graphs but may affect layout quality. By default, enabled if node count > 250. | boolean | - | |
| dissuadeHubs | Whether to enable hub mode. If true, nodes with higher in-degree are more likely to be placed at the center than those with high out-degree | boolean | false | |
| height | Layout height. Defaults to container height | number | - | |
| kg | Gravity coefficient. The larger the value, the more concentrated the layout is at the center | number | 1 | |
| kr | Repulsion coefficient. Adjusts the compactness of the layout. The larger the value, the looser the layout | number | 5 | |
| ks | Controls the speed of node movement during iteration | number | 0.1 | |
| ksmax | Maximum node movement speed during iteration | number | 10 | |
| mode | Clustering mode. In `linlog` mode, clusters are more compact | `normal` \| `linlog` | `normal` | |
| nodeSize | Node size (diameter). Used for repulsion calculation when `preventOverlap` is enabled. If not set, uses `data.size` in node data | Size \| ((node?: Node) => Size) | - | |
| nodeSpacing | Spacing between nodes | number \| ((node?: Node) => number) | - | |
| onTick | Callback for each iteration | (data: LayoutMapping) => void | - | |
| preventOverlap | Whether to prevent node overlap. When enabled, layout considers node size to avoid overlap. Node size is specified by `nodeSize` or `data.size` in node data | boolean | false | |
| prune | Whether to enable auto-pruning. By default, enabled if node count > 100. Pruning speeds up convergence but may reduce layout quality. Set to false to disable auto-activation | boolean | - | |
| tao | Tolerance for stopping oscillation when layout is near convergence | number | 0.1 | |
| width | Layout width. Defaults to container width | number | - | |
| center | Layout center, format [x, y]. Each node is attracted to this point, gravity controlled by `kg`. If not set, uses canvas center | [number, number] | - | |
## Code Example
### Basic Usage
```js
import { Graph } from '@antv/g6';
const graph = new Graph({
layout: {
type: 'force-atlas2',
preventOverlap: true,
kr: 20,
},
autoFit: 'view',
data: {
nodes: [
{ id: 'node1' },
{ id: 'node2' },
{ id: 'node3' },
{ id: 'node4' },
{ id: 'node5' },
{ id: 'node6' },
{ id: 'node7' },
{ id: 'node8' },
{ id: 'node9' },
{ id: 'node10' },
{ id: 'node11' },
{ id: 'node12' },
{ id: 'node13' },
{ id: 'node14' },
{ id: 'node15' },
],
edges: [
{ source: 'node1', target: 'node2' },
{ source: 'node2', target: 'node3' },
{ source: 'node3', target: 'node4' },
{ source: 'node4', target: 'node5' },
{ source: 'node5', target: 'node6' },
{ source: 'node6', target: 'node7' },
{ source: 'node7', target: 'node8' },
{ source: 'node8', target: 'node9' },
{ source: 'node9', target: 'node10' },
{ source: 'node10', target: 'node11' },
{ source: 'node11', target: 'node12' },
{ source: 'node12', target: 'node13' },
{ source: 'node13', target: 'node14' },
{ source: 'node14', target: 'node15' },
{ source: 'node15', target: 'node1' },
{ source: 'node1', target: 'node8' },
{ source: 'node2', target: 'node9' },
{ source: 'node3', target: 'node10' },
{ source: 'node4', target: 'node11' },
{ source: 'node5', target: 'node12' },
{ source: 'node6', target: 'node13' },
{ source: 'node7', target: 'node14' },
],
},
behaviors: ['drag-canvas', 'zoom-canvas', 'drag-element'],
});
```
Result:
```js | ob { pin: false, inject: true }
import { Graph } from '@antv/g6';
const graph = new Graph({
container: 'container',
width: 400,
height: 300,
layout: {
type: 'force-atlas2',
preventOverlap: true,
kr: 20,
},
data: {
nodes: [
{ id: 'node1' },
{ id: 'node2' },
{ id: 'node3' },
{ id: 'node4' },
{ id: 'node5' },
{ id: 'node6' },
{ id: 'node7' },
{ id: 'node8' },
{ id: 'node9' },
{ id: 'node10' },
{ id: 'node11' },
{ id: 'node12' },
{ id: 'node13' },
{ id: 'node14' },
{ id: 'node15' },
],
edges: [
{ source: 'node1', target: 'node2' },
{ source: 'node2', target: 'node3' },
{ source: 'node3', target: 'node4' },
{ source: 'node4', target: 'node5' },
{ source: 'node5', target: 'node6' },
{ source: 'node6', target: 'node7' },
{ source: 'node7', target: 'node8' },
{ source: 'node8', target: 'node9' },
{ source: 'node9', target: 'node10' },
{ source: 'node10', target: 'node11' },
{ source: 'node11', target: 'node12' },
{ source: 'node12', target: 'node13' },
{ source: 'node13', target: 'node14' },
{ source: 'node14', target: 'node15' },
{ source: 'node15', target: 'node1' },
{ source: 'node1', target: 'node8' },
{ source: 'node2', target: 'node9' },
{ source: 'node3', target: 'node10' },
{ source: 'node4', target: 'node11' },
{ source: 'node5', target: 'node12' },
{ source: 'node6', target: 'node13' },
{ source: 'node7', target: 'node14' },
],
},
behaviors: ['drag-canvas', 'zoom-canvas', 'drag-element'],
});
graph.render();
```
## Real Example
```js | ob { inject: true }
import { Graph } from '@antv/g6';
fetch('https://gw.alipayobjects.com/os/antvdemo/assets/data/relations.json')
.then((res) => res.json())
.then((data) => {
const graph = new Graph({
container: 'container',
data,
autoFit: 'view',
layout: {
type: 'force-atlas2',
preventOverlap: true,
kr: 20,
center: [250, 250],
},
behaviors: ['zoom-canvas', 'drag-canvas'],
autoResize: true,
zoomRange: [0.1, 5],
});
graph.render();
});
```
- [ForceAtlas2 Layout](/en/examples/layout/force-directed/#atlas2)
Layout Skill
packages/site/docs/manual/layout/ForceAtlas2Layout.zh.md anthropic-skill ~2,266 tokens---
title: ForceAtlas2 力导向布局
order: 12
---
## 概述
ForceAtlas2 是一种基于力导向的布局算法,它通过模拟物理系统中的力来优化节点位置。该布局特别适用于大规模网络数据的可视化,能够有效地展示节点之间的关系和聚类结构。
## 使用场景
- 社交网络分析:展示用户之间的关系网络,通过节点度数反映用户影响力
- 知识图谱:展示概念之间的关联关系,通过聚类效果发现知识领域
- 系统架构图:展示系统组件之间的依赖关系,通过 hub 模式突出核心组件
## 在线体验
<embed src="@/common/api/layout/force-atlas2.md"></embed>
## 基本用法
```js
const graph = new Graph({
layout: {
type: 'force-atlas2',
preventOverlap: true,
kr: 20,
center: [250, 250],
},
});
```
## 配置项
| 属性 | 描述 | 类型 | 默认值 | 必选 |
| -------------- | -------------------------------------------------------------------------------------------------------------------------------------------------------------------- | ----------------------------------- | -------- | ---- |
| type | 布局类型,必须为 `force-atlas2` | `force-atlas2` | - | ✓ |
| maxIteration | 最大迭代次数 | number | 500 | |
| minMovement | 收敛阈值 | number | 0.4 | |
| barnesHut | 是否开启四叉树加速,开启后可以提升大规模图的布局性能,但可能会影响布局质量。默认情况下为 undefined,当节点数量大于 250 时它将会被激活。设置为 false 则不会自动被激活 | boolean | - | |
| dissuadeHubs | 是否开启 hub 模式。若为 true,相比与出度大的节点,入度大的节点将会有更高的优先级被放置在中心位置 | boolean | false | |
| height | 布局高度,默认使用容器高度 | number | - | |
| kg | 重力系数,`kg` 越大,布局越聚集在中心 | number | 1 | |
| kr | 斥力系数,可用于调整布局的紧凑程度。kr 越大,布局越松散 | number | 5 | |
| ks | 控制迭代过程中,节点移动的速度 | number | 0.1 | |
| ksmax | 迭代过程中,最大的节点移动的速度上限 | number | 10 | |
| mode | 聚类模式,`linlog` 模式下,聚类将更加紧凑 | `normal` \| `linlog` | `normal` | |
| nodeSize | 节点大小(直径)。当开启 `preventOverlap` 时,用于计算节点之间的斥力。如果不设置,则使用节点数据中的 size 属性 | Size \| ((node?: Node) => Size) | - | |
| nodeSpacing | 节点间距 | number \| ((node?: Node) => number) | - | |
| onTick | 每一次迭代的回调函数 | (data: LayoutMapping) => void | - | |
| preventOverlap | 是否防止节点重叠。开启后,布局会考虑节点大小,避免节点重叠 | boolean | false | |
| prune | 是否开启自动剪枝模式。默认情况下为 undefined,当节点数量大于 100 时它将会被激活。注意,剪枝能够提高收敛速度,但可能会降低图的布局质量。设置为 false 则不会自动被激活 | boolean | - | |
| tao | 迭代接近收敛时停止震荡的容忍度 | number | 0.1 | |
| width | 布局宽度,默认使用容器宽度 | number | - | |
| center | 布局中心点,用于指定重力的中心,格式为 [x, y]。每个节点都会受到一个指向该中心点的重力,重力大小由 `kg` 参数控制。如果不设置,则使用画布中心点 | [number, number] | - | |
## 代码示例
### 基础用法
```js
import { Graph } from '@antv/g6';
const graph = new Graph({
layout: {
type: 'force-atlas2',
preventOverlap: true,
kr: 20,
},
autoFit: 'view',
data: {
nodes: [
{ id: 'node1' },
{ id: 'node2' },
{ id: 'node3' },
{ id: 'node4' },
{ id: 'node5' },
{ id: 'node6' },
{ id: 'node7' },
{ id: 'node8' },
{ id: 'node9' },
{ id: 'node10' },
{ id: 'node11' },
{ id: 'node12' },
{ id: 'node13' },
{ id: 'node14' },
{ id: 'node15' },
],
edges: [
{ source: 'node1', target: 'node2' },
{ source: 'node2', target: 'node3' },
{ source: 'node3', target: 'node4' },
{ source: 'node4', target: 'node5' },
{ source: 'node5', target: 'node6' },
{ source: 'node6', target: 'node7' },
{ source: 'node7', target: 'node8' },
{ source: 'node8', target: 'node9' },
{ source: 'node9', target: 'node10' },
{ source: 'node10', target: 'node11' },
{ source: 'node11', target: 'node12' },
{ source: 'node12', target: 'node13' },
{ source: 'node13', target: 'node14' },
{ source: 'node14', target: 'node15' },
{ source: 'node15', target: 'node1' },
{ source: 'node1', target: 'node8' },
{ source: 'node2', target: 'node9' },
{ source: 'node3', target: 'node10' },
{ source: 'node4', target: 'node11' },
{ source: 'node5', target: 'node12' },
{ source: 'node6', target: 'node13' },
{ source: 'node7', target: 'node14' },
],
},
behaviors: ['drag-canvas', 'zoom-canvas', 'drag-element'],
});
```
效果如下:
```js | ob { pin: false, inject: true }
import { Graph } from '@antv/g6';
const graph = new Graph({
container: 'container',
width: 400,
height: 300,
layout: {
type: 'force-atlas2',
preventOverlap: true,
kr: 20,
},
data: {
nodes: [
{ id: 'node1' },
{ id: 'node2' },
{ id: 'node3' },
{ id: 'node4' },
{ id: 'node5' },
{ id: 'node6' },
{ id: 'node7' },
{ id: 'node8' },
{ id: 'node9' },
{ id: 'node10' },
{ id: 'node11' },
{ id: 'node12' },
{ id: 'node13' },
{ id: 'node14' },
{ id: 'node15' },
],
edges: [
{ source: 'node1', target: 'node2' },
{ source: 'node2', target: 'node3' },
{ source: 'node3', target: 'node4' },
{ source: 'node4', target: 'node5' },
{ source: 'node5', target: 'node6' },
{ source: 'node6', target: 'node7' },
{ source: 'node7', target: 'node8' },
{ source: 'node8', target: 'node9' },
{ source: 'node9', target: 'node10' },
{ source: 'node10', target: 'node11' },
{ source: 'node11', target: 'node12' },
{ source: 'node12', target: 'node13' },
{ source: 'node13', target: 'node14' },
{ source: 'node14', target: 'node15' },
{ source: 'node15', target: 'node1' },
{ source: 'node1', target: 'node8' },
{ source: 'node2', target: 'node9' },
{ source: 'node3', target: 'node10' },
{ source: 'node4', target: 'node11' },
{ source: 'node5', target: 'node12' },
{ source: 'node6', target: 'node13' },
{ source: 'node7', target: 'node14' },
],
},
behaviors: ['drag-canvas', 'zoom-canvas', 'drag-element'],
});
graph.render();
```
## 实际案例
```js | ob { inject: true }
import { Graph } from '@antv/g6';
fetch('https://gw.alipayobjects.com/os/antvdemo/assets/data/relations.json')
.then((res) => res.json())
.then((data) => {
const graph = new Graph({
container: 'container',
data,
autoFit: 'view',
layout: {
type: 'force-atlas2',
preventOverlap: true,
kr: 20,
center: [250, 250],
},
behaviors: ['zoom-canvas', 'drag-canvas'],
autoResize: true,
zoomRange: [0.1, 5],
});
graph.render();
});
```
- [ForceAtlas2布局](/examples/layout/force-directed/#atlas2)
Layout Skill
packages/site/docs/manual/layout/ForceLayout.en.md anthropic-skill ~5,594 tokens---
title: Force-directed Layout
order: 13
---
## Overview
Force-directed layout is a graph layout algorithm based on physical simulation that determines node positions by simulating attraction and repulsion forces between nodes. This layout is particularly suitable for displaying complex relationship networks, such as social networks and knowledge graphs.
The force-directed layout automatically calculates and adjusts node positions to maintain appropriate distances between connected nodes while minimizing edge crossings. During the layout process, it simulates a physical system where nodes repel each other like charged particles, and edges connect nodes like springs.
Key features of force-directed layout include:
1. **Automatic Arrangement**: No need to manually set node positions, the system automatically finds suitable positions
2. **Real-time Adjustment**: When you drag a node, other nodes will adjust their positions in real-time
3. **Flexible Configuration**:
- Can adjust attraction and repulsion forces between nodes
- Can set edge lengths
- Can prevent node overlap
4. **Animation Effects**: Smooth animations during node movement make changes more natural
<img src='https://mdn.alipayobjects.com/huamei_4greni/afts/img/pdZUQIReZ_gAAAAAAAAAAAAADpdRAQFr/original' alt='Force-directed Layout Example'/>
## Core Concepts
### Basic Principles of Force-directed Layout
Force-directed layout is a graph layout algorithm based on physical simulation that models nodes and edges as a physical system:
- Nodes are treated as physical particles
- Edges are treated as springs
- The entire system reaches its lowest energy state through physical simulation
### Detailed Core Forces
#### Node Repulsion
- **Physical Model**: Coulomb's Law
- **Function**: Prevents node overlap and ensures more uniform node distribution, where `factor` and `coulombDisScale` control the overall strength and range of repulsion.
- **Formula**:
<img src='https://mdn.alipayobjects.com/huamei_4greni/afts/img/7udvQ5K8VvMAAAAAAAAAAAAADpdRAQFr/original' alt='Repulsion Force'/>
- k: Repulsion coefficient (`factor` / `coulombDisScale²`)
- q1,q2: Node strength (`nodeStrength`)
- r: Distance between nodes
#### Edge Attraction
- **Physical Model**: Hooke's Law
- **Function**: Simulates edge tension, moving nodes along edge directions, where `edgeStrength` and `linkDistance` control edge "stiffness" and length.
- **Formula**:
<img src='https://mdn.alipayobjects.com/huamei_4greni/afts/img/WY15QYfpMSAAAAAAAAAAAAAADpdRAQFr/original' alt='Edge Attraction'/>
- ka: Edge attraction strength (`edgeStrength`)
- L: Edge length (`linkDistance`)
- r: Actual edge length
#### Centripetal Force
- **Physical Model**: Newton's Universal Law of Gravitation
- **Function**: Attracts nodes toward the canvas center or cluster centers, where `gravity` and `center` control gravity strength and center point position
- **Formula**:
<img src='https://mdn.alipayobjects.com/huamei_4greni/afts/img/R-26R4Zc09kAAAAAQDAAAAgADpdRAQFr/original' alt='Centripetal Force'/>
- G: Gravitational constant (`gravity`)
- xc: Center point coordinates (`center`)
- mass: Node mass (`nodeSize`)
#### Interaction of Three Forces
- **Physical Model**: Force interactions, generating acceleration
- **Function**: Repulsion, edge attraction, and centripetal force work together, affecting node movement through acceleration superposition, ultimately reaching the lowest energy state.
- **Formula**:
<img src='https://mdn.alipayobjects.com/huamei_4greni/afts/img/R-26R4Zc09kAAAAAQDAAAAgADpdRAQFr/original' alt='Force Interactions'/>
### Physical System
#### Node Velocity Formula
- **Formula**:
<img src='https://mdn.alipayobjects.com/huamei_4greni/afts/img/4Nk0Q44tWGIAAAAAAAAAAAAADpdRAQFr/original' alt='Node Velocity Formula'/>
- v: Velocity
- a: Acceleration
- dt: Time step (`interval`)
- damping: Damping coefficient (`damping`)
- **Function**:
1. Controls node movement stability
2. Damping coefficient prevents system oscillation
3. Time step affects displacement per iteration
#### Node Position Formula
- **Formula**:
<img src='https://mdn.alipayobjects.com/huamei_4greni/afts/img/orF2RoAlHwAAAAAAAAAAAAAADpdRAQFr/original' alt='Node Position Formula'/>
- x: Node position
- v: Node velocity
- dt: Time step (`interval`)
- **Function**:
1. Updates node position based on velocity
2. Ensures motion continuity
3. Prevents node overlap through `preventOverlap`
#### Cluster Center Calculation
- **Formula**:
<img src='https://mdn.alipayobjects.com/huamei_4greni/afts/img/2jc-TrgcG20AAAAAQDAAAAgADpdRAQFr/original' alt='Cluster Center Calculation'/>
- n: Number of nodes in cluster
- (xi,yi): Position of each node
- **Function**:
1. Calculates cluster center
2. Centripetal force pulls nodes toward their cluster center
3. Cluster center can change dynamically
#### Cluster Strength Calculation
- **Formula**:
<img src='https://mdn.alipayobjects.com/huamei_4greni/afts/img/sVEtTLyM3rwAAAAAAAAAAAAADpdRAQFr/original' alt='Cluster Strength Calculation'/>
- s: Cluster strength (`clusterNodeStrength`)
- xc: Cluster center
- **Function**:
1. Controls cluster compactness
2. Higher cluster strength means tighter clusters
3. Can be dynamically adjusted based on node properties
#### Mass Effect on Forces
- **Formula**:
<img src='https://mdn.alipayobjects.com/huamei_4greni/afts/img/5ckVQ6gHQygAAAAAQBAAAAgADpdRAQFr/original' alt='Mass Effect on Forces'/>
- a: Acceleration
- F: Force (repulsion, edge attraction, centripetal force)
- mass: Node mass
- **Function**:
1. Nodes with larger mass move less
2. Nodes with smaller mass move more
3. Mass calculation can be customized through `getMass`
#### Energy Calculation
- **Formula**:
<img src='https://mdn.alipayobjects.com/huamei_4greni/afts/img/M84ERKphqf0AAAAAAAAAAAAADpdRAQFr/original' alt='Energy Calculation'/>
- m: Node mass
- v: Node velocity
- **Function**:
1. Monitors layout convergence
2. System stabilizes when energy approaches zero
#### System Convergence Condition
- **Formula**:
<img src='https://mdn.alipayobjects.com/huamei_4greni/afts/img/oBHdRLKIEAcAAAAAQFAAAAgADpdRAQFr/original' alt='System Convergence Condition'/>
- **Function**:
1. Controls iteration count
2. Stops when movement is below threshold
3. Can choose between mean, maximum, or minimum through `distanceThresholdMode`
### Force Interaction Diagram
```mermaid
graph TD
A[Input] --> B[Initialize Parameters];
B --> C[Build Layout Calculation];
C --> D[Iterative Calculation];
D --> E{Converged?};
E -->|Yes| F[Output Layout];
E -->|No| G[Calculate Repulsion];
G --> H[Calculate Edge Attraction];
H --> I[Calculate Centripetal Force];
I --> J[Update Velocity];
J --> K[Update Position];
K --> D;
```
<img src='https://mdn.alipayobjects.com/huamei_4greni/afts/img/BOu7Rbuz4MoAAAAAQjAAAAgADpdRAQFr/original' alt='Force Simulation Diagram'/>
## Configuration Options
Based on the physical characteristics of force-directed layout, the following configuration options are available:
### Basic Configuration
| Property | Description | Default Value | Required |
| --------------------- | -------------------------------------------------------------------------------------------------------------------------------------------------------------------------------------------------------------------------------------------------- | ------------- | -------- |
| type | Layout type | `force` | ✓ |
| dimensions | Layout dimensions, 2 for 2D layout, 3 for 3D layout | 2 | |
| width | Layout width | Canvas width | |
| height | Layout height | Canvas height | |
| center | Layout center point | Graph center | |
| maxIteration | Maximum iteration count, if 0 will auto-adjust | 0 | |
| minMovement | Stop iteration when average movement distance is less than 0.4 | 0.4 | |
| distanceThresholdMode | Movement distance calculation mode: mean: stop when average movement distance is less than `minMovement`; max: stop when maximum movement distance is less than `minMovement`; min: stop when minimum movement distance is less than `minMovement` | `mean` | |
| maxDistance | Maximum distance | | |
### Force-related Configuration
#### Repulsion Configuration
| Property | Description | Default Value | Required |
| --------------- | --------------------------------------------------------------------------------------------------- | ------------- | -------- |
| nodeStrength | Node force, positive values represent attraction between nodes, negative values represent repulsion | 1000 | |
| factor | Repulsion coefficient, larger values mean stronger repulsion | 1 | |
| coulombDisScale | Coulomb coefficient, a factor for repulsion, larger values mean stronger repulsion between nodes | 0.005 | |
#### Edge Attraction Configuration
| Property | Description | Default Value | Required |
| ------------ | -------------------------------------------------------------------------------------------------------------- | ------------- | -------- |
| edgeStrength | Edge force (attraction) strength, fixed force or callback function to dynamically return different edge forces | 500 | |
| linkDistance | Edge length, fixed length or callback function to dynamically return different edge lengths | 200 | |
#### Centripetal Force Configuration
| Property | Description | Default Value | Required |
| ------------------ | -------------------------------------------------------------------------------------------------------------------------------------------------------------------------------------------------------------------------------------------------------------------- | ------------- | -------- |
| gravity | Center force strength, the force attracting all nodes to the center. Larger values mean more compact layout | 10 | |
| centripetalOptions | Centripetal force configuration, including center and strength for leaf nodes, isolated nodes, and other nodes. leaf: leaf node centripetal force; single: single node centripetal force; others: other node centripetal force; center: custom center point function | [0, 0] | |
#### Clustering Configuration
| Property | Description | Default Value | Required |
| ------------------- | ------------------------------------------------------------------------------------------------------------------------------------------------------------------------------------------------------------------------------------------------------------------------------------------------------------------------------------------------------------- | ------------- | -------- |
| clustering | Whether to cluster all nodes. If true, will use the field specified by nodeClusterBy in node data for clustering. centripetalOptions.single, centripetalOptions.leaf, and centripetalOptions.others will use the value returned by getClusterNodeStrength; leaf and centripetalOptions.center will use the average center of all nodes in the current cluster | `false` | |
| nodeClusterBy | Specifies the field name in node data for clustering. Takes effect when clustering is true. Automatically generates centripetalOptions, can be used with clusterNodeStrength | | |
| clusterNodeStrength | Used with clustering and nodeClusterBy to specify the strength of the cluster centripetal force | | |
| leafCluster | Whether to cluster leaf nodes. If true, centripetalOptions.single will be 100; centripetalOptions.leaf will use the value returned by getClusterNodeStrength; getClusterNodeStrength.center will return the average center of all leaf nodes | false | |
#### Performance and Optimization Configuration
| Property | Description | Default Value | Required |
| --------------- | ------------------------------------------------------------------------------------------------------------------------------------------------------------------------------------------------------------------------------------------------------------------------- | ------------- | -------- |
| damping | Damping coefficient, range [0, 1]. Larger values mean slower speed decrease | 0.9 | |
| maxSpeed | Maximum movement length per iteration | 200 | |
| interval | Controls the movement speed of each node per iteration | 0.02 | |
| preventOverlap | Whether to prevent overlap. Must be used with nodeSize or data.size in node data. Only when data.size is set in the data or nodeSize is configured in the layout with the same value as the node size in the graph, collision detection for node overlap can be performed | true | |
| nodeSize | Node size (diameter). Used for collision detection to prevent node overlap. Fixed size or callback function to dynamically return node size | | |
| nodeSpacing | Takes effect when preventOverlap is true. Minimum spacing between node edges to prevent overlap. Can be a callback to set different spacing for different nodes | | |
| collideStrength | Strength of anti-overlap force, range [0, 1] | 1 | |
#### Other Configuration
| Property | Description | Default Value | Required |
| --------- | ---------------------------------------------------------------------------------------------------------------------------------------------------------------------------------------- | ------------- | -------- |
| getMass | Callback for the mass of each node. The parameter is the node's internal data, and the return value is the mass | | |
| getCenter | Callback for the x, y, and strength of the centripetal force for each node. If not specified, no extra centripetal force is applied | | |
| onTick | Callback for each iteration | | |
| monitor | Callback for monitoring each iteration. energy indicates the convergence energy of the layout. May incur extra computation if configured; if not configured, no computation is performed | | |
## Code Examples
### Basic Usage
```js
const graph = new Graph({
container: 'container',
layout: {
type: 'force',
// Prevent node overlap
preventOverlap: true,
// Node size
nodeSize: 20,
// Layout width
width: 800,
// Layout height
height: 600,
},
});
```
### Preventing Node Overlap
```js
const graph = new Graph({
layout: {
type: 'force',
// Prevent node overlap
preventOverlap: true,
// Node size
nodeSize: 20,
},
});
```
### Force-directed Layout
This example demonstrates how to create a basic force-directed graph using force-directed layout.
```js
import { Graph, NodeEvent } from '@antv/g6';
const data = {
nodes: [
{ id: 'node1', label: 'Node 1', size: 30 },
{ id: 'node2', label: 'Node 2', size: 20 },
{ id: 'node3', label: 'Node 3', size: 20 },
{ id: 'node4', label: 'Node 4', size: 20 },
{ id: 'node5', label: 'Node 5', size: 30 },
{ id: 'node6', label: 'Node 6', size: 20 },
],
edges: [
{ source: 'node1', target: 'node2' },
{ source: 'node1', target: 'node3' },
{ source: 'node2', target: 'node4' },
{ source: 'node3', target: 'node4' },
{ source: 'node4', target: 'node5' },
{ source: 'node5', target: 'node6' },
],
};
const graph = new Graph({
container: 'container',
data,
autoFit: 'view',
modes: {
default: ['drag-canvas', 'zoom-canvas'],
},
layout: {
type: 'force',
// Prevent node overlap
preventOverlap: true,
// Node size
nodeSize: 20,
// Centripetal force
gravity: 0.9,
// Iteration count
iterations: 100,
},
node: {
style: {
size: (d) => d.size,
fill: '#9EC9FF',
stroke: '#69C8FF',
label: (d) => d.label,
labelPlacement: 'center',
labelFill: '#333',
},
},
edge: {
style: {
stroke: '#e2e2e2',
},
},
});
graph.on(NodeEvent.CLICK, async (e) => {
const nodeId = e.target.id;
graph.updateNodeData([{ id: nodeId, size: 200 }]);
await graph.render();
});
graph.render();
```
Key configuration explanations:
- `preventOverlap`: Enable node overlap detection
- `nodeSize`: Set node size
- `gravity`: Set node centripetal force
- `iterations`: Set layout calculation precision
You can also refer to [View Examples](https://g6.antv.antgroup.com/examples/layout/force-directed/#force) for more usage examples.
Layout Skill
packages/site/docs/manual/layout/ForceLayout.zh.md anthropic-skill ~3,622 tokens---
title: Force 力导向布局
order: 13
---
## 概述
力导向布局是一种基于物理模拟的图布局算法,它通过模拟节点间的引力和斥力来确定节点的位置。这种布局方式特别适合展示复杂的关系网络,如社交网络、知识图谱等。
力导向布局会自动计算并调整节点位置,使得相连的节点保持适当的距离,同时尽量减少边的交叉。布局过程中会模拟物理系统,节点会像带电粒子一样相互排斥,边则像弹簧一样连接节点。
力导向布局的主要特点包括:
1. **自动排列**:不需要手动设置节点位置,系统会自动找到合适的位置
2. **实时调整**:当你拖动某个节点时,其他节点会实时跟随调整位置
3. **灵活配置**:
- 可以调整节点间的吸引力和排斥力
- 可以设置边的长度
- 可以防止节点重叠
4. **动画效果**:节点移动时会有平滑的动画,让变化更自然
<img src='https://mdn.alipayobjects.com/huamei_4greni/afts/img/pdZUQIReZ_gAAAAAAAAAAAAADpdRAQFr/original' alt='力导向布局示例'/>
## 核心概念
### Force 力导向布局基本原理
力导向布局是一种基于物理模拟的图布局算法,它将图中的节点和边模拟为物理系统:
- 节点被视为物理粒子
- 边被视为弹簧
- 整个系统通过物理模拟达到能量最低状态
### 核心力详解
#### 斥力(Node Repulsion)
- **物理模型**:库伦定律(Coulomb's Law)
- **作用**:防止节点重叠,让节点分布更均匀,其中 `factor` 和 `coulombDisScale` 控制斥力的总体强度和范围。
- **公式**:
<img src='https://mdn.alipayobjects.com/huamei_4greni/afts/img/7udvQ5K8VvMAAAAAAAAAAAAADpdRAQFr/original' alt='斥力'/>
- k: 斥力系数(`factor` / `coulombDisScale²`)
- q1,q2: 节点强度(`nodeStrength`)
- r: 节点间距离
#### 边拉力(Edge Attraction)
- **物理模型**:胡克定律(Hooke's Law)
- **作用**:模拟边的拉力,使节点沿着边的方向移动,其中 `edgeStrength` 和 `linkDistance` 控制边的“硬度”和长度。
- **公式**:
<img src='https://mdn.alipayobjects.com/huamei_4greni/afts/img/WY15QYfpMSAAAAAAAAAAAAAADpdRAQFr/original' alt='边拉力'/>
- ka: 边拉力强度(`edgeStrength`)
- L: 边的长度(`linkDistance`)
- r: 实际边长度
#### 向心力(Gravity)
- **物理模型**:牛顿万有引力定律(Newton's Universal Law of Gravitational)
- **作用**:使节点向画布中心或者聚类中心聚集,其中 `gravity` 和 `center` 控制重力强度和中心点位置
- **公式**:
<img src='https://mdn.alipayobjects.com/huamei_4greni/afts/img/R-26R4Zc09kAAAAAQDAAAAgADpdRAQFr/original' alt='向心力'/>
- G: 万有引力常数(`gravity`)
- xc: 中心点坐标(`center`)
- mass: 节点质量(`nodeSize`)
#### 三种力的相互作用
- **物理模型**:力的相互作用,产生加速度
- **作用**:斥力、边拉力、向心力共同作用,通过加速度叠加影响节点运动,最终达到能量最低状态。
- **公式**:
<img src='https://mdn.alipayobjects.com/huamei_4greni/afts/img/R-26R4Zc09kAAAAAQDAAAAgADpdRAQFr/original' alt='力的相互作用'/>
### 物理系统
#### 节点运动速度公式
- **公式**:
<img src='https://mdn.alipayobjects.com/huamei_4greni/afts/img/4Nk0Q44tWGIAAAAAAAAAAAAADpdRAQFr/original' alt='节点运动速度公式'/>
- v: 速度
- a: 加速度
- dt: 时间步长(`interval`)
- damping: 阻尼系数(`damping`)
- **作用**:
1. 控制节点移动的稳定性
2. 阻尼系数防止系统震荡
3. 时间步长影响每次迭代的位移
#### 节点位置公式
- **公式**:
<img src='https://mdn.alipayobjects.com/huamei_4greni/afts/img/orF2RoAlHwAAAAAAAAAAAAAADpdRAQFr/original' alt='节点位置公式'/>
- x: 节点位置
- v: 节点速度
- dt: 时间步长(`interval`)
- **作用**:
1. 根据速度更新节点位置
2. 确保运动连续性
3. 通过 `preventOverlap` 防止节点重叠
#### 聚类中心计算
- **公式**:
<img src='https://mdn.alipayobjects.com/huamei_4greni/afts/img/2jc-TrgcG20AAAAAQDAAAAgADpdRAQFr/original' alt='聚类中心计算'/>
- n: 聚类内节点数量
- (xi,yi): 每个节点的位置
- **作用**:
1. 计算聚类中心
2. 向心力将节点拉向所属聚类中心
3. 聚类中心可动态变化
#### 聚类强度计算
- **公式**:
<img src='https://mdn.alipayobjects.com/huamei_4greni/afts/img/sVEtTLyM3rwAAAAAAAAAAAAADpdRAQFr/original' alt='聚类强度计算'/>
- s: 聚类强度(`clusterNodeStrength`)
- xc: 聚类中心
- **作用**:
1. 控制聚类的紧密程度
2. 聚类强度越大,聚类越紧凑
3. 可根据节点属性动态调整
#### 质量对力的影响
- **公式**:
<img src='https://mdn.alipayobjects.com/huamei_4greni/afts/img/5ckVQ6gHQygAAAAAQBAAAAgADpdRAQFr/original' alt='质量对力的影响'/>
- a: 加速度
- F: 力(斥力、边拉力、向心力)
- mass: 节点质量
- **作用**:
1. 质量大的节点移动较小
2. 质量小的节点移动较大
3. 通过 `getMass` 可自定义质量计算
#### 能量计算
- **公式**:
<img src='https://mdn.alipayobjects.com/huamei_4greni/afts/img/M84ERKphqf0AAAAAAAAAAAAADpdRAQFr/original' alt='能量计算'/>
- m: 节点质量
- v: 节点速度
- **作用**:
1. 监控布局收敛情况
2. 能量趋近于零时系统趋于稳定
#### 系统收敛条件
- **公式**:
<img src='https://mdn.alipayobjects.com/huamei_4greni/afts/img/oBHdRLKIEAcAAAAAQFAAAAgADpdRAQFr/original' alt='系统收敛条件'/>
- **作用**:
1. 控制迭代次数
2. 移动量小于阈值时停止
3. 通过 `distanceThresholdMode` 可选择平均值、最大值或最小值
### 力相互作用图
<img src='https://mdn.alipayobjects.com/huamei_4greni/afts/img/2lI1RruANXoAAAAAAAAAAAAADpdRAQFr/original' alt='力作用模拟图'/>
## 配置项
根据上述力导向布局的物理特性,有以下配置项:
### 基础配置
| 属性 | 描述 | 默认值 | 必选 |
| --------------------- | ------------------------------------------------------------------------------------------------------------------------------------------------------------ | -------- | ---- |
| type | 布局类型 | `force` | ✓ |
| dimensions | 布局维度,2表示2D布局,3表示3D布局 | 2 | |
| width | 布局宽度 | 画布宽度 | |
| height | 布局高度 | 画布高度 | |
| center | 布局的中心点 | 图中心 | |
| maxIteration | 最大迭代次数,若为 0 则将自动调整 | 0 | |
| minMovement | 当平均移动距离小于0.4时停止迭代 | 0.4 | |
| distanceThresholdMode | 移动距离的计算模式:mean: 平均移动距离小于 `minMovement` 时停止迭代;max: 最大移动距离小于时 `minMovement` 时停止迭代;min: 最小移动距离小于时 `minMovement` | `mean` | |
| maxDistance | 最大距离 | | |
### 力相关配置
#### 斥力配置
| 属性 | 描述 | 默认值 | 必选 |
| --------------- | ------------------------------------------------------------------ | ------ | ---- |
| nodeStrength | 节点作用力,正数代表节点之间的引力作用,负数代表节点之间的斥力作用 | 1000 | |
| factor | 斥力系数,数值越大,斥力越大 | 1 | |
| coulombDisScale | 库伦系数,斥力的一个系数,数字越大,节点之间的斥力越大 | 0.005 | |
#### 边拉力配置
| 属性 | 描述 | 默认值 | 必选 |
| ------------ | ------------------------------------------------------------------ | ------ | ---- |
| edgeStrength | 边的作用力(引力)大小,固定作用力或回调函数动态返回不同边的作用力 | 500 | |
| linkDistance | 边的长度,固定长度或回调函数动态返回不同边的长度 | 200 | |
#### 向心力配置
| 属性 | 描述 | 默认值 | 必选 |
| ------------------ | ------------------------------------------------------------------------------------------------------------------------------------------------------------ | ------ | ---- |
| gravity | 向中心力大小,指所有节点被吸引到 center 的力。数字越大,布局越紧凑 | 10 | |
| centripetalOptions | 向心力配置,包括叶子节点、离散点、其他节点的向心中心及向心力大小。leaf: 叶子节点向心力;single: 单点向心力;others: 其他节点向心力;center: 自定义中心点函数 | [0, 0] | |
#### 聚类配置
| 属性 | 描述 | 默认值 | 必选 |
| ------------------- | --------------------------------------------------------------------------------------------------------------------------------------------------------------------------------------------------------------------------------------------------------------------------------------------------------- | ------- | ---- |
| clustering | 是否需要全部节点聚类,若为 `true`,将使用 `nodeClusterBy` 配置的节点数据中的字段作为聚类依据。 `centripetalOptions.single`、`centripetalOptions.leaf`、`centripetalOptions.others` 将使用 `getClusterNodeStrength` 返回值;`leaf`、`centripetalOptions.center` 将使用当前节点所属聚类中所有节点的平均中心 | `false` | |
| nodeClusterBy | 指定节点数据中的字段名称作为节点聚类的依据,`clustering` 为 true 时生效,自动生成 `centripetalOptions`,可配合 `clusterNodeStrength` 使用 | | |
| clusterNodeStrength | 配合 `clustering` 和 `nodeClusterBy` 使用,指定聚类向心力的大小 | | |
| leafCluster | 是否需要叶子节点聚类,若为 `true`,则 `centripetalOptions.single` 将为 100;`centripetalOptions.leaf` 将使用 `getClusterNodeStrength` 返回值;`getClusterNodeStrength.center` 将为叶子节点返回当前所有叶子节点的平均中心 | false | |
#### 性能与优化配置
| 属性 | 描述 | 默认值 | 必选 |
| --------------- | ---------------------------------------------------------------------------------------------------------------------------------------------------------------------------------------------- | ------ | ---- |
| damping | 阻尼系数,取值范围 [0, 1]。数字越大,速度降低得越慢 | 0.9 | |
| maxSpeed | 一次迭代的最大移动长度 | 200 | |
| interval | 控制每个迭代节点的移动速度 | 0.02 | |
| preventOverlap | 是否防止重叠,必须配合下面属性 `nodeSize` 或节点数据中的 `data.size` 属性,只有在数据中设置了 `data.size` 或在该布局中配置了与当前图节点大小相同的 `nodeSize` 值,才能够进行节点重叠的碰撞检测 | true | |
| nodeSize | 节点大小(直径)。用于防止节点重叠时的碰撞检测,固定大小或者回调函数动态返回节点大小 | | |
| nodeSpacing | `preventOverlap` 为 `true` 时生效, 防止重叠时节点边缘间距的最小值。可以是回调函数, 为不同节点设置不同的最小间距 | | |
| collideStrength | 防止重叠的力强度,范围 [0, 1] | 1 | |
#### 其他配置
| 属性 | 描述 | 默认值 | 必选 |
| --------- | --------------------------------------------------------------------------------------------------------------------------------------------------------------------------------------------------- | ------ | ---- |
| getMass | 获取节点质量的回调函数,入参为节点内部流转数据,用于计算节点质量大小 | | |
| getCenter | 每个节点中心力的 x、y、强度的回调函数,若不指定,则没有额外中心力 | | |
| onTick | 每一次迭代的回调函数 | | |
| monitor | 每个迭代的监控信息回调,energy 表示布局的收敛能量。若配置可能带来额外的计算能量性能消耗,不配置则不计算。入参为迭代监控信息 `{ energy: number; nodes: Node[]; edges: Edge[]; iterations: number; }` | | |
## 代码示例
### 基础用法
```js
const graph = new Graph({
container: 'container',
layout: {
type: 'force',
// 防止节点重叠
preventOverlap: true,
// 节点大小
nodeSize: 20,
// 布局宽度
width: 800,
// 布局高度
height: 600,
},
});
```
### 防止节点重叠
```js
const graph = new Graph({
layout: {
type: 'force',
// 防止节点重叠
preventOverlap: true,
// 节点大小
nodeSize: 20,
},
});
```
### 力导向布局
该示例展示了如何使用力导向布局创建一个基础的力导向图。
```js
import { Graph, NodeEvent } from '@antv/g6';
const data = {
nodes: [
{ id: 'node1', label: 'Node 1', size: 30 },
{ id: 'node2', label: 'Node 2', size: 20 },
{ id: 'node3', label: 'Node 3', size: 20 },
{ id: 'node4', label: 'Node 4', size: 20 },
{ id: 'node5', label: 'Node 5', size: 30 },
{ id: 'node6', label: 'Node 6', size: 20 },
],
edges: [
{ source: 'node1', target: 'node2' },
{ source: 'node1', target: 'node3' },
{ source: 'node2', target: 'node4' },
{ source: 'node3', target: 'node4' },
{ source: 'node4', target: 'node5' },
{ source: 'node5', target: 'node6' },
],
};
const graph = new Graph({
container: 'container',
data,
autoFit: 'view',
modes: {
default: ['drag-canvas', 'zoom-canvas'],
},
layout: {
type: 'force',
// 防止节点重叠
preventOverlap: true,
// 节点大小
nodeSize: 20,
// 向心力
gravity: 0.9,
// 迭代次数
iterations: 100,
},
node: {
style: {
size: (d) => d.size,
fill: '#9EC9FF',
stroke: '#69C8FF',
label: (d) => d.label,
labelPlacement: 'center',
labelFill: '#333',
},
},
edge: {
style: {
stroke: '#e2e2e2',
},
},
});
graph.on(NodeEvent.CLICK, async (e) => {
const nodeId = e.target.id;
graph.updateNodeData([{ id: nodeId, size: 200 }]);
await graph.render();
});
graph.render();
```
主要配置说明:
- `preventOverlap`: 开启节点重叠检测
- `nodeSize`: 设置节点大小
- `gravity`: 设置节点向心力
- `iterations`: 设置布局计算的精确程度
还可以参考 [查看示例](https://g6.antv.antgroup.com/examples/layout/force-directed/#force) 获取更多用法。
Layout Skill
packages/site/docs/manual/layout/FruchtermanLayout.en.md anthropic-skill ~2,727 tokens---
title: Fruchterman Force-directed Layout
order: 14
---
## Overview
The Fruchterman layout is a force-directed layout based on the algorithm from [Graph Drawing by Force-directed Placement](https://www.mathe2.uni-bayreuth.de/axel/papers/reingold:graph_drawing_by_force_directed_placement.pdf). By flexibly configuring parameters to simulate physical forces, the layout automatically reaches a stable equilibrium state with minimal energy. It supports both basic uniform distribution and cluster layouts. See more Fruchterman force-directed layout [examples](/en/examples#layout-fruchterman) and [source code](https://github.com/antvis/layout/blob/v5/packages/layout/src/fruchterman.ts).
## Use Cases
- Basic uniform distribution: Suitable for displaying network graphs with evenly distributed nodes and clear overall structure, such as network topology and knowledge graphs.
- Cluster layout: Suitable for visualizing data with internal aggregation or grouping, such as community structure display and association group analysis.
## Options
| Property | Description | Type | Default | Required |
| ------------ | -------------------------------------------------------------------------------------------------------------------------------------------------------------------------------------------------- | ---------------------------------------------------------------------------------------------------------- | ---------------- | -------- |
| type | Layout type | `'fruchterman'` | - | ✓ |
| height | Layout height | `number` | container height | |
| width | Layout width | `number` | container width | |
| maxIteration | Maximum number of iterations | `number` | 500 | |
| minMovement | Convergence threshold | `number` | 0.4 | |
| gravity | Central force, i.e., the force attracting all nodes to the [center](https://github.com/antvis/layout/blob/v5/packages/layout/src/types.ts#L915). The larger the value, the more compact the layout | `number` | 10 | |
| speed | Node movement speed per iteration. Too high a speed may cause strong oscillation | `number` | 5 | |
| onTick | Callback for each iteration | (data: [LayoutMapping](https://github.com/antvis/layout/blob/v5/packages/layout/src/types.ts#L69)) => void | - | |
### Cluster Layout
| Property | Description | Type | Default | Required |
| -------------- | ----------------------------------------------------------------------------------------- | --------- | ----------- | -------- |
| clustering | Whether to use cluster layout | `boolean` | `false` | |
| nodeClusterBy | Field name in node data for clustering, effective when `clustering` is true | `string` | `'cluster'` | |
| clusterGravity | Gravity within clusters, affects cluster compactness, effective when `clustering` is true | `number` | 10 | |
## Example Code
### Basic Layout
```js | ob { pin: false, inject: true }
import { Graph } from '@antv/g6';
const graph = new Graph({
container: 'container',
width: 500,
height: 250,
data: {
nodes: [
{ id: '0' },
{ id: '1' },
{ id: '2' },
{ id: '3' },
{ id: '4' },
{ id: '5' },
{ id: '6' },
{ id: '7' },
{ id: '8' },
{ id: '9' },
{ id: '10' },
],
edges: [
{ source: '0', target: '1' },
{ source: '0', target: '2' },
{ source: '0', target: '3' },
{ source: '0', target: '4' },
{ source: '0', target: '7' },
{ source: '0', target: '8' },
{ source: '0', target: '9' },
{ source: '0', target: '10' },
{ source: '2', target: '3' },
{ source: '4', target: '5' },
{ source: '4', target: '6' },
{ source: '5', target: '6' },
{ source: '9', target: '10' },
],
},
node: {
style: {
labelFill: '#fff',
labelPlacement: 'center',
labelText: (d) => d.id,
},
},
layout: {
type: 'fruchterman',
gravity: 5,
speed: 5,
},
behaviors: ['drag-canvas', 'drag-element'],
});
graph.render();
```
<details><summary>Show full code</summary>
```javascript
import { Graph } from '@antv/g6';
const data = {
nodes: [
{ id: '0' },
{ id: '1' },
{ id: '2' },
{ id: '3' },
{ id: '4' },
{ id: '5' },
{ id: '6' },
{ id: '7' },
{ id: '8' },
{ id: '9' },
{ id: '10' },
],
edges: [
{ source: '0', target: '1' },
{ source: '0', target: '2' },
{ source: '0', target: '3' },
{ source: '0', target: '4' },
{ source: '0', target: '7' },
{ source: '0', target: '8' },
{ source: '0', target: '9' },
{ source: '0', target: '10' },
{ source: '2', target: '3' },
{ source: '4', target: '5' },
{ source: '4', target: '6' },
{ source: '5', target: '6' },
{ source: '9', target: '10' },
],
};
const graph = new Graph({
container: 'container',
data,
node: {
style: {
labelFill: '#fff',
labelPlacement: 'center',
labelText: (d) => d.id,
},
},
layout: {
type: 'fruchterman',
gravity: 5,
speed: 5,
},
behaviors: ['drag-canvas', 'drag-element'],
});
graph.render();
```
</details>
### Cluster Layout
```js | ob { pin: false, inject: true }
import { Graph } from '@antv/g6';
const graph = new Graph({
container: 'container',
width: 500,
height: 250,
data: {
nodes: [
{ id: '0', data: { cluster: 'a' } },
{ id: '1', data: { cluster: 'a' } },
{ id: '2', data: { cluster: 'a' } },
{ id: '3', data: { cluster: 'a' } },
{ id: '4', data: { cluster: 'a' } },
{ id: '5', data: { cluster: 'b' } },
{ id: '6', data: { cluster: 'b' } },
{ id: '7', data: { cluster: 'b' } },
{ id: '8', data: { cluster: 'c' } },
{ id: '9', data: { cluster: 'c' } },
{ id: '10', data: { cluster: 'c' } },
],
edges: [
{ source: '0', target: '1' },
{ source: '0', target: '2' },
{ source: '0', target: '4' },
{ source: '0', target: '6' },
{ source: '2', target: '3' },
{ source: '2', target: '4' },
{ source: '3', target: '4' },
{ source: '5', target: '6' },
{ source: '6', target: '7' },
{ source: '7', target: '8' },
{ source: '8', target: '9' },
{ source: '8', target: '10' },
],
},
node: {
style: {
labelFill: '#fff',
labelPlacement: 'center',
labelText: (d) => `${d.data.cluster}-${d.id}`,
},
palette: {
type: 'group',
field: 'cluster',
},
},
edge: {
style: {
endArrow: true,
},
},
layout: {
type: 'fruchterman',
gravity: 6,
speed: 5,
// Cluster layout parameters
clustering: true,
nodeClusterBy: 'cluster',
clusterGravity: 3,
},
behaviors: ['drag-canvas', 'drag-element'],
});
graph.render();
```
<details><summary>Show full code</summary>
```javascript
import { Graph } from '@antv/g6';
const data = {
nodes: [
{ id: '0', data: { cluster: 'a' } },
{ id: '1', data: { cluster: 'a' } },
{ id: '2', data: { cluster: 'a' } },
{ id: '3', data: { cluster: 'a' } },
{ id: '4', data: { cluster: 'a' } },
{ id: '5', data: { cluster: 'b' } },
{ id: '6', data: { cluster: 'b' } },
{ id: '7', data: { cluster: 'b' } },
{ id: '8', data: { cluster: 'c' } },
{ id: '9', data: { cluster: 'c' } },
{ id: '10', data: { cluster: 'c' } },
],
edges: [
{ source: '0', target: '1' },
{ source: '0', target: '2' },
{ source: '0', target: '4' },
{ source: '0', target: '6' },
{ source: '2', target: '3' },
{ source: '2', target: '4' },
{ source: '3', target: '4' },
{ source: '5', target: '6' },
{ source: '6', target: '7' },
{ source: '7', target: '8' },
{ source: '8', target: '9' },
{ source: '8', target: '10' },
],
};
const graph = new Graph({
container: 'container',
data,
node: {
style: {
labelFill: '#fff',
labelPlacement: 'center',
labelText: (d) => `${d.data.cluster}-${d.id}`,
},
palette: {
type: 'group',
field: 'cluster',
},
},
edge: {
style: {
endArrow: true,
},
},
layout: {
type: 'fruchterman',
gravity: 6,
speed: 5,
// Cluster layout parameters
clustering: true,
nodeClusterBy: 'cluster',
clusterGravity: 3,
},
behaviors: ['drag-canvas', 'drag-element'],
});
graph.render();
```
</details>
Layout Skill
packages/site/docs/manual/layout/FruchtermanLayout.zh.md anthropic-skill ~2,350 tokens---
title: Fruchterman 力导向布局
order: 14
---
## 概述
Fruchterman 布局是基于 [Graph Drawing by Force-directed Placement](https://www.mathe2.uni-bayreuth.de/axel/papers/reingold:graph_drawing_by_force_directed_placement.pdf) 算法实现的一种力导向布局,通过灵活的参数配置模拟物理作用,使整个布局自动达到能量最小的稳定平衡状态,支持基础均匀分布和聚类布局。参考更多 Fruchterman 力导向布局[样例](/examples#layout-fruchterman)和[源码](https://github.com/antvis/layout/blob/v5/packages/layout/src/fruchterman.ts)
## 使用场景
- 基础均匀分布: 适用于展示节点均匀分布,整体结构清晰的网络关系图, 比如网络拓扑、知识图谱。
- 聚类布局: 适用于具有内部聚合特性或分组的数据可视化展示, 比如社区结构展示、关联组分析。
## 配置项
| 属性 | 描述 | 类型 | 默认值 | 必选 |
| ------------ | ---------------------------------------------------------------------------------------------------------------------------------------------- | ---------------------------------------------------------------------------------------------------------- | -------- | ---- |
| type | 布局类型 | `'fruchterman'` | - | ✓ |
| height | 布局的高度 | `number` | 容器高度 | |
| width | 布局的宽度 | `number` | 容器宽度 | |
| maxIteration | 最大迭代次数 | `number` | 500 | |
| minMovement | 收敛阈值 | `number` | 0.4 | |
| gravity | 中心力大小,指所有节点被吸引到 [center](https://github.com/antvis/layout/blob/v5/packages/layout/src/types.ts#L915) 的力。数字越大,布局越紧凑 | `number` | 10 | |
| speed | 每次迭代节点移动的速度。速度太快可能会导致强烈震荡 | `number` | 5 | |
| onTick | 每一次迭代的回调函数 | (data: [LayoutMapping](https://github.com/antvis/layout/blob/v5/packages/layout/src/types.ts#L69)) => void | - | |
### 聚类布局
| 属性 | 描述 | 类型 | 默认值 | 必选 |
| -------------- | -------------------------------------------------------------------------- | --------- | ----------- | ---- |
| clustering | 是否按照聚类布局 | `boolean` | `false` | |
| nodeClusterBy | 聚类布局依据的节点数据 `data` 中的字段名,在 `clustering` 为 `true` 时生效 | `string` | `'cluster'` | |
| clusterGravity | 聚类内部的重力大小,影响聚类的紧凑程度,在 `clustering` 为 `true` 时生效 | `number` | 10 | |
## 示例代码
### 基本布局
```js | ob { pin: false, inject: true }
import { Graph } from '@antv/g6';
const graph = new Graph({
container: 'container',
width: 500,
height: 250,
data: {
nodes: [
{ id: '0' },
{ id: '1' },
{ id: '2' },
{ id: '3' },
{ id: '4' },
{ id: '5' },
{ id: '6' },
{ id: '7' },
{ id: '8' },
{ id: '9' },
{ id: '10' },
],
edges: [
{ source: '0', target: '1' },
{ source: '0', target: '2' },
{ source: '0', target: '3' },
{ source: '0', target: '4' },
{ source: '0', target: '7' },
{ source: '0', target: '8' },
{ source: '0', target: '9' },
{ source: '0', target: '10' },
{ source: '2', target: '3' },
{ source: '4', target: '5' },
{ source: '4', target: '6' },
{ source: '5', target: '6' },
{ source: '9', target: '10' },
],
},
node: {
style: {
labelFill: '#fff',
labelPlacement: 'center',
labelText: (d) => d.id,
},
},
layout: {
type: 'fruchterman',
gravity: 5,
speed: 5,
},
behaviors: ['drag-canvas', 'drag-element'],
});
graph.render();
```
<details><summary>展开查看完整代码</summary>
```javascript
import { Graph } from '@antv/g6';
const data = {
nodes: [
{ id: '0' },
{ id: '1' },
{ id: '2' },
{ id: '3' },
{ id: '4' },
{ id: '5' },
{ id: '6' },
{ id: '7' },
{ id: '8' },
{ id: '9' },
{ id: '10' },
],
edges: [
{ source: '0', target: '1' },
{ source: '0', target: '2' },
{ source: '0', target: '3' },
{ source: '0', target: '4' },
{ source: '0', target: '7' },
{ source: '0', target: '8' },
{ source: '0', target: '9' },
{ source: '0', target: '10' },
{ source: '2', target: '3' },
{ source: '4', target: '5' },
{ source: '4', target: '6' },
{ source: '5', target: '6' },
{ source: '9', target: '10' },
],
};
const graph = new Graph({
container: 'container',
data,
node: {
style: {
labelFill: '#fff',
labelPlacement: 'center',
labelText: (d) => d.id,
},
},
layout: {
type: 'fruchterman',
gravity: 5,
speed: 5,
},
behaviors: ['drag-canvas', 'drag-element'],
});
graph.render();
```
</details>
### 聚类布局
```js | ob { pin: false, inject: true }
import { Graph } from '@antv/g6';
const graph = new Graph({
container: 'container',
width: 500,
height: 250,
data: {
nodes: [
{ id: '0', data: { cluster: 'a' } },
{ id: '1', data: { cluster: 'a' } },
{ id: '2', data: { cluster: 'a' } },
{ id: '3', data: { cluster: 'a' } },
{ id: '4', data: { cluster: 'a' } },
{ id: '5', data: { cluster: 'b' } },
{ id: '6', data: { cluster: 'b' } },
{ id: '7', data: { cluster: 'b' } },
{ id: '8', data: { cluster: 'c' } },
{ id: '9', data: { cluster: 'c' } },
{ id: '10', data: { cluster: 'c' } },
],
edges: [
{ source: '0', target: '1' },
{ source: '0', target: '2' },
{ source: '0', target: '4' },
{ source: '0', target: '6' },
{ source: '2', target: '3' },
{ source: '2', target: '4' },
{ source: '3', target: '4' },
{ source: '5', target: '6' },
{ source: '6', target: '7' },
{ source: '7', target: '8' },
{ source: '8', target: '9' },
{ source: '8', target: '10' },
],
},
node: {
style: {
labelFill: '#fff',
labelPlacement: 'center',
labelText: (d) => `${d.data.cluster}-${d.id}`,
},
palette: {
type: 'group',
field: 'cluster',
},
},
edge: {
style: {
endArrow: true,
},
},
layout: {
type: 'fruchterman',
gravity: 6,
speed: 5,
// 聚类布局参数
clustering: true,
nodeClusterBy: 'cluster',
clusterGravity: 3,
},
behaviors: ['drag-canvas', 'drag-element'],
});
graph.render();
```
<details><summary>展开查看完整代码</summary>
```javascript
import { Graph } from '@antv/g6';
const data = {
nodes: [
{ id: '0', data: { cluster: 'a' } },
{ id: '1', data: { cluster: 'a' } },
{ id: '2', data: { cluster: 'a' } },
{ id: '3', data: { cluster: 'a' } },
{ id: '4', data: { cluster: 'a' } },
{ id: '5', data: { cluster: 'b' } },
{ id: '6', data: { cluster: 'b' } },
{ id: '7', data: { cluster: 'b' } },
{ id: '8', data: { cluster: 'c' } },
{ id: '9', data: { cluster: 'c' } },
{ id: '10', data: { cluster: 'c' } },
],
edges: [
{ source: '0', target: '1' },
{ source: '0', target: '2' },
{ source: '0', target: '4' },
{ source: '0', target: '6' },
{ source: '2', target: '3' },
{ source: '2', target: '4' },
{ source: '3', target: '4' },
{ source: '5', target: '6' },
{ source: '6', target: '7' },
{ source: '7', target: '8' },
{ source: '8', target: '9' },
{ source: '8', target: '10' },
],
};
const graph = new Graph({
container: 'container',
data,
node: {
style: {
labelFill: '#fff',
labelPlacement: 'center',
labelText: (d) => `${d.data.cluster}-${d.id}`,
},
palette: {
type: 'group',
field: 'cluster',
},
},
edge: {
style: {
endArrow: true,
},
},
layout: {
type: 'fruchterman',
gravity: 6,
speed: 5,
// 聚类布局参数
clustering: true,
nodeClusterBy: 'cluster',
clusterGravity: 3,
},
behaviors: ['drag-canvas', 'drag-element'],
});
graph.render();
```
</details>
Layout Skill
packages/site/docs/manual/layout/GridLayout.en.md anthropic-skill ~3,006 tokens---
title: Grid Layout
order: 15
---
## Overview
The grid layout arranges nodes in a grid pattern, suitable for scenarios where nodes need to be arranged neatly. This layout supports automatic calculation of the number of rows and columns, or you can specify them manually. It also supports preventing node overlap.
## Use Cases
- Visualizing data in a matrix or table format
## Online Demo
```js | ob { pin: false }
createGraph(
{
data: {
nodes: Array.from({ length: 25 }, (_, i) => ({
id: `node-${i}`,
data: {
value: Math.random() * 100,
},
})),
edges: Array.from({ length: 20 }, (_, i) => ({
id: `edge-${i}`,
source: `node-${Math.floor(Math.random() * 25)}`,
target: `node-${Math.floor(Math.random() * 25)}`,
})),
},
autoFit: 'view',
node: {
style: {
size: 20,
label: true,
labelText: (datum) => datum.id,
labelBackground: true,
icon: false,
},
palette: {
type: 'group',
field: (datum) => datum.data.value,
color: ['#1783FF', '#00C9C9', '#F08F56', '#D580FF'],
},
},
edge: {
style: {
stroke: '#bfbfbf',
},
},
behaviors: ['drag-canvas'],
layout: {
type: 'grid',
cols: 5,
rows: 5,
width: 400,
height: 400,
preventOverlap: true,
nodeSize: 30,
condense: false,
},
},
{ width: 600, height: 400 },
(gui, graph) => {
const options = {
type: 'grid',
cols: 5,
rows: 5,
width: 400,
height: 400,
preventOverlap: true,
nodeSize: 30,
condense: false,
};
const optionFolder = gui.addFolder('Grid Layout Options');
optionFolder.add(options, 'type').disable(true);
optionFolder.add(options, 'cols', 2, 10, 1);
optionFolder.add(options, 'rows', 2, 10, 1);
optionFolder.add(options, 'width', 200, 600, 50);
optionFolder.add(options, 'height', 200, 600, 50);
optionFolder.add(options, 'preventOverlap');
optionFolder.add(options, 'nodeSize', 10, 50, 5);
optionFolder.add(options, 'condense');
optionFolder.onChange(({ property, value }) => {
graph.setLayout({
type: 'grid',
[property]: value,
});
graph.layout();
});
},
);
```
## Configuration
```js
const graph = new Graph({
layout: {
type: 'grid',
begin: [0, 0],
cols: 5,
rows: 5,
width: 300,
height: 300,
preventOverlap: true,
nodeSize: 30,
condense: false,
},
});
```
## Options
| Property | Description | Type | Default | Required |
| --------------------- | ------------------------------------------------------------------------------------------------------------------------------- | ------------------------------------------------ | --------- | -------- |
| type | Layout type | `grid` | - | ✓ |
| begin | Grid start position (top-left corner), default is `[0, 0]` | [number, number] | [0, 0] | |
| cols | Number of columns. If undefined, the algorithm calculates it automatically based on node count, layout space, and rows (if set) | number | undefined | |
| rows | Number of rows. If undefined, the algorithm calculates it automatically based on node count, layout space, and cols (if set) | number | 10 | |
| width | Layout area width. In G6, the container width is used as the default value | number | 300 | |
| height | Layout area height. In G6, the container height is used as the default value | number | 300 | |
| condense | If false, uses all available canvas space; if true, uses the minimum canvas space | boolean | false | |
| nodeSize | Node size (diameter), used for collision detection when preventing overlap | Size \| ((nodeData: Node) => Size) | - | |
| nodeSpacing | Node spacing, used to adjust the gap between nodes | ((node?: Node) => number) \| number | - | |
| position | Specify the row and column for each node | (node?: Node) => { row?: number; col?: number; } | undefined | |
| preventOverlap | Whether to prevent node overlap. Requires nodeSize or size property in node data | boolean | false | |
| preventOverlapPadding | Padding when preventing overlap. Effective when preventOverlap is true | number | 10 | |
| sortBy | Sort basis (node property name). Higher values are placed more centrally. If undefined, degree is used for sorting | string | undefined | |
### preventOverlap
> _boolean_ **Default:** `false`
Whether to prevent overlap
Must be used with nodeSize or the size property in node data. Only when data has data.size or nodeSize is set in the layout, collision detection for node overlap can be performed.
### preventOverlapPadding
> _number_ **Default:** `10`
Padding when preventing overlap. Effective when preventOverlap is true.
### sortBy
> _string_ **Default:** `undefined`
Sort basis (node property name). Higher values are placed more centrally. If undefined, degree is used for sorting. In G6, the container width is used as the default value for grid layout width. When used alone, the default is 300.
## Code Examples
### Basic Usage
The simplest configuration:
```js
const graph = new Graph({
layout: {
type: 'grid',
cols: 5,
rows: 5,
},
data: {
nodes: Array.from({ length: 25 }, (_, i) => ({
id: `node-${i}`,
data: {
value: Math.random() * 100,
},
})),
edges: Array.from({ length: 20 }, (_, i) => ({
id: `edge-${i}`,
source: `node-${Math.floor(Math.random() * 25)}`,
target: `node-${Math.floor(Math.random() * 25)}`,
})),
},
});
```
Result:
```js | ob { pin: false, inject: true }
import { Graph } from '@antv/g6';
const graph = new Graph({
container: 'container',
width: 600,
height: 400,
layout: {
type: 'grid',
cols: 5,
rows: 5,
},
data: {
nodes: Array.from({ length: 25 }, (_, i) => ({
id: `node-${i}`,
data: {
value: Math.random() * 100,
},
})),
edges: Array.from({ length: 20 }, (_, i) => ({
id: `edge-${i}`,
source: `node-${Math.floor(Math.random() * 25)}`,
target: `node-${Math.floor(Math.random() * 25)}`,
})),
},
node: {
style: {
size: 20,
label: true,
labelText: (datum) => datum.id,
labelBackground: true,
},
},
edge: {
style: {
stroke: '#bfbfbf',
},
},
});
graph.render();
```
### Custom Configuration
You can customize the grid layout in various ways:
```js
const graph = new Graph({
layout: {
type: 'grid',
begin: [50, 50], // Start layout from [50, 50]
cols: 4, // 4 columns
rows: 6, // 6 rows
width: 400, // Layout area width
height: 600, // Layout area height
preventOverlap: true, // Prevent node overlap
nodeSize: 30, // Node size
condense: true, // Use minimum space
sortBy: 'value', // Sort by value property
},
data: {
nodes: Array.from({ length: 24 }, (_, i) => ({
id: `node-${i}`,
data: {
value: Math.random() * 100, // Property for sorting
},
})),
edges: Array.from({ length: 20 }, (_, i) => ({
id: `edge-${i}`,
source: `node-${Math.floor(Math.random() * 24)}`,
target: `node-${Math.floor(Math.random() * 24)}`,
})),
},
});
```
Result:
```js | ob { pin: false, inject: true }
import { Graph } from '@antv/g6';
const graph = new Graph({
container: 'container',
width: 600,
height: 400,
layout: {
type: 'grid',
begin: [50, 50],
cols: 4,
rows: 6,
width: 400,
height: 600,
preventOverlap: true,
nodeSize: 30,
condense: true,
sortBy: 'value',
},
data: {
nodes: Array.from({ length: 24 }, (_, i) => ({
id: `node-${i}`,
data: {
value: Math.random() * 100,
},
})),
edges: Array.from({ length: 20 }, (_, i) => ({
id: `edge-${i}`,
source: `node-${Math.floor(Math.random() * 24)}`,
target: `node-${Math.floor(Math.random() * 24)}`,
})),
},
node: {
style: {
size: 20,
label: true,
labelText: (datum) => datum.id,
labelBackground: true,
},
palette: {
type: 'group',
field: (datum) => datum.data.value,
color: ['#1783FF', '#00C9C9', '#F08F56', '#D580FF'],
},
},
edge: {
style: {
stroke: '#bfbfbf',
},
},
});
graph.render();
```
### Specify Node Position
You can specify the position for specific nodes using the `position` property:
```js
const graph = new Graph({
layout: {
type: 'grid',
cols: 5,
rows: 5,
position: (node) => {
// Specify position for specific nodes
if (node.id === 'node-0') return { row: 0, col: 0 }; // Top-left
if (node.id === 'node-1') return { row: 0, col: 4 }; // Top-right
if (node.id === 'node-2') return { row: 4, col: 0 }; // Bottom-left
if (node.id === 'node-3') return { row: 4, col: 4 }; // Bottom-right
return undefined; // Other nodes are auto-arranged
},
},
data: {
nodes: Array.from({ length: 25 }, (_, i) => ({
id: `node-${i}`,
})),
edges: Array.from({ length: 20 }, (_, i) => ({
id: `edge-${i}`,
source: `node-${Math.floor(Math.random() * 25)}`,
target: `node-${Math.floor(Math.random() * 25)}`,
})),
},
});
```
Result:
```js | ob { pin: false, inject: true }
import { Graph } from '@antv/g6';
const graph = new Graph({
container: 'container',
width: 600,
height: 400,
layout: {
type: 'grid',
cols: 5,
rows: 5,
position: (node) => {
if (node.id === 'node-0') return { row: 0, col: 0 };
if (node.id === 'node-1') return { row: 0, col: 4 };
if (node.id === 'node-2') return { row: 4, col: 0 };
if (node.id === 'node-3') return { row: 4, col: 4 };
return undefined;
},
},
data: {
nodes: Array.from({ length: 25 }, (_, i) => ({
id: `node-${i}`,
})),
edges: Array.from({ length: 20 }, (_, i) => ({
id: `edge-${i}`,
source: `node-${Math.floor(Math.random() * 25)}`,
target: `node-${Math.floor(Math.random() * 25)}`,
})),
},
node: {
style: {
size: 20,
label: true,
labelText: (datum) => datum.id,
labelBackground: true,
},
},
edge: {
style: {
stroke: '#bfbfbf',
},
},
});
graph.render();
```
## Real Cases
- [Grid Layout](/en/examples/layout/grid/#basic)
Layout Skill
packages/site/docs/manual/layout/GridLayout.zh.md anthropic-skill ~2,712 tokens---
title: 网格布局 Grid
order: 15
---
## 概述
网格布局将节点按照网格形式排列,适用于需要整齐排列节点的场景。该布局支持自动计算行列数,也可以手动指定行列数,并支持防止节点重叠。
## 使用场景
- 在数据可视化中需要展示矩阵或表格形式的数据关系
## 在线体验
```js | ob { pin: false }
createGraph(
{
data: {
nodes: Array.from({ length: 25 }, (_, i) => ({
id: `node-${i}`,
data: {
value: Math.random() * 100,
},
})),
edges: Array.from({ length: 20 }, (_, i) => ({
id: `edge-${i}`,
source: `node-${Math.floor(Math.random() * 25)}`,
target: `node-${Math.floor(Math.random() * 25)}`,
})),
},
autoFit: 'view',
node: {
style: {
size: 20,
label: true,
labelText: (datum) => datum.id,
labelBackground: true,
icon: false,
},
palette: {
type: 'group',
field: (datum) => datum.data.value,
color: ['#1783FF', '#00C9C9', '#F08F56', '#D580FF'],
},
},
edge: {
style: {
stroke: '#bfbfbf',
},
},
behaviors: ['drag-canvas'],
layout: {
type: 'grid',
cols: 5,
rows: 5,
width: 400,
height: 400,
preventOverlap: true,
nodeSize: 30,
condense: false,
},
},
{ width: 600, height: 400 },
(gui, graph) => {
const options = {
type: 'grid',
cols: 5,
rows: 5,
width: 400,
height: 400,
preventOverlap: true,
nodeSize: 30,
condense: false,
};
const optionFolder = gui.addFolder('Grid Layout Options');
optionFolder.add(options, 'type').disable(true);
optionFolder.add(options, 'cols', 2, 10, 1);
optionFolder.add(options, 'rows', 2, 10, 1);
optionFolder.add(options, 'width', 200, 600, 50);
optionFolder.add(options, 'height', 200, 600, 50);
optionFolder.add(options, 'preventOverlap');
optionFolder.add(options, 'nodeSize', 10, 50, 5);
optionFolder.add(options, 'condense');
optionFolder.onChange(({ property, value }) => {
graph.setLayout({
type: 'grid',
[property]: value,
});
graph.layout();
});
},
);
```
## 配置方式
```js
const graph = new Graph({
layout: {
type: 'grid',
begin: [0, 0],
cols: 5,
rows: 5,
width: 300,
height: 300,
preventOverlap: true,
nodeSize: 30,
condense: false,
},
});
```
## 配置项
| 属性 | 描述 | 类型 | 默认值 | 必选 |
| --------------------- | -------------------------------------------------------------------------------------------------------------------------------- | ------------------------------------------------ | --------- | ---- |
| type | 布局类型 | `grid` | - | ✓ |
| begin | 网格开始位置(左上角),默认为 `[0, 0]` | [number, number] | [0, 0] | |
| cols | 网格的列数,为 undefined 时算法根据节点数量、布局空间、rows(若指定)自动计算 | number | undefined | |
| rows | 网格的行数,为 undefined 时算法根据节点数量、布局空间、cols(若指定)自动计算 | number | 10 | |
| width | 布局区域宽度,在 G6 中使用当前容器的宽度作为默认值 | number | 300 | |
| height | 布局区域高度,在 G6 中使用当前容器的高度作为默认值 | number | 300 | |
| condense | 为 false 时表示利用所有可用画布空间,为 true 时表示利用最小的画布空间 | boolean | false | |
| nodeSize | 节点大小(直径),用于防止节点重叠时的碰撞检测 | Size \| ((nodeData: Node) => Size) | - | |
| nodeSpacing | 节点间距,用于调整节点之间的间隔 | ((node?: Node) => number) \| number | - | |
| position | 指定每个节点所在的行和列 | (node?: Node) => { row?: number; col?: number; } | undefined | |
| preventOverlap | 是否防止节点重叠,需要配合 nodeSize 或节点数据中的 size 属性使用 | boolean | false | |
| preventOverlapPadding | 避免重叠时节点的间距 padding,preventOverlap 为 true 时生效 | number | 10 | |
| sortBy | 指定排序的依据(节点属性名),数值越高则该节点被放置得越中心。若为 undefined,则会计算节点的度数,度数越高,节点将被放置得越中心 | string | undefined | |
### preventOverlap
> _boolean_ **Default:** `false`
是否防止重叠
必须配合下面属性 nodeSize 或节点数据中的 data.size 属性,只有在数据中设置了 data.size 或在该布局中配置了与当前图节点大小相同的 nodeSize 值,才能够进行节点重叠的碰撞检测
### preventOverlapPadding
> _number_ **Default:** `10`
避免重叠时节点的间距 padding,preventOverlap 为 true 时生效
### sortBy
> _string_ **Default:** `undefined`
指定排序的依据(节点属性名),数值越高则该节点被放置得越中心。若为 undefined,则会计算节点的度数,度数越高,节点将被放置得越中心
在 G6 中使用当前容器的宽度作为 grid 布局 width 的默认值。单独使用此布局时默认值为 300
## 代码示例
### 基础用法
最简单的配置方式:
```js
const graph = new Graph({
layout: {
type: 'grid',
cols: 5,
rows: 5,
},
data: {
nodes: Array.from({ length: 25 }, (_, i) => ({
id: `node-${i}`,
data: {
value: Math.random() * 100,
},
})),
edges: Array.from({ length: 20 }, (_, i) => ({
id: `edge-${i}`,
source: `node-${Math.floor(Math.random() * 25)}`,
target: `node-${Math.floor(Math.random() * 25)}`,
})),
},
});
```
效果如下:
```js | ob { pin: false, inject: true }
import { Graph } from '@antv/g6';
const graph = new Graph({
container: 'container',
width: 600,
height: 400,
layout: {
type: 'grid',
cols: 5,
rows: 5,
},
data: {
nodes: Array.from({ length: 25 }, (_, i) => ({
id: `node-${i}`,
data: {
value: Math.random() * 100,
},
})),
edges: Array.from({ length: 20 }, (_, i) => ({
id: `edge-${i}`,
source: `node-${Math.floor(Math.random() * 25)}`,
target: `node-${Math.floor(Math.random() * 25)}`,
})),
},
node: {
style: {
size: 20,
label: true,
labelText: (datum) => datum.id,
labelBackground: true,
},
},
edge: {
style: {
stroke: '#bfbfbf',
},
},
});
graph.render();
```
### 自定义配置
可以通过多种方式自定义网格布局:
```js
const graph = new Graph({
layout: {
type: 'grid',
begin: [50, 50], // 从坐标 [50, 50] 开始布局
cols: 4, // 指定 4 列
rows: 6, // 指定 6 行
width: 400, // 布局区域宽度
height: 600, // 布局区域高度
preventOverlap: true, // 防止节点重叠
nodeSize: 30, // 节点大小
condense: true, // 使用最小空间
sortBy: 'value', // 按 value 属性排序
},
data: {
nodes: Array.from({ length: 24 }, (_, i) => ({
id: `node-${i}`,
data: {
value: Math.random() * 100, // 用于排序的属性
},
})),
edges: Array.from({ length: 20 }, (_, i) => ({
id: `edge-${i}`,
source: `node-${Math.floor(Math.random() * 24)}`,
target: `node-${Math.floor(Math.random() * 24)}`,
})),
},
});
```
效果如下:
```js | ob { pin: false, inject: true }
import { Graph } from '@antv/g6';
const graph = new Graph({
container: 'container',
width: 600,
height: 400,
layout: {
type: 'grid',
begin: [50, 50],
cols: 4,
rows: 6,
width: 400,
height: 600,
preventOverlap: true,
nodeSize: 30,
condense: true,
sortBy: 'value',
},
data: {
nodes: Array.from({ length: 24 }, (_, i) => ({
id: `node-${i}`,
data: {
value: Math.random() * 100,
},
})),
edges: Array.from({ length: 20 }, (_, i) => ({
id: `edge-${i}`,
source: `node-${Math.floor(Math.random() * 24)}`,
target: `node-${Math.floor(Math.random() * 24)}`,
})),
},
node: {
style: {
size: 20,
label: true,
labelText: (datum) => datum.id,
labelBackground: true,
},
palette: {
type: 'group',
field: (datum) => datum.data.value,
color: ['#1783FF', '#00C9C9', '#F08F56', '#D580FF'],
},
},
edge: {
style: {
stroke: '#bfbfbf',
},
},
});
graph.render();
```
### 指定节点位置
可以通过 `position` 属性为特定节点指定位置:
```js
const graph = new Graph({
layout: {
type: 'grid',
cols: 5,
rows: 5,
position: (node) => {
// 为特定节点指定位置
if (node.id === 'node-0') return { row: 0, col: 0 }; // 左上角
if (node.id === 'node-1') return { row: 0, col: 4 }; // 右上角
if (node.id === 'node-2') return { row: 4, col: 0 }; // 左下角
if (node.id === 'node-3') return { row: 4, col: 4 }; // 右下角
return undefined; // 其他节点自动布局
},
},
data: {
nodes: Array.from({ length: 25 }, (_, i) => ({
id: `node-${i}`,
})),
edges: Array.from({ length: 20 }, (_, i) => ({
id: `edge-${i}`,
source: `node-${Math.floor(Math.random() * 25)}`,
target: `node-${Math.floor(Math.random() * 25)}`,
})),
},
});
```
效果如下:
```js | ob { pin: false, inject: true }
import { Graph } from '@antv/g6';
const graph = new Graph({
container: 'container',
width: 600,
height: 400,
layout: {
type: 'grid',
cols: 5,
rows: 5,
position: (node) => {
if (node.id === 'node-0') return { row: 0, col: 0 };
if (node.id === 'node-1') return { row: 0, col: 4 };
if (node.id === 'node-2') return { row: 4, col: 0 };
if (node.id === 'node-3') return { row: 4, col: 4 };
return undefined;
},
},
data: {
nodes: Array.from({ length: 25 }, (_, i) => ({
id: `node-${i}`,
})),
edges: Array.from({ length: 20 }, (_, i) => ({
id: `edge-${i}`,
source: `node-${Math.floor(Math.random() * 25)}`,
target: `node-${Math.floor(Math.random() * 25)}`,
})),
},
node: {
style: {
size: 20,
label: true,
labelText: (datum) => datum.id,
labelBackground: true,
},
},
edge: {
style: {
stroke: '#bfbfbf',
},
},
});
graph.render();
```
## 实际案例
- [Grid布局](/examples/layout/grid/#basic)
Layout Skill
packages/site/docs/manual/layout/IndentedLayout.en.md anthropic-skill ~1,543 tokens---
title: Indented Tree
order: 16
---
# Indented Tree Layout
## Overview
Indented tree layout represents the hierarchy of tree nodes through indentation in the horizontal direction. Each element occupies a row or column, commonly used in file directory structures, organizational charts, and other scenarios. This layout provides a clear structure for displaying hierarchical relationships.
<img src='https://gw.alipayobjects.com/mdn/rms_f8c6a0/afts/img/A*NBUzRonaOYMAAAAAAAAAAABkARQnAQ' width=175 alt='Indented Tree Layout'/>
## Use Cases
- File directory structure visualization
- Organizational charts
- Classification system display
- Tree-like data where hierarchical relationships need to be emphasized
## Configuration Items
> IndentedLayout supports common layout configuration items and specific configuration items, as shown below.
| Property | Description | Type | Default | Required |
| ---------------------- | ------------------------------------------------------------------- | ------------------------------- | ---------- | -------- |
| type | Layout type, must be 'indented' | 'indented' | - | ✓ |
| direction | Layout direction, see details below | 'LR' \| 'RL' \| 'H' | 'LR' | |
| indent | Column spacing, fixed value or function | number \| (d?: Node) => number | 20 | |
| getWidth | Get each node's width, effective when direction='H' | (d?: Node) => number | - | |
| getHeight | Get each node's height | (d?: Node) => number | - | |
| getSide | Node placement on left/right side of root, overrides direction='H' | (d?: Node) => 'left' \| 'right' | - | |
| dropCap | Whether the first child of each node starts on the next line | boolean | true | |
| isLayoutInvisibleNodes | Whether invisible nodes participate in layout (when preLayout=true) | boolean | false | |
| nodeFilter | Nodes participating in this layout | (node: NodeData) => boolean | () => true | |
| preLayout | Use pre-layout, calculate layout before initializing elements | boolean | false | |
| enableWorker | Whether to run layout in WebWorker | boolean | - | |
| iterations | Number of iterations for iterative layout | number | - | |
### Complex Type Explanations
- **direction**
- `'LR'`: Root node on the left, layout to the right
<img src='https://gw.alipayobjects.com/mdn/rms_f8c6a0/afts/img/A*mq6YSIKrAt0AAAAAAAAAAABkARQnAQ' width=110 alt='LR'/>
- `'RL'`: Root node on the right, layout to the left
<img src='https://gw.alipayobjects.com/mdn/rms_f8c6a0/afts/img/A*VGEnRbpvxlUAAAAAAAAAAABkARQnAQ' width=90 alt='RL'/>
- `'H'`: Root node in the middle, horizontal symmetric layout
<img src='https://gw.alipayobjects.com/mdn/rms_f8c6a0/afts/img/A*Vek6RqtUXNcAAAAAAAAAAABkARQnAQ' width=160 alt='H'/>
- **indent**
- Fixed value: Consistent indentation for all levels
- Function: (d?: Node) => number, customize indentation based on node
- Example:
```js
(d) => {
if (d.parent?.id === 'testId') return d.parent.x + 50;
return 100;
};
```
- **getWidth/getHeight**
- Used to customize each node's width/height, often for content adaptation
- Example:
```js
(d) => (d.id === 'testId' ? 50 : 100);
```
- **getSide**
- Specifies which side of the root node a node should be placed, only effective when direction='H'
- Example:
```js
(d) => (d.id === 'testId' ? 'left' : 'right');
```
## Example Code
> For more examples, see [Online Demo](https://g6.antv.antgroup.com/en/examples/layout/indented)
### Automatic Child Node Distribution
<img src="https://mdn.alipayobjects.com/huamei_qa8qxu/afts/img/A*Kc63QoxgLNYAAAAAAAAAAAAADmJ7AQ/original" width="300" />
```js
import { Graph, treeToGraphData } from '@antv/g6';
fetch('https://gw.alipayobjects.com/os/antvdemo/assets/data/algorithm-category.json')
.then((res) => res.json())
.then((data) => {
const graph = new Graph({
container: 'container',
data: treeToGraphData(data),
autoFit: 'view',
layout: {
type: 'indented',
direction: 'H',
indent: 80,
getHeight: () => 16,
getWidth: () => 32,
},
});
graph.render();
});
```
### Right Side Child Node Distribution
<img src="https://mdn.alipayobjects.com/huamei_qa8qxu/afts/img/A*3PioQ4TAMx8AAAAAAAAAAAAADmJ7AQ/original" width="300" />
```js
// ... code as above, layout.direction: 'LR'
```
### Left Side Child Node Distribution
<img src="https://mdn.alipayobjects.com/huamei_qa8qxu/afts/img/A*o6uzQ5nmXJkAAAAAAAAAAAAADmJ7AQ/original" width="300" />
```js
// ... code as above, layout.direction: 'RL'
```
### Custom Child Node Distribution
<img src="https://mdn.alipayobjects.com/huamei_qa8qxu/afts/img/A*Kc63QoxgLNYAAAAAAAAAAAAADmJ7AQ/original" width="300" />
```js
layout: {
type: 'indented',
direction: 'H',
indent: 80,
getHeight: () => 16,
getWidth: () => 32,
getSide: (d) => {
if (d.id === 'Regression' || d.id === 'Classification') return 'left';
return 'right';
},
}
```
### No Line Break for First Child Node
<img src="https://mdn.alipayobjects.com/huamei_qa8qxu/afts/img/A*bC-pRrO7srwAAAAAAAAAAAAADmJ7AQ/original" width="300" />
```js
layout: {
type: 'indented',
direction: 'LR',
indent: 80,
getHeight: () => 16,
getWidth: () => 32,
dropCap: false,
}
```
Layout Skill
packages/site/docs/manual/layout/IndentedLayout.zh.md anthropic-skill ~1,191 tokens---
title: 缩进树 Indented
order: 16
---
## 概述
Indented(缩进树)布局是一种通过水平方向的缩进量来表示树节点层级的布局方式。每个元素占据一行或一列,常用于文件目录结构、组织架构等场景。该布局结构清晰,便于展示层级关系。
<img src='https://gw.alipayobjects.com/mdn/rms_f8c6a0/afts/img/A*NBUzRonaOYMAAAAAAAAAAABkARQnAQ' width=175 alt='Indented 缩进树布局示意图'/>
## 使用场景
- 文件目录结构可视化
- 组织架构树
- 分类体系展示
- 需要突出层级关系的树状数据
## 配置项
> IndentedLayout 支持通用布局配置项和专有配置项,详见下表。
| 属性 | 描述 | 类型 | 默认值 | 必选 |
| ---------------------- | ---------------------------------------------------- | ------------------------------- | ---------- | ---- |
| type | 布局类型,需为 'indented' | 'indented' | - | ✓ |
| direction | 布局方向,根节点在左/右/中间,详见下方说明 | 'LR' \| 'RL' \| 'H' | 'LR' | |
| indent | 列间间距,支持固定值或函数 | number \| (d?: Node) => number | 20 | |
| getWidth | 获取每个节点宽度,仅 direction='H' 时生效 | (d?: Node) => number | - | |
| getHeight | 获取每个节点高度 | (d?: Node) => number | - | |
| getSide | 节点排布在根节点的左/右侧,设置后 direction='H' 失效 | (d?: Node) => 'left' \| 'right' | - | |
| dropCap | 每个节点的第一个子节点是否换行 | boolean | true | |
| isLayoutInvisibleNodes | 不可见节点是否参与布局(preLayout=true 时生效) | boolean | false | |
| nodeFilter | 参与该布局的节点 | (node: NodeData) => boolean | () => true | |
| preLayout | 使用前布局,在初始化元素前计算布局 | boolean | false | |
| enableWorker | 是否在 WebWorker 中运行布局 | boolean | - | |
| iterations | 迭代布局的迭代次数 | number | - | |
### 复杂类型说明
- **direction**
- `'LR'`:根节点在左,向右布局
<img src='https://gw.alipayobjects.com/mdn/rms_f8c6a0/afts/img/A*mq6YSIKrAt0AAAAAAAAAAABkARQnAQ' width=110 alt='LR'/>
- `'RL'`:根节点在右,向左布局
<img src='https://gw.alipayobjects.com/mdn/rms_f8c6a0/afts/img/A*VGEnRbpvxlUAAAAAAAAAAABkARQnAQ' width=90 alt='RL'/>
- `'H'`:根节点在中间,水平对称布局
<img src='https://gw.alipayobjects.com/mdn/rms_f8c6a0/afts/img/A*Vek6RqtUXNcAAAAAAAAAAABkARQnAQ' width=160 alt='H'/>
- **indent**
- 固定数值:所有层级缩进一致
- 函数:(d?: Node) => number,可根据节点自定义缩进
- 示例:
```js
(d) => {
if (d.parent?.id === 'testId') return d.parent.x + 50;
return 100;
};
```
- **getWidth/getHeight**
- 用于自定义每个节点的宽度/高度,常用于自适应内容
- 示例:
```js
(d) => (d.id === 'testId' ? 50 : 100);
```
- **getSide**
- 指定节点在根节点的哪一侧,仅 direction='H' 时生效
- 示例:
```js
(d) => (d.id === 'testId' ? 'left' : 'right');
```
## 示例代码
> 更多示例可参考 [在线 Demo](https://g6.antv.antgroup.com/examples/layout/indented)
### 子节点自动分布
<img src="https://mdn.alipayobjects.com/huamei_qa8qxu/afts/img/A*Kc63QoxgLNYAAAAAAAAAAAAADmJ7AQ/original" width="300" />
```js
import { Graph, treeToGraphData } from '@antv/g6';
fetch('https://gw.alipayobjects.com/os/antvdemo/assets/data/algorithm-category.json')
.then((res) => res.json())
.then((data) => {
const graph = new Graph({
container: 'container',
data: treeToGraphData(data),
autoFit: 'view',
layout: {
type: 'indented',
direction: 'H',
indent: 80,
getHeight: () => 16,
getWidth: () => 32,
},
});
graph.render();
});
```
### 子节点右侧分布
<img src="https://mdn.alipayobjects.com/huamei_qa8qxu/afts/img/A*3PioQ4TAMx8AAAAAAAAAAAAADmJ7AQ/original" width="300" />
```js
// ... 代码同上,layout.direction: 'LR'
```
### 子节点左侧分布
<img src="https://mdn.alipayobjects.com/huamei_qa8qxu/afts/img/A*o6uzQ5nmXJkAAAAAAAAAAAAADmJ7AQ/original" width="300" />
```js
// ... 代码同上,layout.direction: 'RL'
```
### 自定义子节点分布
<img src="https://mdn.alipayobjects.com/huamei_qa8qxu/afts/img/A*Kc63QoxgLNYAAAAAAAAAAAAADmJ7AQ/original" width="300" />
```js
layout: {
type: 'indented',
direction: 'H',
indent: 80,
getHeight: () => 16,
getWidth: () => 32,
getSide: (d) => {
if (d.id === 'Regression' || d.id === 'Classification') return 'left';
return 'right';
},
}
```
### 首子节点不换行
<img src="https://mdn.alipayobjects.com/huamei_qa8qxu/afts/img/A*bC-pRrO7srwAAAAAAAAAAAAADmJ7AQ/original" width="300" />
```js
layout: {
type: 'indented',
direction: 'LR',
indent: 80,
getHeight: () => 16,
getWidth: () => 32,
dropCap: false,
}
```
Layout Skill
packages/site/docs/manual/layout/MdsLayout.en.md anthropic-skill ~580 tokens---
title: MDS High-dimensional Data Dimensionality Reduction Layout
order: 17
---
# MDS High-dimensional Data Dimensionality Reduction Layout
## Overview
MDS (Multidimensional Scaling) is a classic dimensionality reduction algorithm. In G6, the MDS layout constructs a distance matrix between nodes and restores their relative distances in high-dimensional space as much as possible in 2D space. It is suitable for graph visualization scenarios that show similarity, distance, or structural relationships between nodes.
## Use Cases
- Data dimensionality reduction visualization
- Displaying distance relationships between nodes
## Configuration
```js
const graph = new Graph({
layout: {
type: 'mds',
center: [300, 300],
linkDistance: 100,
},
});
```
## Options
| Option | Description | Type | Default | Required |
| :--------------- | :------------------------------------ | :---------------- | :------------ | :------- |
| **type** | Layout type | `mds` | - | Yes |
| **center** | Center position of the layout | `[number,number]` | canvas center | No |
| **linkDistance** | Ideal length of edges (spring length) | `number` | 200 | No |
**center**
The center coordinates of the layout. All nodes will be symmetrically distributed around this point.
**linkDistance**
> number Default: 50
The ideal distance between nodes. The larger the value, the more dispersed the nodes.
## Code Example
```js | ob { inject: true }
import { Graph } from '@antv/g6';
const data = {
nodes: Array.from({ length: 25 }, (_, i) => ({
id: `node-${i}`,
data: {
value: Math.random() * 100,
},
})),
edges: Array.from({ length: 20 }, (_, i) => ({
id: `edge-${i}`,
source: `node-${Math.floor(Math.random() * 25)}`,
target: `node-${Math.floor(Math.random() * 25)}`,
})),
};
const graph = new Graph({
container: 'container',
width: 600,
height: 300,
autoFit: 'view',
data,
node: {
style: {
labelText: (d) => d.id,
},
},
layout: {
type: 'mds',
nodeSize: 32,
linkDistance: 100,
},
behaviors: ['drag-element', 'drag-canvas', 'zoom-canvas'],
});
graph.render();
```
Layout Skill
packages/site/docs/manual/layout/MdsLayout.zh.md anthropic-skill ~406 tokens---
title: 高维数据降维布局 MDS
order: 17
---
## 概述
MDS(多维尺度分析,Multidimensional Scaling)是一种经典的降维算法。在 G6 中,MDS 布局通过构造节点间的距离矩阵,在二维空间中尽可能还原它们在高维空间中的相对距离。适用于展示节点之间相似度、距离或结构关系的图可视化场景。
## 使用场景
- 数据降维可视化
- 展示节点之间的距离关系
## 配置方式
```js
const graph = new Graph({
layout: {
type: 'mds',
center: [300, 300],
linkDistance: 100,
},
});
```
## 配置项
| 配置项 | 描述 | 类型 | 默认值 | 必选 |
| :--------------- | :--------------------------------- | :---------------- | :------- | :--- |
| **type** | 布局类型 | `mds` | - | 是 |
| **center** | 布局的中心位置 | `[number,number]` | 画布中心 | 否 |
| **linkDistance** | 边的理想长度(弹簧未受力时的长度) | `number` | 200 | 否 |
**center**
布局的中心点坐标,所有节点会围绕该点对称分布。
**linkDistance**
> number Default: 50
节点之间的理想距离,越大则节点间距离越分散。
## 代码示例
```js | ob { inject: true }
import { Graph } from '@antv/g6';
const data = {
nodes: Array.from({ length: 25 }, (_, i) => ({
id: `node-${i}`,
data: {
value: Math.random() * 100,
},
})),
edges: Array.from({ length: 20 }, (_, i) => ({
id: `edge-${i}`,
source: `node-${Math.floor(Math.random() * 25)}`,
target: `node-${Math.floor(Math.random() * 25)}`,
})),
};
const graph = new Graph({
container: 'container',
width: 600,
height: 300,
autoFit: 'view',
data,
node: {
style: {
labelText: (d) => d.id,
},
},
layout: {
type: 'mds',
nodeSize: 32,
linkDistance: 100,
},
behaviors: ['drag-element', 'drag-canvas', 'zoom-canvas'],
});
graph.render();
```
Layout Skill
packages/site/docs/manual/layout/MindmapLayout.en.md anthropic-skill ~1,331 tokens---
title: Mindmap Tree
order: 18
---
## Overview
The mindmap tree layout is suitable for hierarchical layouts of tree structures, supporting expansion on both left and right sides. Nodes at the same depth will be placed on the same layer. Note: the layout **does** take node size into account. See more mindmap layout [examples](/en/examples#layout-mindmap) or [source code](https://github.com/antvis/hierarchy/blob/master/src/mindmap.js).
<img src='https://gw.alipayobjects.com/mdn/rms_f8c6a0/afts/img/A*J1l5RofvbP0AAAAAAAAAAABkARQnAQ' width=350 alt='img'/>
## Configuration
```js
const graph = new Graph({
layout: {
type: 'mindmap',
direction: 'H',
preLayout: false,
getHeight: () => 32,
getWidth: () => 32,
getVGap: () => 16,
getHGap: () => 72,
},
});
```
## Options
<img src="https://img.alicdn.com/imgextra/i4/O1CN014J5e691gxm5GSrwD2_!!6000000004209-0-tps-1163-832.jpg" width="400" alt="Mindmap tree options diagram" />
| Property | Description | Type | Default | Required |
| --------- | ------------------------------------------------------------------------------------------------------- | ----------------------------------- | ------- | -------- |
| type | Layout type | `mindmap` | - | ✓ |
| direction | Layout direction, [options](#direction) | `H` \| `LR` \| `RL` \| `TB` \| `BT` | `LR` | |
| getHeight | Function to calculate the height of each node | (d?: Node) => number | | ✓ |
| getWidth | Function to calculate the width of each node | (d?: Node) => number | | ✓ |
| getVGap | Vertical gap for each node. Note: the actual vertical gap between two nodes is twice the vgap | (d?: Node) => number | | |
| getHGap | Horizontal gap for each node. Note: the actual horizontal gap between two nodes is twice the hgap | (d?: Node) => number | | |
| getSide | Set whether the node is placed on the left or right of the root. Only effective when `direction` is `H` | (d?: Node) => string | | |
### direction
> `H` \| `LR` \| `RL` \| `TB` \| `BT` **Default:** `'LR'`
Tree layout direction
- `'H'`: horizontal — The children of the root node are divided into two parts and placed on the left and right sides of the root node. You can pass the `getSide` method to specify the left/right distribution logic for each node. If not provided, the first half will be placed on the right, and the second half on the left by default.
<img src='https://gw.alipayobjects.com/mdn/rms_f8c6a0/afts/img/A*J1l5RofvbP0AAAAAAAAAAABkARQnAQ' width=170 alt='Horizontal layout'/>
- `'LR' | 'TB'`: Children are placed on the right side of the root node.
<img src='https://img.alicdn.com/imgextra/i2/O1CN01SWsfai28ZmZu2ehyh_!!6000000007947-0-tps-1390-1254.jpg' width=150 alt='Vertical layout'/>
- `'RL'`: Children are placed on the left side of the root node.
<img src='https://img.alicdn.com/imgextra/i1/O1CN01DFh7iu26fcORrjGfT_!!6000000007689-0-tps-1396-1254.jpg' width=150 alt='Vertical layout'/>
- `BT`: Children are placed on the right side of the root node, then the entire graph is rotated 180° along the X axis.
<img src='https://img.alicdn.com/imgextra/i2/O1CN01zppRLx1Igmbtv4EyJ_!!6000000000923-0-tps-1388-1282.jpg' width=150 alt='Vertical layout'/>
### getWidth
> _(d?: Node) => number_
Width of each node
Example:
```javascript
(d) => {
// d is a node
if (d.id === 'testId') return 50;
return 100;
};
```
### getHeight
> _(d?: Node) => number_
Height of each node
Example:
```javascript
(d) => {
// d is a node
if (d.id === 'testId') return 50;
return 100;
};
```
### getHGap
> _(d?: Node) => number_
Horizontal gap for each node
Example:
```javascript
(d) => {
// d is a node
if (d.id === 'testId') return 50;
return 100;
};
```
### getVGap
> _(d?: Node) => number_
Vertical gap for each node
Example:
```javascript
(d) => {
// d is a node
if (d.id === 'testId') return 50;
return 100;
};
```
### getSide
> _(d?: Node) => string_
Set whether the node is placed on the left or right of the root. Note: only effective when `direction` is `H`. If not set, the first half of the children will be placed on the right, and the second half on the left by default. See [getSide auto calculation logic](https://github.com/antvis/hierarchy/blob/d786901874f59d96c47e2a5dfe17b373eefd72e3/src/layout/separate-root.js#L11).
Example:
```javascript
(d) => {
// d is a node
if (d.id === 'test-child-id') return 'right';
return 'left';
};
```
### Suitable Scenarios
- Data lineage graph: `direction='H'` is suitable for rendering upstream and downstream lineage of a specified node, with upstream on the left and downstream on the right of the central node.
- Mind map: Build custom mind map components.
Layout Skill
packages/site/docs/manual/layout/MindmapLayout.zh.md anthropic-skill ~993 tokens---
title: 脑图树 Mindmap
order: 18
---
## 概述
脑图树布局适用于树状结构的层次化布局,支持左右两侧展开,深度相同的节点将会被放置在同一层。需要注意:布局**会**考虑节点的大小。参考更多脑图布局[样例](/examples#layout-mindmap)或[源码](https://github.com/antvis/hierarchy/blob/master/src/mindmap.js)。
<img src='https://gw.alipayobjects.com/mdn/rms_f8c6a0/afts/img/A*J1l5RofvbP0AAAAAAAAAAABkARQnAQ' width=350 alt='img'/>
## 配置方式
```js
const graph = new Graph({
layout: {
type: 'mindmap',
direction: 'H',
preLayout: false,
getHeight: () => 32,
getWidth: () => 32,
getVGap: () => 16,
getHGap: () => 72,
},
});
```
## 配置项
<img src="https://img.alicdn.com/imgextra/i4/O1CN014J5e691gxm5GSrwD2_!!6000000004209-0-tps-1163-832.jpg" width="400" alt="脑图树配置项图解" />
| 属性 | 描述 | 类型 | 默认值 | 必选 |
| --------- | ----------------------------------------------------------------------------------------------------- | ----------------------------------- | ------ | ---- |
| type | 布局类型 | `mindmap` | - | ✓ |
| direction | 布局方向,[可选值](#direction) | `H` \| `LR` \| `RL` \| `TB` \| `BT` | `LR` | |
| getHeight | 计算每个节点的高度 | (d?: Node) => number | | ✓ |
| getWidth | 计算每个节点的宽度 | (d?: Node) => number | | ✓ |
| getVGap | 每个节点的垂直间隙,注意实际两个节点间的垂直间隙是2倍的vgap | (d?: Node) => number | | |
| getHGap | 每个节点的水平间隙,注意实际两个节点间的水平间隙是2倍的hgap | (d?: Node) => number | | |
| getSide | 设置节点排布在根节点的左侧/右侧,如未设置,则算法自动分配左侧/右侧。注意:该参数仅在`H`布局方向上生效 | (d?: Node) => string | | |
### direction
> `H` \| `LR` \| `RL` \| `TB` \| `BT` **Default:** `'LR'`
树布局的方向
- `'H'`:horizontal(水平)—— 根节点的子节点分成两部分横向放置在根节点左右两侧。可传入`getSide`方法指定每个节点的左右分布逻辑,不传则默认将前半部分放置在右侧,后半部分放置在左侧。
<img src='https://gw.alipayobjects.com/mdn/rms_f8c6a0/afts/img/A*J1l5RofvbP0AAAAAAAAAAABkARQnAQ' width=170 alt='水平布局'/>
- `'LR' | 'TB'`:将子节点排布在根节点的右侧;
<img src='https://img.alicdn.com/imgextra/i2/O1CN01SWsfai28ZmZu2ehyh_!!6000000007947-0-tps-1390-1254.jpg' width=150 alt='竖直布局'/>
- `'RL'`:将子节点排布在根节点的左侧;
<img src='https://img.alicdn.com/imgextra/i1/O1CN01DFh7iu26fcORrjGfT_!!6000000007689-0-tps-1396-1254.jpg' width=150 alt='竖直布局'/>
- `BT`:将子节点排布在根节点右侧,然后将整个图沿X轴旋转180°;
<img src='https://img.alicdn.com/imgextra/i2/O1CN01zppRLx1Igmbtv4EyJ_!!6000000000923-0-tps-1388-1282.jpg' width=150 alt='竖直布局'/>
### getWidth
> _(d?: Node) => number_
每个节点的宽度
示例:
```javascript
(d) => {
// d 是一个节点
if (d.id === 'testId') return 50;
return 100;
};
```
### getHeight
> _(d?: Node) => number_
每个节点的高度
示例:
```javascript
(d) => {
// d 是一个节点
if (d.id === 'testId') return 50;
return 100;
};
```
### getHGap
> _(d?: Node) => number_
每个节点的水平间隙
示例:
```javascript
(d) => {
// d 是一个节点
if (d.id === 'testId') return 50;
return 100;
};
```
### getVGap
> _(d?: Node) => number_
每个节点的垂直间隙
示例:
```javascript
(d) => {
// d 是一个节点
if (d.id === 'testId') return 50;
return 100;
};
```
### getSide
> _(d?: Node) => string_
设置节点排布在根节点的左侧/右侧。注意:该参数仅在`direction`为`H`时生效。如未设置,会默认将子节点前半部分放置在右侧,后半部分放置在左侧,参考[getSide自动计算逻辑](https://github.com/antvis/hierarchy/blob/d786901874f59d96c47e2a5dfe17b373eefd72e3/src/layout/separate-root.js#L11)。
示例:
```javascript
(d) => {
// d 是一个节点
if (d.id === 'test-child-id') return 'right';
return 'left';
};
```
### 布局适用场景
- 数据血缘图:`direction='H'`很适合渲染血缘图中查看指定节点的上下游血缘的场景,上游分布在中心节点的左侧,下游分布在右侧;
- 思维导图:构建自定义的思维导图组件。
Layout Skill
packages/site/docs/manual/layout/overview.en.md anthropic-skill ~1,595 tokens---
title: Layout Overview
order: 0
---
## Overview
Graph layout refers to the process of arranging elements in a graph according to certain rules, such as force-directed layout based on charge elasticity models, grid layout with sequential arrangement, and tree layout based on hierarchical structures.
<image width="300" src="https://mdn.alipayobjects.com/huamei_qa8qxu/afts/img/A*WIhlToluHaEAAAAAAAAAAAAADmJ7AQ/original" />
## Layout Types
G6 provides a variety of layout algorithms, allowing users to choose the appropriate one based on their needs:
- [AntVDagreLayout](/en/manual/layout/antv-dagre-layout): Custom layout based on dagre
- [CircularLayout](/en/manual/layout/circular-layout): Circular layout
- [ComboCombinedLayout](/en/manual/layout/combo-combined-layout): Layout suitable for combinations
- [ConcentricLayout](/en/manual/layout/concentric-layout): Concentric layout
- [D3Force3DLayout](/en/manual/layout/d3-force3-d-layout): [3D Force-directed](https://github.com/vasturiano/d3-force-3d) layout
- [D3ForceLayout](/en/manual/layout/d3-force-layout): Force-directed layout based on [D3](https://d3js.org/d3-force)
- [DagreLayout](/en/manual/layout/dagre-layout): [dagre](https://github.com/dagrejs/dagre) layout
- [FishboneLayout](/en/manual/layout/fishbone): Fishbone layout
- [ForceAtlas2Layout](/en/manual/layout/force-atlas2-layout): [ForceAtlas2](https://journals.plos.org/plosone/article?id=10.1371/journal.pone.0098679) layout
- [ForceLayout](/en/manual/layout/force-layout): Force-directed layout
- [FruchtermanLayout](/en/manual/layout/fruchterman-layout): [Fruchterman](https://www.sciencedirect.com/topics/computer-science/reingold-layout) layout
- [GridLayout](/en/manual/layout/grid-layout): Grid layout
- [MDSLayout](/en/manual/layout/mds-layout): High-dimensional data dimensionality reduction layout
- [RadialLayout](/en/manual/layout/radial-layout): Radial layout
- [RandomLayout](/en/manual/layout/random-layout): Random layout
- [SnakeLayout](/en/manual/layout/snake): Snake layout
- [CompactBoxLayout](/en/manual/layout/compact-box-layout): Compact tree layout
- [DendrogramLayout](/en/manual/layout/dendrogram-layout): Dendrogram layout
- [MindmapLayout](/en/manual/layout/mindmap-layout): Mindmap layout
- [IndentedLayout](/en/manual/layout/indented-layout): Indented tree layout
Among them, `CompactBox Layout`, `Dendrogram Layout`, `Mindmap Layout`, and `Indented Layout` are types of tree layouts suitable for tree-structured graphs.
## Register Layout
You can directly use built-in layouts, but if you want to use other layouts, you need to register them first:
```typescript
import { register, ExtensionCategory } from '@antv/g6';
import { CustomLayout } from 'package-name/or/path-to-your-custom-layout';
register(ExtensionCategory.LAYOUT, 'custom-layout', CustomLayout);
```
## Configure Layout
The `layout` configuration item can specify the graph's layout algorithm, for example:
```typescript
{
layout: {
// Specify the layout algorithm to use
type: 'force',
// Configuration items for the layout algorithm
gravity: 10
// ...
}
}
```
You can also use `graph.setLayout` to update the layout configuration after the graph is instantiated.
Starting from `5.1`, layout docs align their shared fields with `@antv/layout`. Besides each layout's own algorithm parameters, you should also pay attention to common options such as `width`, `height`, `center`, `enableWorker`, `node`, and `edge`.
## Layout Acceleration
G6 provides accelerated versions for some layout algorithms, including executing layout algorithms in Web Workers, providing [WASM](https://webassembly.org/) versions of layout algorithms, and GPU-accelerated layout algorithms. They can be used as follows:
### Execute Layout Algorithms in Web Workers
Except for tree layouts, all built-in layout algorithms in G6 support execution in Web Workers. Simply set `enableWorker` to `true`:
```typescript
{
layout: {
type: 'force',
enableWorker: true,
// ...
}
}
```
### Use WASM Version Layout Algorithms
Currently supported WASM version layout algorithms include: `Fruchterman Layout`, `ForceAtlas Layout`, `Force Layout`, `Dagre Layout`.
First, install `@antv/layout-wasm`:
```bash
npm install @antv/layout-wasm --save
```
Import and register the layout algorithm:
```typescript
import { register, Graph, ExtensionCategory } from '@antv/g6';
import { FruchtermanLayout, initThreads, supportsThreads } from '@antv/layout-wasm';
register(ExtensionCategory.LAYOUT, 'fruchterman-wasm', FruchtermanLayout);
```
Initialize threads:
```typescript
const supported = await supportsThreads();
const threads = await initThreads(supported);
```
Initialize the graph and pass in the layout configuration:
```typescript
const graph = new Graph({
// ... other configurations
layout: {
type: 'fruchterman-wasm',
threads,
// ... other configurations
},
});
```
### Use GPU-Accelerated Layout
Currently supported GPU-accelerated layout algorithms include: `Fruchterman Layout`, `GForce Layout`.
First, install `@antv/layout-gpu`:
```bash
npm install @antv/layout-gpu --save
```
Import and register the layout algorithm:
```typescript
import { register, Graph, ExtensionCategory } from '@antv/g6';
import { FruchtermanLayout } from '@antv/layout-gpu';
register(ExtensionCategory.LAYOUT, 'fruchterman-gpu', FruchtermanLayout);
```
Initialize the graph and pass in the layout configuration:
```typescript
const graph = new Graph({
// ... other configurations
layout: {
type: 'fruchterman-gpu',
// ... other configurations
},
});
```
## Execute Layout
Usually, after calling `graph.render()`, G6 will automatically execute the layout algorithm.
If you need to manually execute the layout algorithm, G6 provides the following APIs:
- [layout](/api/layout#graphlayoutlayoutoptions): Execute layout algorithm
- [setLayout](/api/layout#graphsetlayoutlayout): Set layout algorithm
- [stopLayout](/api/layout#graphstoplayout): Stop layout algorithm
## Custom Layout
If the built-in layout algorithms cannot meet your needs, you can customize layout algorithms. For details, please refer to [Custom Layout](/manual/layout/custom-layout).
If you are migrating layout configuration from G6 `5.0` to `5.1`, see [Upgrade from 5.0 to 5.1 (Layout)](/en/manual/whats-new/upgrade-to-5-1).
Layout Skill
packages/site/docs/manual/layout/overview.zh.md anthropic-skill ~1,084 tokens---
title: 布局总览
order: 0
---
## 概述
图布局是指将图中的元素按照一定的规则进行排列的过程,例如基于电荷弹性模型的力导向布局、逐次排布的网格布局、基于层次结构的树布局等。
<image width="300" src="https://mdn.alipayobjects.com/huamei_qa8qxu/afts/img/A*WIhlToluHaEAAAAAAAAAAAAADmJ7AQ/original" />
## 布局类型
G6 提供了多种布局算法,用户可以根据自己的需求选择合适的布局算法:
- [AntVDagreLayout](/manual/layout/antv-dagre-layout):基于 dagre 定制的布局
- [CircularLayout](/manual/layout/circular-layout):环形布局
- [ComboCombinedLayout](/manual/layout/combo-combined-layout):适用于存在组合的布局
- [ConcentricLayout](/manual/layout/concentric-layout):同心圆布局
- [D3Force3DLayout](/manual/layout/d3-force3-d-layout):[3D 力导向](https://github.com/vasturiano/d3-force-3d)布局
- [D3ForceLayout](/manual/layout/d3-force-layout):基于 [D3](https://d3js.org/d3-force) 的力导向布局
- [DagreLayout](/manual/layout/dagre-layout):[dagre](https://github.com/dagrejs/dagre) 布局
- [FishboneLayout](/manual/layout/fishbone):鱼骨布局
- [ForceAtlas2Layout](/manual/layout/force-atlas2-layout):[ForceAtlas2](https://journals.plos.org/plosone/article?id=10.1371/journal.pone.0098679) 布局
- [ForceLayout](/manual/layout/force-layout):力导向布局
- [FruchtermanLayout](/manual/layout/fruchterman-layout):[Fruchterman](https://www.sciencedirect.com/topics/computer-science/reingold-layout) 布局
- [GridLayout](/manual/layout/grid-layout):网格布局
- [MDSLayout](/manual/layout/mds-layout):高维数据降维算法布局
- [RadialLayout](/manual/layout/radial-layout):径向布局
- [RandomLayout](/manual/layout/random-layout):随机布局
- [SnakeLayout](/manual/layout/snake):蛇形布局
- [CompactBoxLayout](/manual/layout/compact-box-layout): 紧凑树布局
- [DendrogramLayout](/manual/layout/dendrogram-layout): 树状布局
- [MindmapLayout](/manual/layout/mindmap-layout): 思维导图布局
- [IndentedLayout](/manual/layout/indented-layout): 缩进树布局
其中 `CompactBox Layout`、`Dendrogram Layout`、`Mindmap Layout`、`Indented Layout` 是树布局的一种,适用于树状结构的图。
## 注册布局
你可以直接使用内置布局,如果想要使用其他布局,需要先进行注册:
```typescript
import { register, ExtensionCategory } from '@antv/g6';
import { CustomLayout } from 'package-name/or/path-to-your-custom-layout';
register(ExtensionCategory.LAYOUT, 'custom-layout', CustomLayout);
```
## 配置布局
通过 `layout` 配置项可以指定图的布局算法,例如:
```typescript
{
layout: {
// 指定要使用的布局算法
type: 'force',
// 布局算法的配置项
gravity: 10
// ...
}
}
```
也可在图实例化之后使用 `graph.setLayout` 来更新布局配置。
5.1 开始,布局文档中的通用字段已与 `@antvis/layout` 对齐。除了各布局自己的算法参数外,也建议同时关注 `width`、`height`、`center`、`enableWorker`、`node`、`edge` 等公共配置。
## 布局加速
G6 对一些布局算法提供了加速版本,包括:在 Web Worker 中执行布局算法、提供 [WASM](https://webassembly.org/) 版本的布局算法、GPU 加速的布局算法等。可按照下列方式使用:
### 在 Web Worker 中执行布局算法
除树布局外,G6 的所有内置布局算法都支持在 Web Worker 中执行。只需将 `enableWorker` 设置为 `true` 即可:
```typescript
{
layout: {
type: 'force',
enableWorker: true,
// ...
}
}
```
### 使用 WASM 版本布局算法
目前支持 WASM 版本的布局算法有:`Fruchterman Layout` `ForceAtlas Layout` `Force Layout` `Dagre Layout`。
首先安装 `@antv/layout-wasm`:
```bash
npm install @antv/layout-wasm --save
```
引入并注册布局算法:
```typescript
import { register, Graph, ExtensionCategory } from '@antv/g6';
import { FruchtermanLayout, initThreads, supportsThreads } from '@antv/layout-wasm';
register(ExtensionCategory.LAYOUT, 'fruchterman-wasm', FruchtermanLayout);
```
初始化线程:
```typescript
const supported = await supportsThreads();
const threads = await initThreads(supported);
```
初始化图并传入布局配置:
```typescript
const graph = new Graph({
// ... 其他配置
layout: {
type: 'fruchterman-wasm',
threads,
// ... 其他配置
},
});
```
### 使用 GPU 加速布局
目前支持 GPU 加速的布局算法有:`Fruchterman Layout` `GForce Layout`。
首先安装 `@antv/layout-gpu`:
```bash
npm install @antv/layout-gpu --save
```
引入并注册布局算法:
```typescript
import { register, Graph, ExtensionCategory } from '@antv/g6';
import { FruchtermanLayout } from '@antv/layout-gpu';
register(ExtensionCategory.LAYOUT, 'fruchterman-gpu', FruchtermanLayout);
```
初始化图并传入布局配置:
```typescript
const graph = new Graph({
// ... 其他配置
layout: {
type: 'fruchterman-gpu',
// ... 其他配置
},
});
```
## 执行布局
通常,在调用 `graph.render()` 后,G6 会自动执行布局算法。
如果需要手动执行布局算法,G6 提供了以下 API:
- [layout](/api/layout#graphlayoutlayoutoptions):执行布局算法
- [setLayout](/api/layout#graphsetlayoutlayout):设置布局算法
- [stopLayout](/api/layout#graphstoplayout):停止布局算法
## 自定义布局
如果内置布局算法无法满足需求,可以自定义布局算法,具体请参考[自定义布局](/manual/layout/custom-layout)。
如果你正在从 G6 `5.0` 的布局配置迁移到 `5.1`,可继续阅读 [从 5.0 升级到 5.1(布局)](/manual/whats-new/upgrade-to-5-1)。
Layout Skill
packages/site/docs/manual/layout/RadialLayout.en.md anthropic-skill ~1,242 tokens---
title: Radial Layout
order: 19
---
## Overview
Radial layout is a graph layout algorithm that arranges nodes in concentric circles by layers. It is commonly used to display hierarchical relationships, community structures, and more. This layout supports advanced features such as node overlap prevention and group sorting, making it suitable for visualizing various network structures.
## Use Cases
- Displaying hierarchical structures (e.g., organizational charts, family trees)
- Community structure analysis
- Scenarios that need to highlight the central node and its radiating relationships
- Complex networks requiring node grouping and sorting
## Online Demo
<embed src="@/common/api/layouts/radial.md"></embed>
## Configuration
```js
const graph = new Graph({
layout: {
type: 'radial',
nodeSize: 32,
unitRadius: 100,
linkDistance: 200,
},
// other configurations...
});
```
## Options
| Property | Description | Type | Default | Required |
| -------------------------- | --------------------------------------------------------------- | ------------------------------------------------ | -------- | -------- |
| type | Layout type | string | `radial` | ✓ |
| center | Center coordinates | [number, number] | - | |
| focusNode | Radiating center node | string \| Node \| null | null | |
| height | Canvas height | number | - | |
| width | Canvas width | number | - | |
| nodeSize | Node size (diameter) | number \| number[] \| ((nodeData: Node) => Size) | - | |
| nodeSpacing | Minimum node spacing (effective when preventing overlap) | number \| (nodeData: Node) => number | 10 | |
| linkDistance | Edge length | number | 50 | |
| unitRadius | Radius per circle; when null, automatically computed from space | number \| null | 100 | |
| maxIteration | Maximum number of iterations | number | 1000 | |
| maxPreventOverlapIteration | Max iterations for overlap prevention | number | 200 | |
| preventOverlap | Whether to prevent node overlap | boolean | false | |
| sortBy | Field or sorting function for nodes in the same layer | string \| ((nodeData: Node) => number \| string) | - | |
| sortStrength | Sorting strength for nodes in the same layer | number | 10 | |
| strictRadial | Strictly place nodes in the same layer on the same ring | boolean | true | |
## Code Example
### Basic Usage
```js
import { Graph } from '@antv/g6';
fetch('https://assets.antv.antgroup.com/g6/radial.json')
.then((res) => res.json())
.then((data) => {
const graph = new Graph({
container: 'container',
data,
autoFit: 'center',
layout: {
type: 'radial',
nodeSize: 32,
unitRadius: 100,
linkDistance: 200,
},
node: {
style: {
labelFill: '#fff',
labelPlacement: 'center',
labelText: (d) => d.id,
},
},
behaviors: ['drag-canvas', 'drag-element'],
});
graph.render();
});
```
Result:
<img src="https://mdn.alipayobjects.com/huamei_qa8qxu/afts/img/A*d3P-RK4YCDYAAAAAAAAAAAAADmJ7AQ/original" alt="Basic Radial Layout" style="max-width: 600px;" />
## Real Cases
- [Basic Radial Layout](/en/examples/layout/radial/#basic)
- [Strict Overlap Prevention Radial Layout](/en/examples/layout/radial/#strict-prevent-overlap)
- [Non-strict Overlap Prevention Radial Layout](/en/examples/layout/radial/#non-strict-prevent-overlap)
- [Cluster Sorting](/en/examples/layout/radial/#cluster-sort)
Layout Skill
packages/site/docs/manual/layout/RadialLayout.zh.md anthropic-skill ~960 tokens---
title: 径向布局 Radial
order: 19
---
## 概述
径向(Radial)布局是一种将节点以同心圆方式分层排列的图布局算法,常用于展示层级关系、社群结构等。该布局支持节点防重叠、分组排序等高级特性,适用于多种网络结构的可视化。
## 使用场景
- 展示层级结构(如组织架构、家谱等)
- 社群结构分析
- 需要突出中心节点及其辐射关系的场景
- 需要节点分组、排序的复杂网络
## 在线体验
<embed src="@/common/api/layouts/radial.md"></embed>
## 配置方式
```js
const graph = new Graph({
layout: {
type: 'radial',
nodeSize: 32,
unitRadius: 100,
linkDistance: 200,
},
// 其他配置...
});
```
## 配置项
| 属性 | 描述 | 类型 | 默认值 | 必选 |
| -------------------------- | -------------------------------------------- | ------------------------------------------------ | -------- | ---- |
| type | 布局类型 | string | `radial` | ✓ |
| center | 圆心坐标 | [number, number] | - | |
| focusNode | 辐射中心节点 | string \| Node \| null | null | |
| height | 画布高度 | number | - | |
| width | 画布宽度 | number | - | |
| nodeSize | 节点大小(直径) | number \| number[] \| ((nodeData: Node) => Size) | - | |
| nodeSpacing | 节点最小间距(防重叠时生效) | number \| (nodeData: Node) => number | 10 | |
| linkDistance | 边长度 | number | 50 | |
| unitRadius | 每圈半径;为 null 时按布局空间自动计算 | number \| null | 100 | |
| maxIteration | 最大迭代次数 | number | 1000 | |
| maxPreventOverlapIteration | 防重叠最大迭代次数 | number | 200 | |
| preventOverlap | 是否防止节点重叠 | boolean | false | |
| sortBy | 同层节点排序字段或排序函数 | string \| ((nodeData: Node) => number \| string) | - | |
| sortStrength | 同层节点排序强度 | number | 10 | |
| strictRadial | 是否严格每层节点在同一圆环上(防重叠时生效) | boolean | true | |
## 代码示例
### 基本用法
```js
import { Graph } from '@antv/g6';
fetch('https://assets.antv.antgroup.com/g6/radial.json')
.then((res) => res.json())
.then((data) => {
const graph = new Graph({
container: 'container',
data,
autoFit: 'center',
layout: {
type: 'radial',
nodeSize: 32,
unitRadius: 100,
linkDistance: 200,
},
node: {
style: {
labelFill: '#fff',
labelPlacement: 'center',
labelText: (d) => d.id,
},
},
behaviors: ['drag-canvas', 'drag-element'],
});
graph.render();
});
```
效果如下:
<img src="https://mdn.alipayobjects.com/huamei_qa8qxu/afts/img/A*d3P-RK4YCDYAAAAAAAAAAAAADmJ7AQ/original" alt="基本 Radial 辐射布局" style="max-width: 600px;" />
## 实际案例
- [基本 Radial 辐射布局](/examples/layout/radial/#basic)
- [防止节点重叠的严格辐射布局](/examples/layout/radial/#strict-prevent-overlap)
- [防止节点重叠的非严格辐射布局](/examples/layout/radial/#non-strict-prevent-overlap)
- [排序聚类](/examples/layout/radial/#cluster-sort)
Layout Skill
packages/site/docs/manual/layout/RandomLayout.en.md anthropic-skill ~598 tokens---
title: Random Layout
order: 20
---
## Overview
**Random Layout** is a layout method based on simple rules. Its core logic is to generate random coordinates for each node within a specified layout area (defined by the layout center, width, and height). The coordinates are completely random, and there is no node collision prevention.
## Use Cases
The use cases for random layout are very limited. It is only recommended for the following scenarios:
- **Initial Data Display**:
During early development, when debugging data loading logic or quickly verifying data structure, random layout can be used for preliminary validation.
For final business delivery, it is recommended to use layouts that better reflect business value, such as [AntVDagreLayout](/en/manual/layout/antv-dagre-layout), [ForceLayout](/en/manual/layout/force-layout), or [custom layouts](/en/manual/layout/custom-layout).
## Basic Usage
All other configurations use defaults (the layout width and height default to the entire canvas container).
```js
const graph = new Graph({
// other configurations
layout: {
type: 'random',
},
});
```
## Options
| Property | Description | Type | Default | Required |
| -------- | ------------- | -------------------------------------------- | ----------------------------------------- | -------- |
| type | Layout type | random | - | ✓ |
| center | Layout center | [number, number] \| [number, number, number] | [`layout width` / 2, `layout height` / 2] | |
| height | Layout height | number | canvas height | |
| width | Layout width | number | canvas width | |
## Example
```js | ob { pin: false, inject: true }
import { Graph } from '@antv/g6';
const graph = new Graph({
container: 'container',
width: 600,
height: 300,
autoFit: 'view',
data: {
nodes: Array.from({ length: 50 }).map((_, i) => ({
id: `${i}`,
})),
},
node: {
style: {
labelText: (d) => d.id,
},
},
behaviors: ['drag-canvas', 'zoom-canvas'],
layout: {
type: 'random',
},
});
graph.render();
```
Layout Skill
packages/site/docs/manual/layout/RandomLayout.zh.md anthropic-skill ~404 tokens---
title: 随机布局 Random
order: 20
---
## 概述
**随机布局(Random Layout)** 是一种基于简单规则的布局方式,其核心逻辑是为每个节点在指定布局区域(由布局中心点、宽度和高度定义)内生成随机坐标(完全随机,无节点防碰撞)。
## 使用场景
随机布局的使用场景非常局限,只推荐以下场景使用:
- **数据初步展示**:
在开发初期调试数据加载逻辑或需要快速验证数据结构的情况下,可使用随机布局先行验证
业务最终交付推荐使用更能体现业务价值的布局方式,比如 [AntVDagreLayout](/manual/layout/antv-dagre-layout) 、[ForceLayout](/manual/layout/force-layout) 或者[自定义布局](/manual/layout/custom-layout)等。
## 基本用法
其余均使用默认配置(布局宽高默认是整个画布容器)
```js
const graph = new Graph({
// 其他配置
layout: {
type: 'random',
},
});
```
## 配置项
| 属性 | 描述 | 类型 | 默认值 | 必选 |
| ------ | ---------- | -------------------------------------------- | -------------------------------- | ---- |
| type | 布局类型 | random | - | ✓ |
| center | 布局的中心 | [number, number] \| [number, number, number] | [`布局宽度` / 2, `布局高度` / 2] | |
| height | 布局的高度 | number | 画布高度 | |
| width | 布局的宽度 | number | 画布宽度 | |
## 示例
```js | ob { pin: false, inject: true }
import { Graph } from '@antv/g6';
const graph = new Graph({
container: 'container',
width: 600,
height: 300,
autoFit: 'view',
data: {
nodes: Array.from({ length: 50 }).map((_, i) => ({
id: `${i}`,
})),
},
node: {
style: {
labelText: (d) => d.id,
},
},
behaviors: ['drag-canvas', 'zoom-canvas'],
layout: {
type: 'random',
},
});
graph.render();
```
Layout Skill
packages/site/docs/manual/layout/Snake.en.md anthropic-skill ~1,145 tokens---
title: Snake Layout
order: 21
---
## Overview
Snake Layout is a special type of graph layout that can more efficiently display long chain structures in a limited space. Note that the graph data must ensure that nodes are linearly arranged from the source node to the sink node, forming a clear path.
Nodes are arranged in an S-shape: the first node is at the start of the first row, subsequent nodes are arranged to the right in the first row until the end. At the end of the row, the next row's nodes are arranged from right to left. This process repeats until all nodes are placed.
## Use Cases
Suitable for scenarios that require compact presentation of linear relationships:
- **Long process visualization**
Perfect for scenarios with many process steps, such as approval flows, production line procedures, logistics routes, etc.
- **Hierarchical structures in limited space**
When the hierarchy is too long but the canvas is limited, rows can be folded to save space. For example, API call dependencies (client → gateway → serviceA → serviceB → database, snake layout compresses 5 layers into 2 rows), or file directory trees (deeply nested folder structures, e.g., src/components/utils/helpers/..., using snake layout to fold subdirectories horizontally).
## Online Demo
<embed src="@/common/api/layouts/snake.md"></embed>
## Options
> If the layout has specific properties, they are listed below. For common layout options, see [Base Layout Options](/en/manual/layout/base-layout)
| Property | Description | Type | Default | Required |
| ----------------------- | ----------------------------------------------------------- | -------------------------------------------------- | ---------------------------------------------------------- | -------- |
| type | Layout type | snake | - | ✓ |
| [clockwise](#clockwise) | Whether nodes are arranged clockwise | boolean | true | |
| colGap | Gap size between columns | number | Automatically calculated by canvas width and total columns | |
| cols | Number of columns | number | 5 | |
| nodeSize | Node size | Size \| ((node: NodeData) => Size) | - | |
| padding | Padding, i.e., distance from layout area to canvas boundary | number \| number[] | 0 | |
| rowGap | Gap size between rows | number | Automatically calculated by canvas height and total rows | |
| sortBy | Node sorting method | (nodeA: NodeData, nodeB: NodeData) => -1 \| 0 \| 1 | Default is the path order in the graph | |
### clockwise
- When arranged clockwise, nodes start from the top left, the first row is arranged left to right, the second row right to left, and so on, forming an S-shaped path.
- When arranged counterclockwise, nodes start from the top right, the first row is arranged right to left, the second row left to right, and so on, forming a reversed S-shaped path.
## Real Cases
```js | ob { inject: true }
import { Graph } from '@antv/g6';
const data = {
nodes: new Array(16).fill(0).map((_, i) => ({ id: `${i}` })),
edges: new Array(15).fill(0).map((_, i) => ({ source: `${i}`, target: `${i + 1}` })),
};
const graph = new Graph({
container: 'container',
data,
node: {
style: {
labelFill: '#fff',
labelPlacement: 'center',
labelText: (d) => d.id,
},
},
layout: {
type: 'snake',
padding: 50,
},
behaviors: ['drag-canvas', 'drag-element'],
});
graph.render();
```
Layout Skill
packages/site/docs/manual/layout/Snake.zh.md anthropic-skill ~709 tokens---
title: 蛇形布局 Snake
order: 21
---
## 概览
蛇形布局(Snake Layout)是一种特殊的图形布局方式,能够在较小的空间内更有效地展示长链结构。需要注意的是,其图数据需要确保节点按照从源节点到汇节点的顺序进行线性排列,形成一条明确的路径。
节点按 S 字型排列,第一个节点位于第一行的起始位置,接下来的节点在第一行向右排列,直到行末尾。到达行末尾后,下一行的节点从右向左反向排列。这个过程重复进行,直到所有节点排列完毕。
## 使用场景
适合需要紧凑呈现线性关系的场景:
- **长流程可视化**
完美适配流程步骤过多的场景,如审批流程、生产线工序、物流运输路径等。
- **有限空间内的层级结构**
层级结构过长但画布受限,需通过折叠行节省空间,比如 API 调用依赖(客户端 → 网关 → 服务A → 服务B → 数据库,蛇形布局将 5 层压缩为 2 行)、文件目录树(深度嵌套的文件夹结构,如 src/components/utils/helpers/... ,用蛇形布局横向折叠子目录)。
## 在线体验
<embed src="@/common/api/layouts/snake.md"></embed>
## 配置项
> 如果布局有其特定的属性,我们将在下面列出。对于所有布局的通用属性,见[布局通用配置项](/manual/layout/base-layout)
| 属性 | 描述 | 类型 | 默认值 | 必选 |
| ----------------------- | ---------------------------------- | -------------------------------------------------- | -------------------------------------- | ---- |
| type | 布局类型 | snake | - | ✓ |
| [clockwise](#clockwise) | 节点排布方向是否顺时针 | boolean | true | |
| colGap | 节点列之间的间隙大小 | number | 默认将根据画布宽度和节点总列数自动计算 | |
| cols | 节点列数 | number | 5 | |
| nodeSize | 节点尺寸 | Size \| ((node: NodeData) => Size) | - | |
| padding | 内边距,即布局区域与画布边界的距离 | number \| number[] | 0 | |
| rowGap | 节点行之间的间隙大小 | number | 默认将根据画布高度和节点总行数自动计算 | |
| sortBy | 节点排序方法 | (nodeA: NodeData, nodeB: NodeData) => -1 \| 0 \| 1 | 默认按照在图中的路径顺序进行展示 | |
### clockwise
- 在顺时针排布时,节点从左上角开始,第一行从左到右排列,第二行从右到左排列,依次类推,形成 S 型路径。
- 在逆时针排布时,节点从右上角开始,第一行从右到左排列,第二行从左到右排列,依次类推,形成反向 S 型路径。
## 实际案例
```js | ob { inject: true }
import { Graph } from '@antv/g6';
const data = {
nodes: new Array(16).fill(0).map((_, i) => ({ id: `${i}` })),
edges: new Array(15).fill(0).map((_, i) => ({ source: `${i}`, target: `${i + 1}` })),
};
const graph = new Graph({
container: 'container',
data,
node: {
style: {
labelFill: '#fff',
labelPlacement: 'center',
labelText: (d) => d.id,
},
},
layout: {
type: 'snake',
padding: 50,
},
behaviors: ['drag-canvas', 'drag-element'],
});
graph.render();
```
Plugin Skill
packages/site/docs/manual/plugin/Background.en.md anthropic-skill ~1,151 tokens---
title: Background
order: 1
---
## Overview
Support setting a background image for the canvas to make the canvas more hierarchical and narrative.
## Use Cases
This plugin is mainly used for:
- Setting a unified brand background color or image for charts
- Distinguishing different functional areas through the background
- Enhancing the visual hierarchy and aesthetics of charts
## Basic Usage
Below is a simple example of initializing the Background plugin:
```js
const graph = new Graph({
plugins: [
{
type: 'background',
key: 'my-background', // Specify an identifier for the plugin for dynamic updates
backgroundColor: '#f0f2f5', // Set background color
backgroundImage: 'url(https://example.com/bg.png)', // Set background image
},
],
});
```
## Configuration Options
The configuration options for the Background plugin inherit all CSS style properties ([CSSStyleDeclaration](https://developer.mozilla.org/en-US/docs/Web/API/CSSStyleDeclaration)), so you can use any valid CSS property to configure the background. Here are some common configurations:
| Property | Description | Type | Default Value | Required |
| ------------------ | ----------------------------- | ------ | ----------------- | -------- |
| type | Plugin type | string | `background` | ✓ |
| key | Unique identifier for updates | string | - | |
| width | Background width | string | `100%` | |
| height | Background height | string | `100%` | |
| backgroundColor | Background color | string | - | |
| backgroundImage | Background image | string | - | |
| backgroundSize | Background size | string | `cover` | |
| backgroundPosition | Background position | string | - | |
| backgroundRepeat | Background repeat | string | - | |
| opacity | Background opacity | string | - | |
| transition | Transition animation | string | `background 0.5s` | |
| zIndex | Stacking order | string | -1 | |
> Note: The `zIndex` is set to -1 by default to prevent the background from covering other plugin DOM elements, such as grid lines.
## Code Examples
### Basic Background Color
```js | ob { inject: true }
import { Graph } from '@antv/g6';
const graph = new Graph({
container: 'container',
width: 300,
height: 200,
plugins: [
{
type: 'background',
width: '300px',
height: '200px',
backgroundColor: '#f0f2f5',
},
],
});
graph.render();
```
### Using a Background Image
```js | ob { inject: true }
import { Graph } from '@antv/g6';
const graph = new Graph({
container: 'container',
width: 300,
height: 200,
plugins: [
{
type: 'background',
width: '300px',
height: '200px',
backgroundImage:
'url(https://mdn.alipayobjects.com/huamei_qa8qxu/afts/img/A*0Qq0ToQm1rEAAAAAAAAAAAAADmJ7AQ/original)',
backgroundRepeat: 'no-repeat',
backgroundSize: 'cover',
opacity: 0.2,
},
],
});
graph.render();
```
### Gradient Background
```js | ob { inject: true }
import { Graph } from '@antv/g6';
const graph = new Graph({
container: 'container',
width: 300,
height: 200,
plugins: [
{
type: 'background',
width: '300px',
height: '200px',
background: 'linear-gradient(45deg, #1890ff, #722ed1)',
opacity: '0.8',
},
],
});
graph.render();
```
### Dynamically Updating the Background
```js
// Initial configuration
const graph = new Graph({
// Other configurations...
plugins: [
{
type: 'background',
key: 'my-background',
backgroundColor: '#f0f2f5',
},
],
});
// Subsequent updates
graph.updatePlugin({
key: 'my-background',
backgroundColor: '#e6f7ff',
transition: 'background 1s ease',
});
```
## FAQs
### 1. Background conflicts with other plugins?
By default, the `zIndex` of the background plugin is set to `-1` to ensure it is below other elements. If there are still conflicts, you can adjust the `zIndex` value:
```js
const graph = new Graph({
plugins: [
{
type: 'background',
zIndex: '-2', // Lower z-index to avoid conflicts
},
],
});
```
Plugin Skill
packages/site/docs/manual/plugin/Background.zh.md anthropic-skill ~901 tokens---
title: 背景 Background
order: 1
---
## 概述
支持为图画布设置一个背景图片,让画布更有层次感、叙事性。
## 使用场景
这一插件主要用于:
- 为图表设置统一的品牌背景色或图片
- 通过背景区分不同的功能区域
- 增强图表的视觉层次感和美观度
## 基本用法
以下是一个简单的 Background 插件初始化示例:
```js
const graph = new Graph({
plugins: [
{
type: 'background',
key: 'my-background', // 为插件指定标识符,方便动态更新
backgroundColor: '#f0f2f5', // 设置背景色
backgroundImage: 'url(https://example.com/bg.png)', // 设置背景图
},
],
});
```
## 配置项
Background 插件的配置项继承了所有 CSS 样式属性([CSSStyleDeclaration](https://developer.mozilla.org/zh-CN/docs/Web/API/CSSStyleDeclaration)),因此你可以使用任何合法的 CSS 属性来配置背景。以下是一些常用配置:
| 属性 | 描述 | 类型 | 默认值 | 必选 |
| ------------------ | ---------------------------- | ------ | ----------------- | ---- |
| type | 插件类型 | string | `background` | ✓ |
| key | 插件唯一标识符,用于后续更新 | string | - | |
| width | 背景宽度 | string | `100%` | |
| height | 背景高度 | string | `100%` | |
| backgroundColor | 背景颜色 | string | - | |
| backgroundImage | 背景图片 | string | - | |
| backgroundSize | 背景尺寸 | string | `cover` | |
| backgroundPosition | 背景位置 | string | - | |
| backgroundRepeat | 背景重复方式 | string | - | |
| opacity | 背景透明度 | string | - | |
| transition | 过渡动画 | string | `background 0.5s` | |
| zIndex | 层叠顺序 | string | -1 | |
> 注意:`zIndex` 默认为 -1,这是为了避免背景覆盖其他插件的 DOM 元素,如网格线。
## 代码示例
### 基础背景色
```js | ob { inject: true }
import { Graph } from '@antv/g6';
const graph = new Graph({
container: 'container',
width: 300,
height: 200,
plugins: [
{
type: 'background',
width: '300px',
height: '200px',
backgroundColor: '#f0f2f5',
},
],
});
graph.render();
```
### 使用背景图片
```js | ob { inject: true }
import { Graph } from '@antv/g6';
const graph = new Graph({
container: 'container',
width: 300,
height: 200,
plugins: [
{
type: 'background',
width: '300px',
height: '200px',
backgroundImage:
'url(https://mdn.alipayobjects.com/huamei_qa8qxu/afts/img/A*0Qq0ToQm1rEAAAAAAAAAAAAADmJ7AQ/original)',
backgroundRepeat: 'no-repeat',
backgroundSize: 'cover',
opacity: 0.2,
},
],
});
graph.render();
```
### 渐变背景
```js | ob { inject: true }
import { Graph } from '@antv/g6';
const graph = new Graph({
container: 'container',
width: 300,
height: 200,
plugins: [
{
type: 'background',
width: '300px',
height: '200px',
background: 'linear-gradient(45deg, #1890ff, #722ed1)',
opacity: '0.8',
},
],
});
graph.render();
```
### 动态更新背景
```js
// 初始化时配置
const graph = new Graph({
// 其他配置...
plugins: [
{
type: 'background',
key: 'my-background',
backgroundColor: '#f0f2f5',
},
],
});
// 后续更新
graph.updatePlugin({
key: 'my-background',
backgroundColor: '#e6f7ff',
transition: 'background 1s ease',
});
```
## 常见问题
### 1. 背景与其他插件冲突?
默认情况下,背景插件的 `zIndex` 设为 `-1`,以确保它位于其他元素之下。如果仍有冲突,可以调整 `zIndex` 值:
```js
const graph = new Graph({
plugins: [
{
type: 'background',
zIndex: '-2', // 降低 z-index 避免冲突
},
],
});
```
Plugin Skill
packages/site/docs/manual/plugin/BubbleSets.en.md anthropic-skill ~5,495 tokens---
title: BubbleSets
order: 2
---
## Overview
The BubbleSets plugin represents sets and their relationships by creating bubble shapes, helping users intuitively understand logical relationships such as intersections and unions between sets. It is a tool to enhance data visualization effects, especially suitable for displaying complex data set relationships.
## Use Cases
The BubbleSets plugin is mainly suitable for the following scenarios:
- Displaying relationships between sets (e.g., intersections, unions)
- Enhancing the expressive ability of data visualization
- Identifying specific sets of nodes or edges in complex network graphs
## Basic Usage
Below is a simple example of initializing the BubbleSets plugin:
```js
const graph = new Graph({
plugins: [
{
type: 'bubble-sets',
members: ['node1', 'node2'], // List of node IDs to be enclosed
label: true, // Whether to display labels
},
],
});
```
## Live Demo
<embed src="@/common/api/plugins/bubble-sets.md"></embed>
## Configuration Options
| Property | Description | Type | Default Value | Required |
| ------------------------ | ---------------------------------------------------------------------------------------- | -------------------------------------------------------------- | ------------- | -------- |
| type | Plugin type | string | `bubble-sets` | ✓ |
| key | Unique identifier for the plugin for subsequent updates | string | - | |
| members | Member elements, including nodes and edges, [example](#members) | string[] | - | ✓ |
| avoidMembers | Elements to avoid, not included when drawing contours (currently supports setting nodes) | string[] | - | |
| label | Whether to display labels | boolean | true | |
| labelPlacement | Label position | `left` \| `right` \| `top` \| `bottom` \| `center` \| `bottom` | `bottom` | |
| labelBackground | Whether to display background | boolean | false | |
| labelPadding | Label padding | number \| number[] | 0 | |
| labelCloseToPath | Whether the label is close to the contour, [example](#labelclosetopath) | boolean | true | |
| labelAutoRotate | Whether the label rotates with the contour, [example](#labelautorotate) | boolean | true | |
| labelOffsetX | Label x-axis offset | number | 0 | |
| labelOffsetY | Label y-axis offset | number | 0 | |
| labelMaxWidth | Maximum width of the text, automatically ellipsized if exceeded | number | - | |
| maxRoutingIterations | Maximum number of iterations for calculating paths between members | number | 100 | |
| maxMarchingIterations | Maximum number of iterations for calculating contours | number | 20 | |
| pixelGroup | Number of pixels per potential area group, used to improve speed | number | 4 | |
| edgeR0 | Edge radius parameter R0 | number | - | |
| edgeR1 | Edge radius parameter R1 | number | - | |
| nodeR0 | Node radius parameter R0 | number | - | |
| nodeR1 | Node radius parameter R1 | number | - | |
| morphBuffer | Morph buffer size | number | | |
| threshold | Threshold | number | - | |
| memberInfluenceFactor | Member influence factor | number | - | |
| edgeInfluenceFactor | Edge influence factor | number | - | |
| nonMemberInfluenceFactor | Non-member influence factor | number | - | |
| virtualEdges | Whether to use virtual edges | boolean | - | |
### members
Member elements, including nodes and edges.
```js
const graph = new Graph({
plugins: [
{
type: 'bubble-sets',
members: ['node-0', 'node-1', 'node-2'],
},
],
});
```
The effect is as follows:
```js | ob { pin: false, inject: true }
import { Graph } from '@antv/g6';
const graph = new Graph({
container: 'container',
width: 300,
height: 150,
autoFit: 'view',
data: {
nodes: [
{
id: 'node-0',
data: { cluster: 'a' },
style: { x: 555, y: 151 },
},
{
id: 'node-1',
data: { cluster: 'a' },
style: { x: 532, y: 323 },
},
{
id: 'node-2',
data: { cluster: 'a' },
style: { x: 473, y: 227 },
},
{
id: 'node-3',
data: { cluster: 'a' },
style: { x: 349, y: 212 },
},
{
id: 'node-4',
data: { cluster: 'b' },
style: { x: 234, y: 201 },
},
{
id: 'node-5',
data: { cluster: 'b' },
style: { x: 338, y: 333 },
},
{
id: 'node-6',
data: { cluster: 'b' },
style: { x: 365, y: 91 },
},
],
edges: [
{
id: 'edge-0',
source: 'node-0',
target: 'node-2',
},
{
id: 'edge-1',
source: 'node-1',
target: 'node-2',
},
{
id: 'edge-2',
source: 'node-2',
target: 'node-3',
},
{
id: 'edge-3',
source: 'node-3',
target: 'node-4',
},
{
id: 'edge-4',
source: 'node-3',
target: 'node-5',
},
{
id: 'edge-5',
source: 'node-3',
target: 'node-6',
},
],
},
behaviors: ['drag-canvas', 'zoom-canvas'],
plugins: [
{
type: 'bubble-sets',
key: 'bubble-sets-a',
members: ['node-0', 'node-1', 'node-2'],
},
],
});
graph.render();
```
### labelCloseToPath
Example: Do not let the label stick to the contour
```js
const graph = new Graph({
plugins: [
{
type: 'bubble-sets',
members: ['node-0', 'node-1', 'node-2', 'node-3'],
label: true, // Display label
labelText: 'cluster-a',
labelCloseToPath: false,
},
],
});
```
The effect is as follows:
```js | ob { pin: false, inject: true }
import { Graph } from '@antv/g6';
const graph = new Graph({
container: 'container',
width: 300,
height: 150,
autoFit: 'view',
data: {
nodes: [
{
id: 'node-0',
data: { cluster: 'a' },
style: { x: 555, y: 151 },
},
{
id: 'node-1',
data: { cluster: 'a' },
style: { x: 532, y: 323 },
},
{
id: 'node-2',
data: { cluster: 'a' },
style: { x: 473, y: 227 },
},
{
id: 'node-3',
data: { cluster: 'a' },
style: { x: 349, y: 212 },
},
{
id: 'node-4',
data: { cluster: 'b' },
style: { x: 234, y: 201 },
},
{
id: 'node-5',
data: { cluster: 'b' },
style: { x: 338, y: 333 },
},
{
id: 'node-6',
data: { cluster: 'b' },
style: { x: 365, y: 91 },
},
],
edges: [
{
id: 'edge-0',
source: 'node-0',
target: 'node-2',
},
{
id: 'edge-1',
source: 'node-1',
target: 'node-2',
},
{
id: 'edge-2',
source: 'node-2',
target: 'node-3',
},
{
id: 'edge-3',
source: 'node-3',
target: 'node-4',
},
{
id: 'edge-4',
source: 'node-3',
target: 'node-5',
},
{
id: 'edge-5',
source: 'node-3',
target: 'node-6',
},
],
},
plugins: [
{
key: 'bubble-sets-a',
type: 'bubble-sets',
members: ['node-0', 'node-1', 'node-2', 'node-3'],
label: true, // Display label
labelText: 'cluster-a',
labelCloseToPath: false,
},
],
behaviors: ['drag-canvas', 'zoom-canvas'],
});
graph.render();
```
### labelAutoRotate
Example: Do not let the label rotate with the contour
```js
const graph = new Graph({
plugins: [
{
type: 'bubble-sets',
members: ['node-0', 'node-1', 'node-2', 'node-3'],
label: true, // Display label
labelText: 'cluster-a',
labelAutoRotate: false,
},
],
});
```
The effect is as follows:
```js | ob { pin: false, inject: true }
import { Graph } from '@antv/g6';
const graph = new Graph({
container: 'container',
width: 300,
height: 150,
autoFit: 'view',
data: {
nodes: [
{
id: 'node-0',
data: { cluster: 'a' },
style: { x: 555, y: 151 },
},
{
id: 'node-1',
data: { cluster: 'a' },
style: { x: 532, y: 323 },
},
{
id: 'node-2',
data: { cluster: 'a' },
style: { x: 473, y: 227 },
},
{
id: 'node-3',
data: { cluster: 'a' },
style: { x: 349, y: 212 },
},
{
id: 'node-4',
data: { cluster: 'b' },
style: { x: 234, y: 201 },
},
{
id: 'node-5',
data: { cluster: 'b' },
style: { x: 338, y: 333 },
},
{
id: 'node-6',
data: { cluster: 'b' },
style: { x: 365, y: 91 },
},
],
edges: [
{
id: 'edge-0',
source: 'node-0',
target: 'node-2',
},
{
id: 'edge-1',
source: 'node-1',
target: 'node-2',
},
{
id: 'edge-2',
source: 'node-2',
target: 'node-3',
},
{
id: 'edge-3',
source: 'node-3',
target: 'node-4',
},
{
id: 'edge-4',
source: 'node-3',
target: 'node-5',
},
{
id: 'edge-5',
source: 'node-3',
target: 'node-6',
},
],
},
plugins: [
{
key: 'bubble-sets-a',
type: 'bubble-sets',
members: ['node-0', 'node-1', 'node-2', 'node-3'],
label: true, // Display label
labelText: 'cluster-a',
labelAutoRotate: false,
},
],
behaviors: ['drag-canvas', 'zoom-canvas'],
});
graph.render();
```
## Usage Examples
### Basic BubbleSets
The simplest way is to use the preset configuration directly:
```js
const graph = new Graph({
plugins: [
{
type: 'bubble-sets',
members: ['node-0', 'node-1', 'node-2', 'node-3'],
},
],
});
```
The effect is as follows:
```js | ob { pin: false, inject: true }
import { Graph } from '@antv/g6';
const graph = new Graph({
container: 'container',
width: 300,
height: 150,
autoFit: 'center',
data: {
nodes: [
{
id: 'node-0',
data: { cluster: 'a' },
style: { x: 555, y: 151 },
},
{
id: 'node-1',
data: { cluster: 'a' },
style: { x: 532, y: 323 },
},
{
id: 'node-2',
data: { cluster: 'a' },
style: { x: 473, y: 227 },
},
{
id: 'node-3',
data: { cluster: 'a' },
style: { x: 349, y: 212 },
},
{
id: 'node-4',
data: { cluster: 'b' },
style: { x: 234, y: 201 },
},
{
id: 'node-5',
data: { cluster: 'b' },
style: { x: 338, y: 333 },
},
{
id: 'node-6',
data: { cluster: 'b' },
style: { x: 365, y: 91 },
},
],
edges: [
{
id: 'edge-0',
source: 'node-0',
target: 'node-2',
},
{
id: 'edge-1',
source: 'node-1',
target: 'node-2',
},
{
id: 'edge-2',
source: 'node-2',
target: 'node-3',
},
{
id: 'edge-3',
source: 'node-3',
target: 'node-4',
},
{
id: 'edge-4',
source: 'node-3',
target: 'node-5',
},
{
id: 'edge-5',
source: 'node-3',
target: 'node-6',
},
],
},
behaviors: ['drag-canvas', 'zoom-canvas'],
plugins: [
{
type: 'bubble-sets',
key: 'bubble-sets-a',
members: ['node-0', 'node-1', 'node-2', 'node-3'],
},
],
});
graph.render();
```
### Custom BubbleSets Style
```js
const graph = new Graph({
plugins: [
{
type: 'bubble-sets',
members: ['node-0', 'node-1', 'node-2', 'node-3'],
fill: '#7e3feb', // Bubble fill color
fillOpacity: 0.1, // Fill opacity
stroke: '#7e3feb', // Border color
strokeOpacity: 1, // Border opacity
},
],
});
```
The effect is as follows:
```js | ob { pin: false, inject: true }
import { Graph } from '@antv/g6';
const graph = new Graph({
container: 'container',
width: 300,
height: 150,
autoFit: 'center',
data: {
nodes: [
{
id: 'node-0',
data: { cluster: 'a' },
style: { x: 555, y: 151 },
},
{
id: 'node-1',
data: { cluster: 'a' },
style: { x: 532, y: 323 },
},
{
id: 'node-2',
data: { cluster: 'a' },
style: { x: 473, y: 227 },
},
{
id: 'node-3',
data: { cluster: 'a' },
style: { x: 349, y: 212 },
},
{
id: 'node-4',
data: { cluster: 'b' },
style: { x: 234, y: 201 },
},
{
id: 'node-5',
data: { cluster: 'b' },
style: { x: 338, y: 333 },
},
{
id: 'node-6',
data: { cluster: 'b' },
style: { x: 365, y: 91 },
},
],
edges: [
{
id: 'edge-0',
source: 'node-0',
target: 'node-2',
},
{
id: 'edge-1',
source: 'node-1',
target: 'node-2',
},
{
id: 'edge-2',
source: 'node-2',
target: 'node-3',
},
{
id: 'edge-3',
source: 'node-3',
target: 'node-4',
},
{
id: 'edge-4',
source: 'node-3',
target: 'node-5',
},
{
id: 'edge-5',
source: 'node-3',
target: 'node-6',
},
],
},
plugins: [
{
type: 'bubble-sets',
members: ['node-0', 'node-1', 'node-2', 'node-3'],
fill: '#7e3feb', // Bubble fill color
fillOpacity: 0.1, // Fill opacity
stroke: '#7e3feb', // Border color
strokeOpacity: 1, // Border opacity
},
],
behaviors: ['drag-canvas', 'zoom-canvas'],
});
graph.render();
```
### Label Configuration
You can configure the position, background, offset, and other properties of the label to enhance the visualization effect.
```js
const graph = new Graph({
plugins: [
{
type: 'bubble-sets',
members: ['node-0', 'node-1', 'node-2', 'node-3'],
label: true, // Display label
labelPlacement: 'top', // Label position
labelBackground: true, // Display label background
labelPadding: 5, // Label padding
},
],
});
```
The effect is as follows:
```js | ob { pin: false, inject: true }
import { Graph } from '@antv/g6';
const graph = new Graph({
container: 'container',
width: 300,
height: 150,
autoFit: 'center',
data: {
nodes: [
{
id: 'node-0',
data: { cluster: 'a' },
style: { x: 555, y: 151 },
},
{
id: 'node-1',
data: { cluster: 'a' },
style: { x: 532, y: 323 },
},
{
id: 'node-2',
data: { cluster: 'a' },
style: { x: 473, y: 227 },
},
{
id: 'node-3',
data: { cluster: 'a' },
style: { x: 349, y: 212 },
},
{
id: 'node-4',
data: { cluster: 'b' },
style: { x: 234, y: 201 },
},
{
id: 'node-5',
data: { cluster: 'b' },
style: { x: 338, y: 333 },
},
{
id: 'node-6',
data: { cluster: 'b' },
style: { x: 365, y: 91 },
},
],
edges: [
{
id: 'edge-0',
source: 'node-0',
target: 'node-2',
},
{
id: 'edge-1',
source: 'node-1',
target: 'node-2',
},
{
id: 'edge-2',
source: 'node-2',
target: 'node-3',
},
{
id: 'edge-3',
source: 'node-3',
target: 'node-4',
},
{
id: 'edge-4',
source: 'node-3',
target: 'node-5',
},
{
id: 'edge-5',
source: 'node-3',
target: 'node-6',
},
],
},
plugins: [
{
key: 'bubble-sets-a',
type: 'bubble-sets',
members: ['node-0', 'node-1', 'node-2', 'node-3'],
label: true, // Display label
labelText: 'cluster-a',
labelPlacement: 'top', // Label position
labelBackground: true, // Display label background
labelPadding: 5, // Label padding
},
],
behaviors: ['drag-canvas', 'zoom-canvas'],
});
graph.render();
```
## Practical Examples
```js | ob { inject: true }
import { Graph } from '@antv/g6';
fetch('https://assets.antv.antgroup.com/g6/collection.json')
.then((res) => res.json())
.then((data) => {
const groupedNodesByCluster = data.nodes.reduce((acc, node) => {
const cluster = node.data.cluster;
acc[cluster] ||= [];
acc[cluster].push(node.id);
return acc;
}, {});
const createStyle = (baseColor) => ({
fill: baseColor,
stroke: baseColor,
labelFill: '#fff',
labelPadding: 2,
labelBackgroundFill: baseColor,
labelBackgroundRadius: 5,
});
const graph = new Graph({
container: 'container',
data,
behaviors: ['zoom-canvas', 'drag-canvas', 'drag-element'],
node: {
palette: { field: 'cluster' },
},
layout: {
type: 'force',
preventOverlap: true,
linkDistance: (d) => {
if (d.source === 'node0' || d.target === 'node0') {
return 200;
}
return 80;
},
},
plugins: [
{
key: 'bubble-sets-a',
type: 'bubble-sets',
members: groupedNodesByCluster['a'],
labelText: 'cluster-a',
...createStyle('#1783FF'),
},
{
key: 'bubble-sets-b',
type: 'bubble-sets',
members: groupedNodesByCluster['b'],
labelText: 'cluster-b',
...createStyle('#00C9C9'),
},
{
key: 'bubble-sets-c',
type: 'bubble-sets',
members: groupedNodesByCluster['c'],
labelText: 'cluster-c',
...createStyle('#F08F56'),
},
{
key: 'bubble-sets-d',
type: 'bubble-sets',
members: groupedNodesByCluster['d'],
labelText: 'cluster-d',
...createStyle('#D580FF'),
},
],
autoFit: 'center',
});
graph.render();
});
```
Plugin Skill
packages/site/docs/manual/plugin/BubbleSets.zh.md anthropic-skill ~4,955 tokens---
title: 气泡集 BubbleSets
order: 2
---
## 概述
BubbleSets 插件通过创建气泡形状来表示集合及其关系,帮助用户直观地理解集合间的交集、并集等逻辑关系。它是一种增强数据可视化效果的工具,特别适用于展示复杂的数据集合关系。
## 使用场景
BubbleSets 插件主要适用于以下场景:
- 展示集合间的关系(如交集、并集)
- 增强数据可视化的表达能力
- 在复杂网络图中标识特定节点或边的集合
## 基本用法
以下是一个简单的 BubbleSets 插件初始化示例:
```js
const graph = new Graph({
plugins: [
{
type: 'bubble-sets',
members: ['node1', 'node2'], // 需要包裹的节点 ID 列表
label: true, // 是否显示标签
},
],
});
```
## 在线体验
<embed src="@/common/api/plugins/bubble-sets.md"></embed>
## 配置项
| 属性 | 描述 | 类型 | 默认值 | 必选 |
| ------------------------ | ---------------------------------------------------------------- | -------------------------------------------------------------- | ------------- | ---- |
| type | 插件类型 | string | `bubble-sets` | ✓ |
| key | 插件唯一标识符,用于后续更新 | string | - | |
| members | 成员元素,包括节点和边,[示例](#members) | string[] | - | ✓ |
| avoidMembers | 需要避开的元素,在绘制轮廓时不会包含这些元素(目前支持设置节点) | string[] | - | |
| label | 是否显示标签 | boolean | true | |
| labelPlacement | 标签位置 | `left` \| `right` \| `top` \| `bottom` \| `center` \| `bottom` | `bottom` | |
| labelBackground | 是否显示背景 | boolean | false | |
| labelPadding | 标签内边距 | number \| number[] | 0 | |
| labelCloseToPath | 标签是否贴合轮廓,[示例](#labelclosetopath) | boolean | true | |
| labelAutoRotate | 标签是否跟随轮廓旋转,[示例](#labelautorotate) | boolean | true | |
| labelOffsetX | 标签 x 轴偏移量 | number | 0 | |
| labelOffsetY | 标签 y 轴偏移量 | number | 0 | |
| labelMaxWidth | 文本的最大宽度,超出会自动省略 | number | - | |
| maxRoutingIterations | 计算成员之间路径的最大迭代次数 | number | 100 | |
| maxMarchingIterations | 计算轮廓的最大迭代次数 | number | 20 | |
| pixelGroup | 每个潜在区域组的像素数,用于提高速度 | number | 4 | |
| edgeR0 | 边的半径参数 R0 | number | - | |
| edgeR1 | 边的半径参数 R1 | number | - | |
| nodeR0 | 节点的半径参数 R0 | number | - | |
| nodeR1 | 节点的半径参数 R1 | number | - | |
| morphBuffer | 形态缓冲区大小 | number | | |
| threshold | 阈值 | number | - | |
| memberInfluenceFactor | 成员影响因子 | number | - | |
| edgeInfluenceFactor | 边影响因子 | number | - | |
| nonMemberInfluenceFactor | 非成员影响因子 | number | - | |
| virtualEdges | 是否使用虚拟边 | boolean | - | |
### members
成员元素,包括节点和边。
```js
const graph = new Graph({
plugins: [
{
type: 'bubble-sets',
members: ['node-0', 'node-1', 'node-2'],
},
],
});
```
效果如下:
```js | ob { pin: false, inject: true }
import { Graph } from '@antv/g6';
const graph = new Graph({
container: 'container',
width: 300,
height: 150,
autoFit: 'view',
data: {
nodes: [
{
id: 'node-0',
data: { cluster: 'a' },
style: { x: 555, y: 151 },
},
{
id: 'node-1',
data: { cluster: 'a' },
style: { x: 532, y: 323 },
},
{
id: 'node-2',
data: { cluster: 'a' },
style: { x: 473, y: 227 },
},
{
id: 'node-3',
data: { cluster: 'a' },
style: { x: 349, y: 212 },
},
{
id: 'node-4',
data: { cluster: 'b' },
style: { x: 234, y: 201 },
},
{
id: 'node-5',
data: { cluster: 'b' },
style: { x: 338, y: 333 },
},
{
id: 'node-6',
data: { cluster: 'b' },
style: { x: 365, y: 91 },
},
],
edges: [
{
id: 'edge-0',
source: 'node-0',
target: 'node-2',
},
{
id: 'edge-1',
source: 'node-1',
target: 'node-2',
},
{
id: 'edge-2',
source: 'node-2',
target: 'node-3',
},
{
id: 'edge-3',
source: 'node-3',
target: 'node-4',
},
{
id: 'edge-4',
source: 'node-3',
target: 'node-5',
},
{
id: 'edge-5',
source: 'node-3',
target: 'node-6',
},
],
},
behaviors: ['drag-canvas', 'zoom-canvas'],
plugins: [
{
type: 'bubble-sets',
key: 'bubble-sets-a',
members: ['node-0', 'node-1', 'node-2'],
},
],
});
graph.render();
```
### labelCloseToPath
示例:不让 label 贴合轮廓
```js
const graph = new Graph({
plugins: [
{
type: 'bubble-sets',
members: ['node-0', 'node-1', 'node-2', 'node-3'],
label: true, // 显示标签
labelText: 'cluster-a',
labelCloseToPath: false,
},
],
});
```
效果如下:
```js | ob { pin: false, inject: true }
import { Graph } from '@antv/g6';
const graph = new Graph({
container: 'container',
width: 300,
height: 150,
autoFit: 'view',
data: {
nodes: [
{
id: 'node-0',
data: { cluster: 'a' },
style: { x: 555, y: 151 },
},
{
id: 'node-1',
data: { cluster: 'a' },
style: { x: 532, y: 323 },
},
{
id: 'node-2',
data: { cluster: 'a' },
style: { x: 473, y: 227 },
},
{
id: 'node-3',
data: { cluster: 'a' },
style: { x: 349, y: 212 },
},
{
id: 'node-4',
data: { cluster: 'b' },
style: { x: 234, y: 201 },
},
{
id: 'node-5',
data: { cluster: 'b' },
style: { x: 338, y: 333 },
},
{
id: 'node-6',
data: { cluster: 'b' },
style: { x: 365, y: 91 },
},
],
edges: [
{
id: 'edge-0',
source: 'node-0',
target: 'node-2',
},
{
id: 'edge-1',
source: 'node-1',
target: 'node-2',
},
{
id: 'edge-2',
source: 'node-2',
target: 'node-3',
},
{
id: 'edge-3',
source: 'node-3',
target: 'node-4',
},
{
id: 'edge-4',
source: 'node-3',
target: 'node-5',
},
{
id: 'edge-5',
source: 'node-3',
target: 'node-6',
},
],
},
plugins: [
{
key: 'bubble-sets-a',
type: 'bubble-sets',
members: ['node-0', 'node-1', 'node-2', 'node-3'],
label: true, // 显示标签
labelText: 'cluster-a',
labelCloseToPath: false,
},
],
behaviors: ['drag-canvas', 'zoom-canvas'],
});
graph.render();
```
### labelAutoRotate
示例:不让label标签跟随轮廓旋转
```js
const graph = new Graph({
plugins: [
{
type: 'bubble-sets',
members: ['node-0', 'node-1', 'node-2', 'node-3'],
label: true, // 显示标签
labelText: 'cluster-a',
labelAutoRotate: false,
},
],
});
```
效果如下:
```js | ob { pin: false, inject: true }
import { Graph } from '@antv/g6';
const graph = new Graph({
container: 'container',
width: 300,
height: 150,
autoFit: 'view',
data: {
nodes: [
{
id: 'node-0',
data: { cluster: 'a' },
style: { x: 555, y: 151 },
},
{
id: 'node-1',
data: { cluster: 'a' },
style: { x: 532, y: 323 },
},
{
id: 'node-2',
data: { cluster: 'a' },
style: { x: 473, y: 227 },
},
{
id: 'node-3',
data: { cluster: 'a' },
style: { x: 349, y: 212 },
},
{
id: 'node-4',
data: { cluster: 'b' },
style: { x: 234, y: 201 },
},
{
id: 'node-5',
data: { cluster: 'b' },
style: { x: 338, y: 333 },
},
{
id: 'node-6',
data: { cluster: 'b' },
style: { x: 365, y: 91 },
},
],
edges: [
{
id: 'edge-0',
source: 'node-0',
target: 'node-2',
},
{
id: 'edge-1',
source: 'node-1',
target: 'node-2',
},
{
id: 'edge-2',
source: 'node-2',
target: 'node-3',
},
{
id: 'edge-3',
source: 'node-3',
target: 'node-4',
},
{
id: 'edge-4',
source: 'node-3',
target: 'node-5',
},
{
id: 'edge-5',
source: 'node-3',
target: 'node-6',
},
],
},
plugins: [
{
key: 'bubble-sets-a',
type: 'bubble-sets',
members: ['node-0', 'node-1', 'node-2', 'node-3'],
label: true, // 显示标签
labelText: 'cluster-a',
labelAutoRotate: false,
},
],
behaviors: ['drag-canvas', 'zoom-canvas'],
});
graph.render();
```
## 使用示例
### 基础 BubbleSets
最简单的方式是直接使用预设配置:
```js
const graph = new Graph({
plugins: [
{
type: 'bubble-sets',
members: ['node-0', 'node-1', 'node-2', 'node-3'],
},
],
});
```
效果如下:
```js | ob { pin: false, inject: true }
import { Graph } from '@antv/g6';
const graph = new Graph({
container: 'container',
width: 300,
height: 150,
autoFit: 'center',
data: {
nodes: [
{
id: 'node-0',
data: { cluster: 'a' },
style: { x: 555, y: 151 },
},
{
id: 'node-1',
data: { cluster: 'a' },
style: { x: 532, y: 323 },
},
{
id: 'node-2',
data: { cluster: 'a' },
style: { x: 473, y: 227 },
},
{
id: 'node-3',
data: { cluster: 'a' },
style: { x: 349, y: 212 },
},
{
id: 'node-4',
data: { cluster: 'b' },
style: { x: 234, y: 201 },
},
{
id: 'node-5',
data: { cluster: 'b' },
style: { x: 338, y: 333 },
},
{
id: 'node-6',
data: { cluster: 'b' },
style: { x: 365, y: 91 },
},
],
edges: [
{
id: 'edge-0',
source: 'node-0',
target: 'node-2',
},
{
id: 'edge-1',
source: 'node-1',
target: 'node-2',
},
{
id: 'edge-2',
source: 'node-2',
target: 'node-3',
},
{
id: 'edge-3',
source: 'node-3',
target: 'node-4',
},
{
id: 'edge-4',
source: 'node-3',
target: 'node-5',
},
{
id: 'edge-5',
source: 'node-3',
target: 'node-6',
},
],
},
behaviors: ['drag-canvas', 'zoom-canvas'],
plugins: [
{
type: 'bubble-sets',
key: 'bubble-sets-a',
members: ['node-0', 'node-1', 'node-2', 'node-3'],
},
],
});
graph.render();
```
### 自定义 BubbleSets 样式
```js
const graph = new Graph({
plugins: [
{
type: 'bubble-sets',
members: ['node-0', 'node-1', 'node-2', 'node-3'],
fill: '#7e3feb', // 气泡填充颜色
fillOpacity: 0.1, // 填充透明度
stroke: '#7e3feb', // 边框颜色
strokeOpacity: 1, // 边框透明度
},
],
});
```
效果如下:
```js | ob { pin: false, inject: true }
import { Graph } from '@antv/g6';
const graph = new Graph({
container: 'container',
width: 300,
height: 150,
autoFit: 'center',
data: {
nodes: [
{
id: 'node-0',
data: { cluster: 'a' },
style: { x: 555, y: 151 },
},
{
id: 'node-1',
data: { cluster: 'a' },
style: { x: 532, y: 323 },
},
{
id: 'node-2',
data: { cluster: 'a' },
style: { x: 473, y: 227 },
},
{
id: 'node-3',
data: { cluster: 'a' },
style: { x: 349, y: 212 },
},
{
id: 'node-4',
data: { cluster: 'b' },
style: { x: 234, y: 201 },
},
{
id: 'node-5',
data: { cluster: 'b' },
style: { x: 338, y: 333 },
},
{
id: 'node-6',
data: { cluster: 'b' },
style: { x: 365, y: 91 },
},
],
edges: [
{
id: 'edge-0',
source: 'node-0',
target: 'node-2',
},
{
id: 'edge-1',
source: 'node-1',
target: 'node-2',
},
{
id: 'edge-2',
source: 'node-2',
target: 'node-3',
},
{
id: 'edge-3',
source: 'node-3',
target: 'node-4',
},
{
id: 'edge-4',
source: 'node-3',
target: 'node-5',
},
{
id: 'edge-5',
source: 'node-3',
target: 'node-6',
},
],
},
plugins: [
{
type: 'bubble-sets',
members: ['node-0', 'node-1', 'node-2', 'node-3'],
fill: '#7e3feb', // 气泡填充颜色
fillOpacity: 0.1, // 填充透明度
stroke: '#7e3feb', // 边框颜色
strokeOpacity: 1, // 边框透明度
},
],
behaviors: ['drag-canvas', 'zoom-canvas'],
});
graph.render();
```
### 标签配置
您可以配置标签的位置、背景、偏移量等属性,以增强可视化效果。
```js
const graph = new Graph({
plugins: [
{
type: 'bubble-sets',
members: ['node-0', 'node-1', 'node-2', 'node-3'],
label: true, // 显示标签
labelPlacement: 'top', // 标签位置
labelBackground: true, // 显示标签背景
labelPadding: 5, // 标签内边距
},
],
});
```
效果如下:
```js | ob { pin: false, inject: true }
import { Graph } from '@antv/g6';
const graph = new Graph({
container: 'container',
width: 300,
height: 150,
autoFit: 'center',
data: {
nodes: [
{
id: 'node-0',
data: { cluster: 'a' },
style: { x: 555, y: 151 },
},
{
id: 'node-1',
data: { cluster: 'a' },
style: { x: 532, y: 323 },
},
{
id: 'node-2',
data: { cluster: 'a' },
style: { x: 473, y: 227 },
},
{
id: 'node-3',
data: { cluster: 'a' },
style: { x: 349, y: 212 },
},
{
id: 'node-4',
data: { cluster: 'b' },
style: { x: 234, y: 201 },
},
{
id: 'node-5',
data: { cluster: 'b' },
style: { x: 338, y: 333 },
},
{
id: 'node-6',
data: { cluster: 'b' },
style: { x: 365, y: 91 },
},
],
edges: [
{
id: 'edge-0',
source: 'node-0',
target: 'node-2',
},
{
id: 'edge-1',
source: 'node-1',
target: 'node-2',
},
{
id: 'edge-2',
source: 'node-2',
target: 'node-3',
},
{
id: 'edge-3',
source: 'node-3',
target: 'node-4',
},
{
id: 'edge-4',
source: 'node-3',
target: 'node-5',
},
{
id: 'edge-5',
source: 'node-3',
target: 'node-6',
},
],
},
plugins: [
{
key: 'bubble-sets-a',
type: 'bubble-sets',
members: ['node-0', 'node-1', 'node-2', 'node-3'],
label: true, // 显示标签
labelText: 'cluster-a',
labelPlacement: 'top', // 标签位置
labelBackground: true, // 显示标签背景
labelPadding: 5, // 标签内边距
},
],
behaviors: ['drag-canvas', 'zoom-canvas'],
});
graph.render();
```
## 实际案例
```js | ob { inject: true }
import { Graph } from '@antv/g6';
fetch('https://assets.antv.antgroup.com/g6/collection.json')
.then((res) => res.json())
.then((data) => {
const groupedNodesByCluster = data.nodes.reduce((acc, node) => {
const cluster = node.data.cluster;
acc[cluster] ||= [];
acc[cluster].push(node.id);
return acc;
}, {});
const createStyle = (baseColor) => ({
fill: baseColor,
stroke: baseColor,
labelFill: '#fff',
labelPadding: 2,
labelBackgroundFill: baseColor,
labelBackgroundRadius: 5,
});
const graph = new Graph({
container: 'container',
data,
behaviors: ['zoom-canvas', 'drag-canvas', 'drag-element'],
node: {
palette: { field: 'cluster' },
},
layout: {
type: 'force',
preventOverlap: true,
linkDistance: (d) => {
if (d.source === 'node0' || d.target === 'node0') {
return 200;
}
return 80;
},
},
plugins: [
{
key: 'bubble-sets-a',
type: 'bubble-sets',
members: groupedNodesByCluster['a'],
labelText: 'cluster-a',
...createStyle('#1783FF'),
},
{
key: 'bubble-sets-b',
type: 'bubble-sets',
members: groupedNodesByCluster['b'],
labelText: 'cluster-b',
...createStyle('#00C9C9'),
},
{
key: 'bubble-sets-c',
type: 'bubble-sets',
members: groupedNodesByCluster['c'],
labelText: 'cluster-c',
...createStyle('#F08F56'),
},
{
key: 'bubble-sets-d',
type: 'bubble-sets',
members: groupedNodesByCluster['d'],
labelText: 'cluster-d',
...createStyle('#D580FF'),
},
],
autoFit: 'center',
});
graph.render();
});
```
Plugin Skill
packages/site/docs/manual/plugin/Contextmenu.en.md anthropic-skill ~2,199 tokens---
title: Contextmenu
order: 3
---
## Overview
The context menu, also known as the right-click menu, is a menu that appears when a user clicks on a specific area. It supports triggering custom events before and after clicking. Through the context menu, specific element operations can be integrated, making it convenient to control a particular item when needed.
## Use Cases
This plugin is mainly used for:
- Various interactions with elements: viewing nodes, viewing edges, deleting nodes, etc.
## Basic Usage
Below is a simple example of initializing the Contextmenu plugin:
```js
const graph = new Graph({
plugins: [
{
type: 'contextmenu',
// Enable right-click menu only on nodes, by default all elements are enabled
enable: (e) => e.targetType === 'node',
getItems: () => {
return [{ name: 'View Details', value: 'detail' }];
},
onClick: (value) => {
if (value === 'detail') console.log('Display node details');
},
},
],
});
```
## Configuration Options
| Property | Description | Type | Default Value | Required |
| -------------- | ------------------------------------------------------------------------------------------------------------------------- | --------------------------------------------------------------------------------- | ---------------- | -------- |
| className | Additional class name for the menu DOM | string | `g6-contextmenu` | |
| trigger | How to trigger the right-click menu: `contextmenu` for right-click, `click` for click | `click` \| `contextmenu` | `contextmenu` | |
| offset | Offset of the menu display in X and Y directions | [number, number] | [4, 4] | |
| onClick | Callback method triggered after the menu is clicked, [example](#onclick) | (value: string, target: HTMLElement, current: Element) => void | - | |
| getItems | Returns the list of menu items, supports `Promise` type return value. It is a shortcut configuration for `getContent` | (event: IElementEvent) => [Item](#item)[] \| Promise<[Item](#item)[]> | - | |
| getContent | Returns the content of the menu, supports `Promise` type return value, can also use `getItems` for shortcut configuration | (event: IElementEvent) => HTMLElement \| string \| Promise<HTMLElement \| string> | - | |
| loadingContent | Menu content used when `getContent` returns a `Promise` | HTMLElement \| string | - | |
| enable | Whether it is available, determines whether the right-click menu is supported by parameters, by default all are available | boolean \| (event: IElementEvent) => boolean | true | |
### Item
Each menu item (Item) contains the following properties:
| Property | Description | Type | Required |
| -------- | ------------------------------------ | -------- | -------- |
| name | Name displayed for the menu item | `string` | ✓ |
| value | Value corresponding to the menu item | `string` | ✓ |
### onClick
This function is triggered after clicking a menu item, and the function has three parameters:
- value: Corresponds to the value of the menu item
- target: The DOM node of the menu item container
- current: The element that triggered the menu item, for example, if it is a node, you can use `current` to get the node information (id), or to modify the element
## Code Examples
### Basic Right-click Menu
```js
const data = {
nodes: [
{ id: 'node-1', type: 'circle', data: { cluster: 'node-type1' } },
{ id: 'node-2', type: 'rect', data: { cluster: 'node-type2' } },
],
edges: [{ source: 'node-1', target: 'node-2', data: { cluster: 'edge-type1' } }],
};
const graph = new Graph({
data,
layout: { type: 'grid' },
plugins: [
{
type: 'contextmenu',
trigger: 'contextmenu', // 'click' or 'contextmenu'
onClick: (value, target, current) => {
alert('You have clicked the「' + value + '」item');
},
getItems: () => {
return [
{ name: 'View Details', value: 'detail' },
{ name: 'Delete', value: 'delete' },
];
},
},
],
});
```
### Edge Right-click Menu
```js
const data = {
nodes: [
{ id: 'node-1', type: 'circle', data: { cluster: 'node-type1' } },
{ id: 'node-2', type: 'rect', data: { cluster: 'node-type2' } },
],
edges: [{ source: 'node-1', target: 'node-2', data: { cluster: 'edge-type1' } }],
};
const graph = new Graph({
data,
layout: { type: 'grid' },
plugins: [
{
type: 'contextmenu',
trigger: 'contextmenu',
getItems: () => {
return [{ name: 'Change Start Point', value: 'change' }];
},
onClick: (value) => {
if (value === 'change') console.log('Execute change start point operation here');
},
// Enable right-click menu only on edges
enable: (e) => e.targetType === 'edge',
},
],
});
```
### Asynchronous Loading of Menu Items
```js
const data = {
nodes: [
{ id: 'node-1', type: 'circle', data: { cluster: 'node-type1' } },
{ id: 'node-2', type: 'rect', data: { cluster: 'node-type2' } },
],
edges: [{ source: 'node-1', target: 'node-2', data: { cluster: 'edge-type1' } }],
};
const graph = new Graph({
data,
layout: { type: 'grid' },
plugins: [
{
type: 'contextmenu',
trigger: 'contextmenu',
getItems: async () => {
// Toolbar configuration can be obtained from the server or other asynchronous sources
const response = await fetch('/api/contextmenu-config');
const items = await response.json();
return items;
},
// Enable right-click menu only on nodes
enable: (e) => e.targetType === 'node',
},
],
});
```
### Dynamic Control of Menu Items
```js
const data = {
nodes: [
{ id: 'node-1', type: 'circle', data: { cluster: 'node-type1' } },
{ id: 'node-2', type: 'rect', data: { cluster: 'node-type2' } },
],
edges: [{ source: 'node-1', target: 'node-2', data: { cluster: 'edge-type1' } }],
};
const graph = new Graph({
data,
layout: { type: 'grid' },
plugins: [
{
type: 'contextmenu',
trigger: 'contextmenu',
getItems: (e) => {
if (e.target.id === 'node-1') {
return [
{
name: 'Delete Node',
value: 'delete',
},
];
}
if (e.target.type === 'edge') {
return [
{
name: 'Move Edge',
value: 'move',
},
];
}
return [];
},
},
],
});
```
## Practical Examples
```js | ob { inject: true }
import { Graph } from '@antv/g6';
const data = {
nodes: [{ id: 'node-0' }, { id: 'node-1' }, { id: 'node-2' }, { id: 'node-3' }, { id: 'node-4' }, { id: 'node-5' }],
edges: [
{ source: 'node-0', target: 'node-1' },
{ source: 'node-0', target: 'node-2' },
{ source: 'node-0', target: 'node-3' },
{ source: 'node-0', target: 'node-4' },
{ source: 'node-1', target: 'node-0' },
{ source: 'node-2', target: 'node-0' },
{ source: 'node-3', target: 'node-0' },
{ source: 'node-4', target: 'node-0' },
{ source: 'node-5', target: 'node-0' },
],
};
const graph = new Graph({
container: 'container',
data,
layout: {
type: 'grid',
},
behaviors: ['zoom-canvas', 'drag-canvas', 'drag-element'],
plugins: [
{
type: 'contextmenu',
trigger: 'contextmenu', // 'click' or 'contextmenu'
onClick: (v) => {
alert('You have clicked the「' + v + '」item');
},
getItems: () => {
return [
{ name: '展开一度关系', value: 'spread' },
{ name: '查看详情', value: 'detail' },
];
},
enable: (e) => e.targetType === 'node',
},
],
});
graph.render();
```
Plugin Skill
packages/site/docs/manual/plugin/Contextmenu.zh.md anthropic-skill ~1,766 tokens---
title: 上下文菜单 Contextmenu
order: 3
---
## 概述
上下文菜单(Contextmenu),也被称为右键菜单,是当用户在某个特定区域上点击后出现的一个菜单。支持在点击前后,触发自定义事件。通过上下文菜单,可以将一些具体元素的操作集成在其中,方便对某一项来进行需要时的单独控制。
## 使用场景
这一插件主要用于:
- 元素的各种交互:查看节点、查看边、删除节点等等交互操作
## 基本用法
以下是一个简单的 Contextmenu 插件初始化示例:
```js
const graph = new Graph({
plugins: [
{
type: 'contextmenu',
// 只在节点上开启右键菜单,默认全部元素都开启
enable: (e) => e.targetType === 'node',
getItems: () => {
return [{ name: '查看详情', value: 'detail' }];
},
onClick: (value) => {
if (value === 'detail') console.log('展示节点详情');
},
},
],
});
```
## 配置项
| 属性 | 描述 | 类型 | 默认值 | 必选 |
| -------------- | ------------------------------------------------------------------------------- | --------------------------------------------------------------------------------- | ---------------- | ---- |
| className | 给菜单的 DOM 追加的类名 | string | `g6-contextmenu` | |
| trigger | 如何触发右键菜单:`contextmenu` 表示右键触发,`click` 表示点击触发 | `click` \| `contextmenu` | `contextmenu` | |
| offset | 菜单显式 X、Y 方向的偏移量 | [number, number] | [4, 4] | |
| onClick | 当菜单被点击后,触发的回调方法,[示例](#onclick) | (value: string, target: HTMLElement, current: Element) => void | - | |
| getItems | 返回菜单的项目列表,支持 `Promise` 类型的返回值。是 `getContent` 的快捷配置 | (event: IElementEvent) => [Item](#item)[] \| Promise<[Item](#item)[]> | - | |
| getContent | 返回菜单的内容,支持 `Promise` 类型的返回值,也可以使用 `getItems` 进行快捷配置 | (event: IElementEvent) => HTMLElement \| string \| Promise<HTMLElement \| string> | - | |
| loadingContent | 当 `getContent` 返回一个 `Promise` 时,使用的菜单内容 | HTMLElement \| string | - | |
| enable | 是否可用,通过参数判断是否支持右键菜单,默认是全部可用 | boolean \| (event: IElementEvent) => boolean | true | |
### Item
每个菜单项目 (Item) 包含以下属性:
| 属性 | 描述 | 类型 | 必选 |
| ----- | ---------------- | -------- | ---- |
| name | 菜单项显示的名字 | `string` | ✓ |
| value | 菜单项对应的值 | `string` | ✓ |
### onClick
点击菜单项后会触发该函数,函数有三个参数:
- value: 对应菜单项的 value
- target: 对应菜单项容器的 dom 节点
- current: 对应触发菜单项的元素,例如是节点则可以通过 `current` 来获取到节点的信息(id)等,或者来对元素进行修改
## 代码示例
### 基础右键菜单
```js
const data = {
nodes: [
{ id: 'node-1', type: 'circle', data: { cluster: 'node-type1' } },
{ id: 'node-2', type: 'rect', data: { cluster: 'node-type2' } },
],
edges: [{ source: 'node-1', target: 'node-2', data: { cluster: 'edge-type1' } }],
};
const graph = new Graph({
data,
layout: { type: 'grid' },
plugins: [
{
type: 'contextmenu',
trigger: 'contextmenu', // 'click' or 'contextmenu'
onClick: (value, target, current) => {
alert('You have clicked the「' + v + '」item');
},
getItems: () => {
return [
{ name: '查看详情', value: 'detail' },
{ name: '删除', value: 'delete' },
];
},
},
],
});
```
### 边的右键菜单
```js
const data = {
nodes: [
{ id: 'node-1', type: 'circle', data: { cluster: 'node-type1' } },
{ id: 'node-2', type: 'rect', data: { cluster: 'node-type2' } },
],
edges: [{ source: 'node-1', target: 'node-2', data: { cluster: 'edge-type1' } }],
};
const graph = new Graph({
data,
layout: { type: 'grid' },
plugins: [
{
type: 'contextmenu',
trigger: 'contextmenu',
getItems: () => {
return [{ name: '变更起点', value: 'change' }];
},
onClick: (value) => {
if (value === 'change') console.log('这里执行变更起点操作');
},
// 仅在边上开启右键菜单
enable: (e) => e.targetType === 'edge',
},
],
});
```
### 异步加载菜单项
```js
const data = {
nodes: [
{ id: 'node-1', type: 'circle', data: { cluster: 'node-type1' } },
{ id: 'node-2', type: 'rect', data: { cluster: 'node-type2' } },
],
edges: [{ source: 'node-1', target: 'node-2', data: { cluster: 'edge-type1' } }],
};
const graph = new Graph({
data,
layout: { type: 'grid' },
plugins: [
{
type: 'contextmenu',
trigger: 'contextmenu',
getItems: async () => {
// 可以从服务器或其他异步源获取工具栏配置
const response = await fetch('/api/contextmenu-config');
const items = await response.json();
return items;
},
// 仅在边上开启右键菜单
enable: (e) => e.targetType === 'node',
},
],
});
```
### 动态控制菜单项
```js
const data = {
nodes: [
{ id: 'node-1', type: 'circle', data: { cluster: 'node-type1' } },
{ id: 'node-2', type: 'rect', data: { cluster: 'node-type2' } },
],
edges: [{ source: 'node-1', target: 'node-2', data: { cluster: 'edge-type1' } }],
};
const graph = new Graph({
data,
layout: { type: 'grid' },
plugins: [
{
type: 'contextmenu',
trigger: 'contextmenu',
getItems: (e) => {
if (e.target.id === 'node-1') {
return [
{
name: '删除节点',
value: 'delete',
},
];
}
if (e.target.type === 'edge') {
return [
{
name: '移动边',
value: 'move',
},
];
}
return [];
},
},
],
});
```
## 实际案例
```js | ob { inject: true }
import { Graph } from '@antv/g6';
const data = {
nodes: [{ id: 'node-0' }, { id: 'node-1' }, { id: 'node-2' }, { id: 'node-3' }, { id: 'node-4' }, { id: 'node-5' }],
edges: [
{ source: 'node-0', target: 'node-1' },
{ source: 'node-0', target: 'node-2' },
{ source: 'node-0', target: 'node-3' },
{ source: 'node-0', target: 'node-4' },
{ source: 'node-1', target: 'node-0' },
{ source: 'node-2', target: 'node-0' },
{ source: 'node-3', target: 'node-0' },
{ source: 'node-4', target: 'node-0' },
{ source: 'node-5', target: 'node-0' },
],
};
const graph = new Graph({
container: 'container',
data,
layout: {
type: 'grid',
},
behaviors: ['zoom-canvas', 'drag-canvas', 'drag-element'],
plugins: [
{
type: 'contextmenu',
trigger: 'contextmenu', // 'click' or 'contextmenu'
onClick: (v) => {
alert('You have clicked the「' + v + '」item');
},
getItems: () => {
return [
{ name: '展开一度关系', value: 'spread' },
{ name: '查看详情', value: 'detail' },
];
},
enable: (e) => e.targetType === 'node',
},
],
});
graph.render();
```
Plugin Skill
packages/site/docs/manual/plugin/custom-plugin.en.md anthropic-skill ~1,192 tokens---
title: Custom Plugin
order: 20
---
## Overview
Custom plugins can implement additional features, such as adding extra components, rendering logic, etc. Custom plugins can effectively achieve functional decoupling, better manage and orchestrate code, and facilitate subsequent maintenance.
## Use Cases
### Add extra components, rendering logic, etc.
- **Extra components**: Such as built-in plugins like `Tooltip`, `Minimap`, `Snapline`, `Grid`, `Context Menu`, `Watermark`, etc.
- **Rendering logic**: Such as built-in plugins like `Edge Bundling`, and `Remote Data Loading` ([Example](#remote-data-loading)), etc.
### When built-in plugins cannot meet the requirements
When built-in plugins cannot fully meet business needs, users can also make adjustments and modifications through custom plugins (inheriting built-in plugins).
_(If the features supported by built-in plugins are more general, or if there are bugs in built-in plugins, you are welcome to submit issues or PRs on [Github](https://github.com/antvis/G6))_
## Custom Plugin Examples
Like interactions, the implementation of plugins is also quite flexible, and you can implement your plugin in your preferred style.
Here are a few simple custom plugin implementations:
### Remote Data Loading
Automatically load remote data during graph instantiation:
```typescript
import { BasePlugin } from '@antv/g6';
import type { BasePluginOptions, RuntimeContext } from '@antv/g6';
interface RemoteDataSourceOptions extends BasePluginOptions {}
class RemoteDataSource extends BasePlugin<RemoteDataSourceOptions> {
constructor(context: RuntimeContext, options: RemoteDataSourceOptions) {
super(context, options);
this.loadData();
}
private async loadData() {
// mock remote data
const data = {
nodes: [
{ id: 'node-1', x: 100, y: 100 },
{ id: 'node-2', x: 200, y: 200 },
],
edges: [{ source: 'node-1', target: 'node-2' }],
};
const { graph } = this.context;
graph.setData(data);
await graph.render();
}
}
```
- In this example, we simulate a data loading plugin. After using this plugin, there is no need to pass data when instantiating the Graph, as the plugin will automatically load remote data.
- `BasePlugin` is the base class for all plugins, and each custom plugin needs to inherit this base class.
<embed src="@/common/manual/custom-extension/plugin/implement-plugin.md"></embed>
### Automatically Enable or Disable Animation Based on Node Count
```typescript
import type { BasePluginOptions, RuntimeContext } from '@antv/g6';
import { BasePlugin, GraphEvent } from '@antv/g6';
interface AutoSwitchAnimationOptions extends BasePluginOptions {
maxLength: number; // Disable global animation when the number of nodes reaches this value
}
class AutoSwitchAnimation extends BasePlugin<AutoSwitchAnimationOptions> {
static defaultOptions: Partial<AutoSwitchAnimationOptions> = {
maxLength: 1000,
};
constructor(context: RuntimeContext, options: AutoSwitchAnimationOptions) {
super(context, options);
this.bindEvents();
}
private bindEvents() {
const { graph } = this.context;
graph.on(GraphEvent.BEFORE_RENDER, this.switchAnimation);
}
private switchAnimation() {
const { graph } = this.context;
graph.setOptions({
animation: graph.getNodeData().length < this.options.maxLength,
});
}
private unbindEvents() {
const { graph } = this.context;
graph.off(GraphEvent.BEFORE_RENDER, this.switchAnimation);
}
destroy() {
this.unbindEvents();
super.destroy();
}
}
```
- In this example, we listen to the `GraphEvent.BEFORE_RENDER` event and determine whether the current number of nodes exceeds a specified value. If so, global animation is disabled; otherwise, it is enabled.
- `maxLength` is a defined configuration item that can be passed in when initializing the graph instance. [Plugin Configuration](#configure-plugin)
## Register Plugin
Register using the method provided by G6
```typescript
import { register, ExtensionCategory } from '@antv/g6';
import { MyCustomPlugin } from './my-custom-plugin';
register(ExtensionCategory.PLUGIN, 'my-custom-plugin', MyCustomPlugin);
```
## Configure Plugin
- You can pass the plugin type name or configuration parameter object in `plugins`, see [Configure Plugin](/manual/plugin/overview#configuration-method)
- For example, the previous [Automatically Enable or Disable Animation Based on Node Count](#automatically-enable-or-disable-animation-based-on-node-count) is configured as follows:
```typescript
const graph = new Graph({
// Other configurations
plugins: [
{
type: 'auto-switch-animation',
maxLength: 500,
},
],
});
```
Plugin Skill
packages/site/docs/manual/plugin/custom-plugin.zh.md anthropic-skill ~791 tokens---
title: 自定义插件
order: 20
---
## 概述
自定义插件可以实现一些额外的功能,例如添加额外的组件、渲染逻辑等。通过自定义插件可以很好地实现功能解耦,更好地进行管理、编排代码以及后续维护。
## 使用场景
### 添加额外的组件、渲染逻辑等
- **额外的组件**:如内置插件的`提示框`、`小地图`、`对齐线`、`网格线`、`上下文菜单`、`水印`等
- **渲染逻辑**:如内置插件的`边绑定`,以及`远程数据加载`([示例](#远程数据加载))等
### 内置插件无法满足需求
当内置插件无法完全满足业务需求时,用户也可以通过自定义插件(继承内置插件)进行调整和修改。
_(如果需要内置插件支持的特性是较通用的,或者内置插件存在 Bug ,这种时候欢迎大家到 [Github](https://github.com/antvis/G6) 提 Issue 或者 PR )_
## 自定义插件示例
与交互类似,插件的实现也相当灵活,你可以以你喜欢的风格实现你的插件。
下面列举几个简单的自定义插件实现:
### 远程数据加载
在图实例化过程中自动加载远程数据:
```typescript
import { BasePlugin } from '@antv/g6';
import type { BasePluginOptions, RuntimeContext } from '@antv/g6';
interface RemoteDataSourceOptions extends BasePluginOptions {}
class RemoteDataSource extends BasePlugin<RemoteDataSourceOptions> {
constructor(context: RuntimeContext, options: RemoteDataSourceOptions) {
super(context, options);
this.loadData();
}
private async loadData() {
// mock remote data
const data = {
nodes: [
{ id: 'node-1', x: 100, y: 100 },
{ id: 'node-2', x: 200, y: 200 },
],
edges: [{ source: 'node-1', target: 'node-2' }],
};
const { graph } = this.context;
graph.setData(data);
await graph.render();
}
}
```
- 在这个例子中,我们模拟实现了一个数据加载插件,在使用该插件后,实例化 Graph 时不用再传入数据,该插件会自动加载远程数据。
- `BasePlugin` 是所有插件的基类,每个自定义插件都需要继承这个基类实现。
<embed src="@/common/manual/custom-extension/plugin/implement-plugin.md"></embed>
### 自动判断节点数量开启或关闭动画
```typescript
import type { BasePluginOptions, RuntimeContext } from '@antv/g6';
import { BasePlugin, GraphEvent } from '@antv/g6';
interface AutoSwitchAnimationOptions extends BasePluginOptions {
maxLength: number; // 节点数量达到这个值后关闭全局动画
}
class AutoSwitchAnimation extends BasePlugin<AutoSwitchAnimationOptions> {
static defaultOptions: Partial<AutoSwitchAnimationOptions> = {
maxLength: 1000,
};
constructor(context: RuntimeContext, options: AutoSwitchAnimationOptions) {
super(context, options);
this.bindEvents();
}
private bindEvents() {
const { graph } = this.context;
graph.on(GraphEvent.BEFORE_RENDER, this.switchAnimation);
}
private switchAnimation() {
const { graph } = this.context;
graph.setOptions({
animation: graph.getNodeData().length < this.options.maxLength,
});
}
private unbindEvents() {
const { graph } = this.context;
graph.off(GraphEvent.BEFORE_RENDER, this.switchAnimation);
}
destroy() {
this.unbindEvents();
super.destroy();
}
}
```
- 在这个例子中,我们监听 `GraphEvent.BEFORE_RENDER` 事件,在响应中判断当前节点数量是否大于指定值,是的话则关闭全局动画,否则开启
- `maxLength` 是定义的配置项,可在初始化画布实例时传入具体配置,[插件配置](#配置插件)
## 注册插件
通过 G6 提供的 register 方法注册即可
```typescript
import { register, ExtensionCategory } from '@antv/g6';
import { MyCustomPlugin } from './my-custom-plugin';
register(ExtensionCategory.PLUGIN, 'my-custom-plugin', MyCustomPlugin);
```
## 配置插件
- 可在 `plugins` 中传入插件类型名称或配置参数对象,详见[配置插件](/manual/plugin/overview#配置方式)
- 比如前面的[自动判断节点数量开启或关闭动画](#自动判断节点数量开启或关闭动画),配置如下:
```typescript
const graph = new Graph({
// 其他配置
plugins: [
{
type: 'auto-switch-animation',
maxLength: 500,
},
],
});
```
Plugin Skill
packages/site/docs/manual/plugin/EdgeBundling.en.md anthropic-skill ~2,067 tokens---
title: EdgeBundling
order: 4
---
## Overview
Edge bundling is a graph visualization technique used to reduce visual clutter in complex network graphs and to reveal high-level patterns and structures in the graph. Its purpose is to bundle adjacent edges together.
The edge bundling plugin provided in G6 is based on the implementation of the [FEDB (Force-Directed Edge Bundling for Graph Visualization)](https://classes.engineering.wustl.edu/cse557/readings/holten-edgebundling.pdf) paper: modeling edges as flexible springs that can attract each other and bundling them through a self-organizing process.
## Use Cases
The edge bundling plugin is mainly suitable for the following scenarios:
- Reducing visual clutter in complex network graphs
- Revealing high-level patterns and structures in the graph
- Improving the readability and aesthetics of large-scale graph data
## Basic Usage
Below is a simple example of initializing the EdgeBundling plugin:
```js
const graph = new Graph({
plugins: [
{
type: 'edge-bundling',
bundleThreshold: 0.6,
cycles: 6,
divisions: 3,
divRate: 2,
iterations: 90,
iterRate: 2 / 3,
K: 0.1,
lambda: 0.1,
},
],
});
```
## Configuration Options
| Property | Description | Type | Default Value | Required |
| --------------- | ------------------------------------------------------------------------------------------------------------------------------------------------------------------------------------------------------ | ------ | --------------- | -------- |
| type | Plugin type, used to identify the plugin as an edge bundling plugin | string | `edge-bundling` | ✓ |
| key | Unique identifier for the plugin, can be used to get the plugin instance or update plugin options | string | - | |
| bundleThreshold | Edge compatibility threshold, determines which edges should be bundled together, the larger the value, the fewer edges are bundled, [example](#bundlethreshold) | number | 0.6 | |
| cycles | Number of simulation cycles, controls the number of execution rounds of the edge bundling simulation | number | 6 | |
| divisions | Initial number of cut points, in subsequent cycles, the number of cut points will gradually increase according to divRate, affecting the degree of edge subdivision | number | 1 | |
| divRate | Growth rate of cut points, determines the growth rate of cut points in each cycle | number | 2 | |
| iterations | Specifies the number of iterations executed in the first cycle, in subsequent cycles, the number of iterations will gradually decrease according to iterRate, affecting the accuracy of the simulation | number | 90 | |
| iterRate | Iteration decrement rate, controls the reduction ratio of iterations in each cycle | number | 2/3 | |
| K | Edge strength, affects the attraction and repulsion between edges, [example](#k) | number | 0.1 | |
| lambda | Initial step size, in subsequent cycles, the step size will double increment, affecting the magnitude of node movement during edge bundling | number | 0.1 | |
### bundleThreshold
Edge compatibility threshold, determines which edges should be bundled together. The larger the value, the fewer edges are bundled, and vice versa.
- A lower bundleThreshold value (e.g., 0.4) will cause more edges to be bundled together, forming a more pronounced bundling effect.
```js
const graph = new Graph({
plugins: [
{
type: 'edge-bundling',
bundleThreshold: 0.4, // Lower edge compatibility threshold
},
],
});
```
The effect is as follows:
<img src="https://mdn.alipayobjects.com/huamei_qa8qxu/afts/img/A*_0iOSZnijrMAAAAAAAAAAAAAemJ7AQ/original" width="240" alt="Lower edge compatibility threshold">
- A higher bundleThreshold value (e.g., 0.8) will cause fewer edges to be bundled together, maintaining more independent edges.
```js
const graph = new Graph({
plugins: [
{
type: 'edge-bundling',
bundleThreshold: 0.8, // Higher edge compatibility threshold
},
],
});
```
The effect is as follows:
<img src="https://mdn.alipayobjects.com/huamei_qa8qxu/afts/img/A*WNHMT4L4AfkAAAAAAAAAAAAAemJ7AQ/original" width="240" alt="Higher edge compatibility threshold">
### K
Edge strength, affects the attraction and repulsion between edges. A higher K value will make the attraction between edges stronger, resulting in a tighter bundling effect.
- A lower K value (e.g., 0.05) will make the attraction between edges weaker, resulting in a weaker bundling effect.
```js
const graph = new Graph({
plugins: [
{
type: 'edge-bundling',
K: 0.05, // Lower edge strength
},
],
});
```
The effect is as follows:
<img src="https://mdn.alipayobjects.com/huamei_qa8qxu/afts/img/A*wlHVSb2515gAAAAAAAAAAAAAemJ7AQ/original" width="240" alt="Lower edge strength">
- A higher K value (e.g., 0.2) will make the attraction between edges stronger, resulting in a more pronounced bundling effect.
```js
const graph = new Graph({
plugins: [
{
type: 'edge-bundling',
K: 0.2, // Higher edge strength
},
],
});
```
The effect is as follows:
<img src="https://mdn.alipayobjects.com/huamei_qa8qxu/afts/img/A*4DAMQLvtrk4AAAAAAAAAAAAAemJ7AQ/original" width="240" alt="Higher edge strength">
## Code Examples
### Basic Edge Bundling
The simplest way is to use the preset configuration directly:
```js
const graph = new Graph({
// Other configurations...
plugins: ['edge-bundling'],
});
```
### Custom Styles
You can customize the parameters of edge bundling as needed:
```js
const graph = new Graph({
// Other configurations...
plugins: [
{
type: 'edge-bundling',
bundleThreshold: 0.8, // Higher edge compatibility threshold
cycles: 8, // More simulation cycles
K: 0.2, // Stronger edge strength
},
],
});
```
### Dynamic Update of Edge Bundling
Use the key identifier to dynamically update edge bundling properties at runtime:
```js
// Initial configuration
const graph = new Graph({
// Other configurations...
plugins: [
{
type: 'edge-bundling',
key: 'my-edge-bundling',
bundleThreshold: 0.6,
},
],
});
// Subsequent dynamic update
graph.updatePlugin({
key: 'my-edge-bundling',
bundleThreshold: 0.8, // Update edge compatibility threshold
cycles: 10, // Update number of simulation cycles
});
```
## Practical Examples
```js | ob { inject: true }
import { Graph } from '@antv/g6';
fetch('https://assets.antv.antgroup.com/g6/circular.json')
.then((res) => res.json())
.then((data) => {
const graph = new Graph({
container: 'container',
autoFit: 'view',
data,
layout: {
type: 'circular',
},
node: { style: { size: 20 } },
behaviors: ['drag-canvas', 'drag-element'],
plugins: [
{
key: 'edge-bundling',
type: 'edge-bundling',
bundleThreshold: 0.1,
},
],
});
graph.render();
});
```
Plugin Skill
packages/site/docs/manual/plugin/EdgeBundling.zh.md anthropic-skill ~1,248 tokens---
title: 边绑定 EdgeBundling
order: 4
---
## 概述
边绑定(Edge Bundling)是一种图可视化技术,用于减少复杂网络图中的视觉混乱,并展示图中的高级别模式和结构。其目的是将相邻的边捆绑在一起。
G6 中提供的边绑定插件是基于 [FEDB(Force-Directed Edge Bundling for Graph Visualization)](https://classes.engineering.wustl.edu/cse557/readings/holten-edgebundling.pdf)论文的实现:将边建模为可以相互吸引的柔性弹簧,通过自组织的方式进行捆绑。
## 使用场景
边绑定插件主要适用于以下场景:
- 减少复杂网络图中的视觉混乱
- 揭示图中的高级别模式和结构
- 提高大规模图数据的可读性和美观性
## 基本用法
以下是一个简单的 EdgeBundling 插件初始化示例:
```js
const graph = new Graph({
plugins: [
{
type: 'edge-bundling',
bundleThreshold: 0.6,
cycles: 6,
divisions: 3,
divRate: 2,
iterations: 90,
iterRate: 2 / 3,
K: 0.1,
lambda: 0.1,
},
],
});
```
## 配置项
| 属性 | 描述 | 类型 | 默认值 | 必选 |
| --------------- | -------------------------------------------------------------------------------------------------- | ------ | --------------- | ---- |
| type | 插件类型,用于标识该插件为边捆绑插件 | string | `edge-bundling` | ✓ |
| key | 插件的唯一标识,可用于获取插件实例或更新插件选项 | string | - | |
| bundleThreshold | 边兼容性阈值,该值决定了哪些边应该被绑定在一起,值越大,绑定的边越少,[示例](#bundlethreshold) | number | 0.6 | |
| cycles | 模拟周期数,控制边捆绑模拟的执行轮数 | number | 6 | |
| divisions | 初始切割点数,在后续的周期中,切割点数将根据 divRate 逐步递增,影响边的细分程度 | number | 1 | |
| divRate | 切割点数增长率,决定了每一轮周期中切割点数的增长幅度 | number | 2 | |
| iterations | 指定在第一个周期中执行的迭代次数,在后续的周期中,迭代次数将根据 iterRate 逐步递减,影响模拟的精度 | number | 90 | |
| iterRate | 迭代次数递减率,控制每一轮周期中迭代次数的减少比例 | number | 2\/3 | |
| K | 边的强度,影响边之间的吸引力和排斥力,[示例](#k) | number | 0.1 | |
| lambda | 初始步长,在后续的周期中,步长将双倍递增,影响边捆绑过程中节点移动的幅度 | number | 0.1 | |
### bundleThreshold
边兼容性阈值,该值决定了哪些边应该被绑定在一起。值越大,绑定的边越少,反之则绑定的边越多。
- 较低的 bundleThreshold 值(如 0.4)会使更多的边被绑定在一起,形成更明显的捆绑效果。
```js
const graph = new Graph({
plugins: [
{
type: 'edge-bundling',
bundleThreshold: 0.4, // 较低的边兼容性阈值
},
],
});
```
效果如下:
<img src="https://mdn.alipayobjects.com/huamei_qa8qxu/afts/img/A*_0iOSZnijrMAAAAAAAAAAAAAemJ7AQ/original" width="240" alt="较低的边兼容性阈值">
- 较高的 bundleThreshold 值(如 0.8)会使较少的边被绑定在一起,保持更多的独立边。
```js
const graph = new Graph({
plugins: [
{
type: 'edge-bundling',
bundleThreshold: 0.8, // 较高的边兼容性阈值
},
],
});
```
效果如下:
<img src="https://mdn.alipayobjects.com/huamei_qa8qxu/afts/img/A*WNHMT4L4AfkAAAAAAAAAAAAAemJ7AQ/original" width="240" alt="较高的边兼容性阈值">
### K
边的强度,影响边之间的吸引力和排斥力。较高的 K 值会使边之间的吸引力更强,从而形成更紧密的捆绑效果。
- 较低的 K 值(如 0.05)会使边之间的吸引力较弱,边的捆绑效果较弱。
```js
const graph = new Graph({
plugins: [
{
type: 'edge-bundling',
K: 0.05, // 较低的边强度
},
],
});
```
效果如下:
<img src="https://mdn.alipayobjects.com/huamei_qa8qxu/afts/img/A*wlHVSb2515gAAAAAAAAAAAAAemJ7AQ/original" width="240" alt="较低的边强度">
- 较高的 K 值(如 0.2)会使边之间的吸引力较强,边的捆绑效果更明显。
```js
const graph = new Graph({
plugins: [
{
type: 'edge-bundling',
K: 0.2, // 较高的边强度
},
],
});
```
效果如下:
<img src="https://mdn.alipayobjects.com/huamei_qa8qxu/afts/img/A*4DAMQLvtrk4AAAAAAAAAAAAAemJ7AQ/original" width="240" alt="较高的边强度">
## 代码示例
### 基础边绑定
最简单的方式是直接使用预设配置:
```js
const graph = new Graph({
// 其他配置...
plugins: ['edge-bundling'],
});
```
### 自定义样式
您可以根据需要自定义边绑定的参数:
```js
const graph = new Graph({
// 其他配置...
plugins: [
{
type: 'edge-bundling',
bundleThreshold: 0.8, // 更高的边兼容性阈值
cycles: 8, // 更多模拟周期
K: 0.2, // 更强的边强度
},
],
});
```
### 动态更新边绑定
使用 key 标识符可以在运行时动态更新边绑定属性:
```js
// 初始化配置
const graph = new Graph({
// 其他配置...
plugins: [
{
type: 'edge-bundling',
key: 'my-edge-bundling',
bundleThreshold: 0.6,
},
],
});
// 后续动态更新
graph.updatePlugin({
key: 'my-edge-bundling',
bundleThreshold: 0.8, // 更新边兼容性阈值
cycles: 10, // 更新模拟周期数
});
```
## 实际案例
```js | ob { inject: true }
import { Graph } from '@antv/g6';
fetch('https://assets.antv.antgroup.com/g6/circular.json')
.then((res) => res.json())
.then((data) => {
const graph = new Graph({
container: 'container',
autoFit: 'view',
data,
layout: {
type: 'circular',
},
node: { style: { size: 20 } },
behaviors: ['drag-canvas', 'drag-element'],
plugins: [
{
key: 'edge-bundling',
type: 'edge-bundling',
bundleThreshold: 0.1,
},
],
});
graph.render();
});
```
Plugin Skill
packages/site/docs/manual/plugin/EdgeFilterLens.en.md anthropic-skill ~4,670 tokens---
title: EdgeFilterLens
order: 5
---
## Overview
The Edge Filter Lens plugin allows you to keep the edges of interest within the lens range, while other edges will not be displayed in that range. This is an important visualization exploration tool that can help users focus on edge relationships in specific areas.
## Use Cases
- Need to focus on viewing edge relationships in local areas
- Highlight connections between specific nodes in complex networks
## Basic Usage
Below is a simple example of initializing the EdgeFilterLens plugin:
```js
const graph = new Graph({
plugins: [
{
type: 'edge-filter-lens',
trigger: 'pointermove', // Follow mouse movement
r: 60, // Set lens radius
nodeType: 'both', // Edge display condition
},
],
});
```
## Online Experience
<embed src="@/common/api/plugins/edge-filter-lens.md"></embed>
## Configuration Options
| Property | Description | Type | Default Value | Required |
| -------------- | ------------------------------------------------------------------------------------------------------------------------------------------------------------------------------------------------------------------------------------------------------------------------------------------------------------------------------------------------------------------------------------------- | ----------------------------------------------------------------------------------------------------------------------------------------------------------------------- | ------------------------------------------- | -------- |
| type | Plugin type | string | `edge-filter-lens` | ✓ |
| key | Unique identifier for the plugin, can be used to get the plugin instance or update plugin options | string | - | |
| trigger | Method to move the lens:<br/>- `pointermove`: The lens always follows the mouse movement <br/>- `click`: Move the lens to the click position when clicking on the canvas <br/>- `drag`: Move the lens by dragging | `pointermove` \| `click` \| `drag` | `pointermove` | |
| r | Radius of the lens | number | 60 | |
| maxR | Maximum radius of the lens | number | Half of the smaller dimension of the canvas | |
| minR | Minimum radius of the lens | number | 0 | |
| scaleRBy | Method to scale the lens radius: `wheel`: Scale the lens radius by the wheel | `wheel` | - | |
| nodeType | Edge display condition:<br/> - `both`: The edge is displayed only when both the source and target nodes are in the lens <br/> - `source`: The edge is displayed only when the source node is in the lens<br/> - `target`: The edge is displayed only when the target node is in the lens <br/> - `either`: The edge is displayed as long as either the source or target node is in the lens | `both` \| `source` \| `target` \| `either` | `both` | |
| filter | Filter out elements that are never displayed in the lens | (id: string, elementType: `node` \| `edge` \| `combo`) => boolean | () => true | |
| style | Style of the lens, [configuration options](#style) | object | | |
| nodeStyle | Style of nodes in the lens | [NodeStyle](/en/manual/element/node/base-node#style) \| ((datum: [NodeData](/en/manual/data#节点数据nodedata)) => [NodeStyle](/en/manual/element/node/base-node#style)) | `{ label: false }` | |
| edgeStyle | Style of edges in the lens | [EdgeStyle](/en/manual/element/edge/base-edge#style) \| ((datum: [EdgeData](/en/manual/data#边数据edgedata)) => [EdgeStyle](/en/manual/element/edge/base-edge#style)) | `{ label: true }` | |
| preventDefault | Whether to prevent default events | boolean | true | |
### style
Style properties of the circular lens.
| Property | Description | Type | Default Value |
| ------------- | ------------------ | ----------------------------- | ------------- |
| fill | Fill color | string \| Pattern \| null | `#fff` |
| stroke | Stroke color | string \| Pattern \| null | `#000` |
| opacity | Overall opacity | number \| string | 1 |
| fillOpacity | Fill opacity | number \| string | 0.8 |
| strokeOpacity | Stroke opacity | number \| string | - |
| lineWidth | Line width | number \| string | 2 |
| lineCap | Line cap style | `butt` \| `round` \| `square` | - |
| lineJoin | Line join style | `miter` \| `round` \| `bevel` | - |
| shadowColor | Shadow color | string | - |
| shadowBlur | Shadow blur degree | number | - |
| shadowOffsetX | Shadow X offset | number | - |
| shadowOffsetY | Shadow Y offset | number | - |
For complete style properties, refer to [Element - Node - Built-in Node - General Style Properties - style](/en/manual/element/node/base-node#style)
## Code Examples
### Basic Usage
The simplest configuration method:
```js
const graph = new Graph({
plugins: ['edge-filter-lens'],
});
```
The effect is as follows:
```js | ob { pin: false, inject: true }
import { Graph } from '@antv/g6';
const graph = new Graph({
container: 'container',
width: 400,
height: 300,
data: {
nodes: [
// Upper evacuation area
{ id: 'node1', style: { x: 150, y: 60, label: 'Node 1' } },
{ id: 'node2', style: { x: 100, y: 40, label: 'Node 2' } },
{ id: 'node3', style: { x: 200, y: 35, label: 'Node 3' } },
{ id: 'node4', style: { x: 150, y: 30, label: 'Node 4' } },
// Middle area
{ id: 'node5', style: { x: 220, y: 140, label: 'Node 5' } },
{ id: 'node6', style: { x: 280, y: 160, label: 'Node 6' } },
{ id: 'node7', style: { x: 220, y: 120, label: 'Node 7' } },
{ id: 'node8', style: { x: 260, y: 100, label: 'Node 8' } },
{ id: 'node9', style: { x: 240, y: 130, label: 'Node 9' } },
{ id: 'node10', style: { x: 300, y: 110, label: 'Node 10' } },
// Lower area
{ id: 'node11', style: { x: 240, y: 200, label: 'Node 11' } },
{ id: 'node12', style: { x: 280, y: 220, label: 'Node 12' } },
{ id: 'node13', style: { x: 300, y: 190, label: 'Node 13' } },
{ id: 'node14', style: { x: 320, y: 210, label: 'Node 14' } },
],
edges: [
// Upper connections
{ id: 'edge1', source: 'node1', target: 'node2' },
{ id: 'edge2', source: 'node2', target: 'node3' },
{ id: 'edge3', source: 'node3', target: 'node4' },
// Middle connections
{ id: 'edge4', source: 'node5', target: 'node6' },
{ id: 'edge5', source: 'node6', target: 'node7' },
{ id: 'edge6', source: 'node7', target: 'node8' },
{ id: 'edge7', source: 'node8', target: 'node9' },
{ id: 'edge8', source: 'node9', target: 'node10' },
// Lower connections
{ id: 'edge9', source: 'node11', target: 'node12' },
{ id: 'edge10', source: 'node12', target: 'node13' },
{ id: 'edge11', source: 'node13', target: 'node14' },
// Cross-region connections
{ id: 'edge12', source: 'node4', target: 'node8' },
{ id: 'edge13', source: 'node7', target: 'node11' },
{ id: 'edge14', source: 'node10', target: 'node13' },
],
},
node: {
style: {
size: 20,
},
},
plugins: ['edge-filter-lens'],
});
graph.render();
```
### Custom Styles
You can customize the appearance and behavior of the lens:
```js
const graph = new Graph({
plugins: [
{
type: 'edge-filter-lens',
r: 80,
style: {
fill: '#f0f5ff', // Fill color of the lens area
fillOpacity: 0.6, // Opacity of the fill area
stroke: '#7e3feb', // Change lens border to purple
strokeOpacity: 0.8, // Opacity of the border
lineWidth: 1.5, // Line width of the border
},
nodeStyle: {
size: 24, // Enlarge nodes
fill: '#7e3feb', // Purple fill
stroke: '#5719c9', // Dark purple stroke
lineWidth: 1, // Thin border
label: true, // Show label
labelFill: '#ffffff', // White text
labelFontSize: 14, // Enlarge text
labelFontWeight: 'bold', // Bold text
},
edgeStyle: {
stroke: '#8b9baf', // Gray edge
lineWidth: 2, // Thicken edge line
label: true, // Show label
labelFill: '#5719c9', // Dark purple text
opacity: 0.8, // Appropriate opacity
},
},
],
});
```
The effect is as follows:
```js | ob { pin: false, inject: true }
import { Graph } from '@antv/g6';
const graph = new Graph({
container: 'container',
width: 400,
height: 300,
data: {
nodes: [
// Upper evacuation area
{ id: 'node1', style: { x: 150, y: 60, label: 'Node 1' } },
{ id: 'node2', style: { x: 100, y: 40, label: 'Node 2' } },
{ id: 'node3', style: { x: 200, y: 35, label: 'Node 3' } },
{ id: 'node4', style: { x: 150, y: 30, label: 'Node 4' } },
// Middle area
{ id: 'node5', style: { x: 220, y: 140, label: 'Node 5' } },
{ id: 'node6', style: { x: 280, y: 160, label: 'Node 6' } },
{ id: 'node7', style: { x: 220, y: 120, label: 'Node 7' } },
{ id: 'node8', style: { x: 260, y: 100, label: 'Node 8' } },
{ id: 'node9', style: { x: 240, y: 130, label: 'Node 9' } },
{ id: 'node10', style: { x: 300, y: 110, label: 'Node 10' } },
// Lower area
{ id: 'node11', style: { x: 240, y: 200, label: 'Node 11' } },
{ id: 'node12', style: { x: 280, y: 220, label: 'Node 12' } },
{ id: 'node13', style: { x: 300, y: 190, label: 'Node 13' } },
{ id: 'node14', style: { x: 320, y: 210, label: 'Node 14' } },
],
edges: [
// Upper connections
{ id: 'edge1', source: 'node1', target: 'node2' },
{ id: 'edge2', source: 'node2', target: 'node3' },
{ id: 'edge3', source: 'node3', target: 'node4' },
// Middle connections
{ id: 'edge4', source: 'node5', target: 'node6' },
{ id: 'edge5', source: 'node6', target: 'node7' },
{ id: 'edge6', source: 'node7', target: 'node8' },
{ id: 'edge7', source: 'node8', target: 'node9' },
{ id: 'edge8', source: 'node9', target: 'node10' },
// Lower connections
{ id: 'edge9', source: 'node11', target: 'node12' },
{ id: 'edge10', source: 'node12', target: 'node13' },
{ id: 'edge11', source: 'node13', target: 'node14' },
// Cross-region connections
{ id: 'edge12', source: 'node4', target: 'node8' },
{ id: 'edge13', source: 'node7', target: 'node11' },
{ id: 'edge14', source: 'node10', target: 'node13' },
],
},
node: {
style: {
size: 20,
},
},
edge: {
style: {
stroke: '#91d5ff',
lineWidth: 1,
},
},
plugins: [
{
type: 'edge-filter-lens',
r: 80,
style: {
fill: '#f0f5ff', // Fill color of the lens area
fillOpacity: 0.6, // Opacity of the fill area
stroke: '#7e3feb', // Change lens border to purple
strokeOpacity: 0.8, // Opacity of the border
lineWidth: 1.5, // Line width of the border
},
nodeStyle: {
size: 24, // Enlarge nodes
fill: '#7e3feb', // Purple fill
stroke: '#5719c9', // Dark purple stroke
lineWidth: 1, // Thin border
label: true, // Show label
labelFill: '#ffffff', // White text
labelFontSize: 14, // Enlarge text
labelFontWeight: 'bold', // Bold text
},
edgeStyle: {
stroke: '#8b9baf', // Gray edge
lineWidth: 2, // Thicken edge line
label: true, // Show label
labelFill: '#5719c9', // Dark purple text
opacity: 0.8, // Appropriate opacity
},
},
],
});
graph.render();
```
## Practical Examples
- [Edge Filter Lens](/en/examples/plugin/edge-filter-lens/#basic)
Plugin Skill
packages/site/docs/manual/plugin/EdgeFilterLens.zh.md anthropic-skill ~3,620 tokens---
title: 边过滤镜 EdgeFilterLens
order: 5
---
## 概述
边过滤镜插件可以将关注的边保留在过滤镜范围内,其他边将在该范围内不显示。这是一个重要的可视化探索工具,可以帮助用户聚焦于特定区域的边关系。
## 使用场景
- 需要聚焦查看局部区域的边关系
- 在复杂网络中突出显示特定节点之间的连接
## 基本用法
以下是一个简单的 EdgeFilterLens 插件初始化示例:
```js
const graph = new Graph({
plugins: [
{
type: 'edge-filter-lens',
trigger: 'pointermove', // 跟随鼠标移动
r: 60, // 设置透镜半径
nodeType: 'both', // 边的显示条件
},
],
});
```
## 在线体验
<embed src="@/common/api/plugins/edge-filter-lens.md"></embed>
## 配置项
| 属性 | 描述 | 类型 | 默认值 | 必选 |
| -------------- | ---------------------------------------------------------------------------------------------------------------------------------------------------------------------------------------------------------------------------------------------------------- | -------------------------------------------------------------------------------------------------------------------------------------------------------------- | -------------------- | ---- |
| type | 插件类型 | string | `edge-filter-lens` | ✓ |
| key | 插件的唯一标识,可用于获取插件实例或更新插件选项 | string | - | |
| trigger | 移动透镜的方式:<br/>- `pointermove`:透镜始终跟随鼠标移动 <br/>- `click`:点击画布时移动透镜到点击位置 <br/>- `drag`:通过拖拽方式移动透镜 | `pointermove` \| `click` \| `drag` | `pointermove` | |
| r | 透镜的半径 | number | 60 | |
| maxR | 透镜的最大半径 | number | 画布宽高最小值的一半 | |
| minR | 透镜的最小半径 | number | 0 | |
| scaleRBy | 缩放透镜半径的方式:`wheel`:通过滚轮缩放透镜的半径 | `wheel` | - | |
| nodeType | 边显示的条件:<br/> - `both`:只有起始节点和目标节点都在透镜中时,边才会显示 <br/> - `source`:只有起始节点在透镜中时,边才会显示<br/> - `target`:只有目标节点在透镜中时,边才会显示 <br/> - `either`:只要起始节点或目标节点有一个在透镜中时,边就会显示 | `both` \| `source` \| `target` \| `either` | `both` | |
| filter | 过滤出始终不在透镜中显示的元素 | (id: string, elementType: `node` \| `edge` \| `combo`) => boolean | () => true | |
| style | 透镜的样式,[配置项](#style) | object | | |
| nodeStyle | 在透镜中节点的样式 | [NodeStyle](/manual/element/node/base-node#style) \| ((datum: [NodeData](/manual/data#节点数据nodedata)) => [NodeStyle](/manual/element/node/base-node#style)) | `{ label: false }` | |
| edgeStyle | 在透镜中边的样式 | [EdgeStyle](/manual/element/edge/base-edge#style) \| ((datum: [EdgeData](/manual/data#边数据edgedata)) => [EdgeStyle](/manual/element/edge/base-edge#style)) | `{ label: true }` | |
| preventDefault | 是否阻止默认事件 | boolean | true | |
### style
圆形透镜的样式属性。
| 属性 | 描述 | 类型 | 默认值 |
| ------------- | --------------- | ----------------------------- | ------ |
| fill | 填充颜色 | string \| Pattern \| null | `#fff` |
| stroke | 描边颜色 | string \| Pattern \| null | `#000` |
| opacity | 整体透明度 | number \| string | 1 |
| fillOpacity | 填充透明度 | number \| string | 0.8 |
| strokeOpacity | 描边透明度 | number \| string | - |
| lineWidth | 线宽度 | number \| string | 2 |
| lineCap | 线段端点样式 | `butt` \| `round` \| `square` | - |
| lineJoin | 线段连接处样式 | `miter` \| `round` \| `bevel` | - |
| shadowColor | 阴影颜色 | string | - |
| shadowBlur | 阴影模糊程度 | number | - |
| shadowOffsetX | 阴影 X 方向偏移 | number | - |
| shadowOffsetY | 阴影 Y 方向偏移 | number | - |
完整样式属性参考 [元素 -节点 - 内置节点 - 通用样式属性 - style](/manual/element/node/base-node#style)
## 代码示例
### 基础用法
最简单的配置方式:
```js
const graph = new Graph({
plugins: ['edge-filter-lens'],
});
```
效果如下:
```js | ob { pin: false, inject: true }
import { Graph } from '@antv/g6';
const graph = new Graph({
container: 'container',
width: 400,
height: 300,
data: {
nodes: [
// 上部疏散区域
{ id: 'node1', style: { x: 150, y: 60, label: 'Node 1' } },
{ id: 'node2', style: { x: 100, y: 40, label: 'Node 2' } },
{ id: 'node3', style: { x: 200, y: 35, label: 'Node 3' } },
{ id: 'node4', style: { x: 150, y: 30, label: 'Node 4' } },
// 中部区域
{ id: 'node5', style: { x: 220, y: 140, label: 'Node 5' } },
{ id: 'node6', style: { x: 280, y: 160, label: 'Node 6' } },
{ id: 'node7', style: { x: 220, y: 120, label: 'Node 7' } },
{ id: 'node8', style: { x: 260, y: 100, label: 'Node 8' } },
{ id: 'node9', style: { x: 240, y: 130, label: 'Node 9' } },
{ id: 'node10', style: { x: 300, y: 110, label: 'Node 10' } },
// 下部区域
{ id: 'node11', style: { x: 240, y: 200, label: 'Node 11' } },
{ id: 'node12', style: { x: 280, y: 220, label: 'Node 12' } },
{ id: 'node13', style: { x: 300, y: 190, label: 'Node 13' } },
{ id: 'node14', style: { x: 320, y: 210, label: 'Node 14' } },
],
edges: [
// 上部连接
{ id: 'edge1', source: 'node1', target: 'node2' },
{ id: 'edge2', source: 'node2', target: 'node3' },
{ id: 'edge3', source: 'node3', target: 'node4' },
// 中部连接
{ id: 'edge4', source: 'node5', target: 'node6' },
{ id: 'edge5', source: 'node6', target: 'node7' },
{ id: 'edge6', source: 'node7', target: 'node8' },
{ id: 'edge7', source: 'node8', target: 'node9' },
{ id: 'edge8', source: 'node9', target: 'node10' },
// 下部连接
{ id: 'edge9', source: 'node11', target: 'node12' },
{ id: 'edge10', source: 'node12', target: 'node13' },
{ id: 'edge11', source: 'node13', target: 'node14' },
// 跨区域连接
{ id: 'edge12', source: 'node4', target: 'node8' },
{ id: 'edge13', source: 'node7', target: 'node11' },
{ id: 'edge14', source: 'node10', target: 'node13' },
],
},
node: {
style: {
size: 20,
},
},
plugins: ['edge-filter-lens'],
});
graph.render();
```
### 自定义样式
可以自定义透镜的外观和行为:
```js
const graph = new Graph({
plugins: [
{
type: 'edge-filter-lens',
r: 80,
style: {
fill: '#f0f5ff', // 透镜区域的填充颜色
fillOpacity: 0.6, // 填充区域的透明度
stroke: '#7e3feb', // 透镜边框改为紫色
strokeOpacity: 0.8, // 边框的透明度
lineWidth: 1.5, // 边框的线宽
},
nodeStyle: {
size: 24, // 放大节点
fill: '#7e3feb', // 紫色填充
stroke: '#5719c9', // 深紫色描边
lineWidth: 1, // 细边框
label: true, // 显示标签
labelFill: '#ffffff', // 白色文字
labelFontSize: 14, // 放大文字
labelFontWeight: 'bold', // 文字加粗
},
edgeStyle: {
stroke: '#8b9baf', // 灰色边
lineWidth: 2, // 加粗边线
label: true, // 显示标签
labelFill: '#5719c9', // 深紫色文字
opacity: 0.8, // 适当的透明度
},
},
],
});
```
效果如下:
```js | ob { pin: false, inject: true }
import { Graph } from '@antv/g6';
const graph = new Graph({
container: 'container',
width: 400,
height: 300,
data: {
nodes: [
// 上部疏散区域
{ id: 'node1', style: { x: 150, y: 60, label: 'Node 1' } },
{ id: 'node2', style: { x: 100, y: 40, label: 'Node 2' } },
{ id: 'node3', style: { x: 200, y: 35, label: 'Node 3' } },
{ id: 'node4', style: { x: 150, y: 30, label: 'Node 4' } },
// 中部区域
{ id: 'node5', style: { x: 220, y: 140, label: 'Node 5' } },
{ id: 'node6', style: { x: 280, y: 160, label: 'Node 6' } },
{ id: 'node7', style: { x: 220, y: 120, label: 'Node 7' } },
{ id: 'node8', style: { x: 260, y: 100, label: 'Node 8' } },
{ id: 'node9', style: { x: 240, y: 130, label: 'Node 9' } },
{ id: 'node10', style: { x: 300, y: 110, label: 'Node 10' } },
// 下部区域
{ id: 'node11', style: { x: 240, y: 200, label: 'Node 11' } },
{ id: 'node12', style: { x: 280, y: 220, label: 'Node 12' } },
{ id: 'node13', style: { x: 300, y: 190, label: 'Node 13' } },
{ id: 'node14', style: { x: 320, y: 210, label: 'Node 14' } },
],
edges: [
// 上部连接
{ id: 'edge1', source: 'node1', target: 'node2' },
{ id: 'edge2', source: 'node2', target: 'node3' },
{ id: 'edge3', source: 'node3', target: 'node4' },
// 中部连接
{ id: 'edge4', source: 'node5', target: 'node6' },
{ id: 'edge5', source: 'node6', target: 'node7' },
{ id: 'edge6', source: 'node7', target: 'node8' },
{ id: 'edge7', source: 'node8', target: 'node9' },
{ id: 'edge8', source: 'node9', target: 'node10' },
// 下部连接
{ id: 'edge9', source: 'node11', target: 'node12' },
{ id: 'edge10', source: 'node12', target: 'node13' },
{ id: 'edge11', source: 'node13', target: 'node14' },
// 跨区域连接
{ id: 'edge12', source: 'node4', target: 'node8' },
{ id: 'edge13', source: 'node7', target: 'node11' },
{ id: 'edge14', source: 'node10', target: 'node13' },
],
},
node: {
style: {
size: 20,
},
},
edge: {
style: {
stroke: '#91d5ff',
lineWidth: 1,
},
},
plugins: [
{
type: 'edge-filter-lens',
r: 80,
style: {
fill: '#f0f5ff', // 透镜区域的填充颜色
fillOpacity: 0.6, // 填充区域的透明度
stroke: '#7e3feb', // 透镜边框改为紫色
strokeOpacity: 0.8, // 边框的透明度
lineWidth: 1.5, // 边框的线宽
},
nodeStyle: {
size: 24, // 放大节点
fill: '#7e3feb', // 紫色填充
stroke: '#5719c9', // 深紫色描边
lineWidth: 1, // 细边框
label: true, // 显示标签
labelFill: '#ffffff', // 白色文字
labelFontSize: 14, // 放大文字
labelFontWeight: 'bold', // 文字加粗
},
edgeStyle: {
stroke: '#8b9baf', // 灰色边
lineWidth: 2, // 加粗边线
label: true, // 显示标签
labelFill: '#5719c9', // 深紫色文字
opacity: 0.8, // 适当的透明度
},
},
],
});
graph.render();
```
## 实际案例
- [边过滤镜](/examples/plugin/edge-filter-lens/#basic)
Plugin Skill
packages/site/docs/manual/plugin/Fisheye.en.md anthropic-skill ~4,337 tokens---
title: Fisheye
order: 6
---
## Overview
The Fisheye plugin is designed for focus+context exploration scenarios. It can magnify the area of interest while ensuring that the context and the relationship between the context and the focus center are not lost. It is an important visualization exploration tool.
## Use Cases
- Highlight certain areas during presentations
- Magnify details locally without losing the overall view
## Basic Usage
Below is a simple example of initializing the Fisheye plugin:
```js
const graph = new Graph({
plugins: [
{
type: 'fisheye',
trigger: 'drag', // Move fisheye by dragging
d: 1.5, // Set distortion factor
r: 120, // Set fisheye radius
showDPercent: true, // Show distortion degree
},
],
});
```
## Online Experience
<embed src="@/common/api/plugins/fisheye.md"></embed>
## Configuration Options
| Property | Description | Type | Default Value | Required |
| -------------- | ----------------------------------------------------------------------------------------------------------------------------------------------------------------------------------------------------------------------------- | ----------------------------------------------------------------------------------------------------------------------------------------------------------------------- | ------------------------------------------- | -------- |
| type | Plugin type | string | `fisheye` | ✓ |
| key | Unique identifier for the plugin, can be used to get the plugin instance or update plugin options | string | - | |
| trigger | Method to move the fisheye:<br/>- `pointermove`: The fisheye always follows the mouse movement <br/>- `click`: Move the fisheye to the click position when clicking on the canvas <br/>- `drag`: Move the fisheye by dragging | `pointermove` \| `drag` \| `click` | `pointermove` | |
| r | Radius of the fisheye | number | 120 | |
| maxR | Maximum adjustable radius of the fisheye | number | Half of the smaller dimension of the canvas | |
| minR | Minimum adjustable radius of the fisheye | number | 0 | |
| d | Distortion factor | number | 1.5 | |
| maxD | Maximum adjustable distortion factor of the fisheye | number | 5 | |
| minD | Minimum adjustable distortion factor of the fisheye | number | 0 | |
| scaleRBy | Method to adjust the fisheye radius:<br/>- `'wheel'`: Adjust by wheel <br/>- `'drag'`: Adjust by dragging | `wheel` \| `drag` | - | |
| scaleDBy | Method to adjust the fisheye distortion factor:<br/>- `'wheel'`: Adjust by wheel <br/>- `'drag'`: Adjust by dragging | `wheel` \| `drag` | - | |
| showDPercent | Whether to show the distortion factor value in the fisheye | boolean | true | |
| style | Style of the fisheye, [configuration options](#style) | object | - | |
| nodeStyle | Style of nodes in the fisheye | [NodeStyle](/en/manual/element/node/base-node#style) \| ((datum: [NodeData](/en/manual/data#节点数据nodedata)) => [NodeStyle](/en/manual/element/node/base-node#style)) | `{ label: true }` | |
| preventDefault | Whether to prevent default events | boolean | true | |
### style
Circular style properties for configuring the appearance of the fisheye.
| Property | Description | Type | Default Value |
| ------------- | ------------------ | ----------------------------- | ------------- |
| fill | Fill color | string \| Pattern \| null | `#ccc` |
| stroke | Stroke color | string \| Pattern \| null | `#000` |
| opacity | Overall opacity | number \| string | - |
| fillOpacity | Fill opacity | number \| string | 0.1 |
| strokeOpacity | Stroke opacity | number \| string | - |
| lineWidth | Line width | number \| string | 2 |
| lineCap | Line cap style | `butt` \| `round` \| `square` | - |
| lineJoin | Line join style | `miter` \| `round` \| `bevel` | - |
| shadowColor | Shadow color | string | - |
| shadowBlur | Shadow blur degree | number | - |
| shadowOffsetX | Shadow X offset | number | - |
| shadowOffsetY | Shadow Y offset | number | - |
For complete style properties, refer to [Element - Node - Built-in Node - General Style Properties - style](/en/manual/element/node/base-node#style)
### Zoom Control
`scaleRBy` and `scaleDBy` can be used to control the adjustment method of the fisheye's radius and distortion factor respectively:
```js
const graph = new Graph({
plugins: [
{
type: 'fisheye',
// Adjust radius by wheel
scaleRBy: 'wheel',
// Adjust distortion factor by dragging
scaleDBy: 'drag',
// Set range for radius and distortion factor
minR: 50,
maxR: 200,
minD: 1,
maxD: 3,
},
],
});
```
Note: When `trigger`, `scaleRBy`, and `scaleDBy` are all set to `'drag'`, the priority order is `trigger` > `scaleRBy` > `scaleDBy`, and only the highest priority configuration item will bind the drag event. Similarly, if `scaleRBy` and `scaleDBy` are both set to `'wheel'`, only `scaleRBy` will bind the wheel event.
## Code Examples
### Basic Usage
The simplest configuration method:
```js
const graph = new Graph({
plugins: ['fisheye'],
});
```
### Custom Styles
You can customize the appearance and behavior of the fisheye:
```js
const graph = new Graph({
plugins: [
{
type: 'fisheye',
r: 150,
d: 2,
style: {
fill: '#2f54eb', // Fill color of the fisheye area
fillOpacity: 0.2, // Opacity of the fill area
stroke: '#1d39c4', // Color of the fisheye border
strokeOpacity: 0.8, // Opacity of the border
lineWidth: 1.5, // Line width of the border
shadowColor: '#1d39c4', // Shadow color
shadowBlur: 10, // Shadow blur radius
shadowOffsetX: 0, // Horizontal shadow offset
shadowOffsetY: 0, // Vertical shadow offset
cursor: 'pointer', // Cursor style when hovering
},
nodeStyle: {
// Basic node style
size: 40, // Node size
fill: '#d6e4ff', // Node fill color
stroke: '#2f54eb', // Node border color
lineWidth: 2, // Node border width
shadowColor: '#2f54eb', // Node shadow color
shadowBlur: 5, // Node shadow blur radius
cursor: 'pointer', // Cursor style when hovering
// Label style
label: true, // Show label
labelFontSize: 14, // Label font size
labelFontWeight: 'bold', // Label font weight
labelFill: '#1d39c4', // Label text color
labelBackground: true, // Show label background
labelBackgroundFill: '#fff', // Label background fill color
labelBackgroundStroke: '#1d39c4', // Label background border color
labelBackgroundOpacity: 0.8, // Label background opacity
labelBackgroundPadding: [4, 8, 4, 8], // Label background padding [top, right, bottom, left]
// Icon style
icon: true, // Show icon
iconFontFamily: 'iconfont', // Icon font
iconText: '\ue6f6', // Icon Unicode
iconFill: '#1d39c4', // Icon color
iconSize: 16, // Icon size
iconFontWeight: 'normal', // Icon font weight
},
},
],
});
```
The effect is as follows:
```js | ob { pin: false, inject: true }
import { Graph } from '@antv/g6';
const graph = new Graph({
container: 'container',
width: 400,
height: 300,
data: {
nodes: [
{ id: 'node-1', style: { x: 150, y: 100 } },
{ id: 'node-2', style: { x: 250, y: 100 } },
{ id: 'node-3', style: { x: 200, y: 180 } },
{ id: 'node-4', style: { x: 120, y: 180 } },
{ id: 'node-5', style: { x: 280, y: 180 } },
],
edges: [
{ id: 'edge-1', source: 'node-1', target: 'node-2' },
{ id: 'edge-2', source: 'node-1', target: 'node-3' },
{ id: 'edge-3', source: 'node-2', target: 'node-3' },
{ id: 'edge-4', source: 'node-3', target: 'node-4' },
{ id: 'edge-5', source: 'node-3', target: 'node-5' },
],
},
node: {
style: {
size: 30,
fill: '#e6f7ff',
stroke: '#1890ff',
lineWidth: 1,
label: false,
icon: false,
},
},
edge: {
style: {
stroke: '#91d5ff',
lineWidth: 1,
},
},
plugins: [
{
type: 'fisheye',
key: 'fisheye',
r: 100,
d: 2,
style: {
fill: '#2f54eb', // Fill color of the fisheye area
fillOpacity: 0.2, // Opacity of the fill area
stroke: '#1d39c4', // Color of the fisheye border
strokeOpacity: 0.8, // Opacity of the border
lineWidth: 1.5, // Line width of the border
shadowColor: '#1d39c4', // Shadow color
shadowBlur: 10, // Shadow blur radius
shadowOffsetX: 0, // Horizontal shadow offset
shadowOffsetY: 0, // Vertical shadow offset
cursor: 'pointer', // Cursor style when hovering
},
nodeStyle: {
// Basic node style
size: 40, // Node size
fill: '#d6e4ff', // Node fill color
stroke: '#2f54eb', // Node border color
lineWidth: 2, // Node border width
shadowColor: '#2f54eb', // Node shadow color
shadowBlur: 5, // Node shadow blur radius
cursor: 'pointer', // Cursor style when hovering
// Label style
label: true, // Show label
labelFontSize: 14, // Label font size
labelFontWeight: 'bold', // Label font weight
labelFill: '#1d39c4', // Label text color
labelBackground: true, // Show label background
labelBackgroundFill: '#fff', // Label background fill color
labelBackgroundStroke: '#1d39c4', // Label background border color
labelBackgroundOpacity: 0.8, // Label background opacity
labelBackgroundPadding: [4, 8, 4, 8], // Label background padding [top, right, bottom, left]
// Icon style
icon: true, // Show icon
iconFontFamily: 'iconfont', // Icon font
iconText: '\ue6f6', // Icon Unicode
iconFill: '#1d39c4', // Icon color
iconSize: 16, // Icon size
iconFontWeight: 'normal', // Icon font weight
},
},
],
});
graph.render();
```
## Practical Examples
```js | ob { inject: true }
import { Graph, iconfont } from '@antv/g6';
const style = document.createElement('style');
style.innerHTML = `@import url('${iconfont.css}');`;
document.head.appendChild(style);
fetch('https://assets.antv.antgroup.com/g6/relations.json')
.then((res) => res.json())
.then((data) => {
const graph = new Graph({
container: 'container',
autoFit: 'view',
data,
node: {
style: {
size: (datum) => datum.id.length * 2 + 10,
label: false,
labelText: (datum) => datum.id,
labelBackground: true,
icon: false,
iconFontFamily: 'iconfont',
iconText: '\ue6f6',
iconFill: '#fff',
},
palette: {
type: 'group',
field: (datum) => datum.id,
color: ['#1783FF', '#00C9C9', '#F08F56', '#D580FF'],
},
},
edge: {
style: {
stroke: '#e2e2e2',
},
},
plugins: [{ key: 'fisheye', type: 'fisheye', nodeStyle: { label: true, icon: true } }],
});
graph.render();
});
```
Plugin Skill
packages/site/docs/manual/plugin/Fisheye.zh.md anthropic-skill ~3,492 tokens---
title: 鱼眼放大镜 Fisheye
order: 6
---
## 概述
鱼眼放大镜插件是为 focus+context 的探索场景设计的,它能够在放大关注区域的同时,保证上下文以及上下文与关注中心的关系不丢失,是一个重要的可视化探索工具。
## 使用场景
- 在演示过程中需要突出展示某些区域内容
- 需要局部放大查看细节时,同时又不想失去整体视图
## 基本用法
以下是一个简单的 Fisheye 插件初始化示例:
```js
const graph = new Graph({
plugins: [
{
type: 'fisheye',
trigger: 'drag', // 通过拖拽移动鱼眼
d: 1.5, // 设置畸变因子
r: 120, // 设置鱼眼半径
showDPercent: true, // 显示畸变程度
},
],
});
```
## 在线体验
<embed src="@/common/api/plugins/fisheye.md"></embed>
## 配置项
| 属性 | 描述 | 类型 | 默认值 | 必选 |
| -------------- | --------------------------------------------------------------------------------------------------------------------------------------------------------------------------------------------- | -------------------------------------------------------------------------------------------------------------------------------------------------------------- | ---------------------- | ---- |
| type | 插件类型 | string | `fisheye` | ✓ |
| key | 插件的唯一标识,可用于获取插件实例或更新插件选项 | string | - | |
| trigger | 用于控制鱼眼放大镜的移动方式,支持以下三种配置:<br/>- `pointermove`:鱼眼放大镜始终跟随鼠标移动 <br/>- `click`:点击画布时移动鱼眼放大镜到点击位置 <br/>- `drag`:通过拖拽方式移动鱼眼放大镜 | `pointermove` \| `drag` \| `click` | `pointermove` | |
| r | 鱼眼放大镜半径 | number | 120 | |
| maxR | 鱼眼放大镜可调整的最大半径 | number | 画布宽高的最小值的一半 | |
| minR | 鱼眼放大镜可调整的最小半径 | number | 0 | |
| d | 畸变因子 | number | 1.5 | |
| maxD | 鱼眼放大镜可调整的最大畸变因子 | number | 5 | |
| minD | 鱼眼放大镜可调整的最小畸变因子 | number | 0 | |
| scaleRBy | 调整鱼眼放大镜范围半径的方式:<br/>- `'wheel'`:滚轮调整 <br/>- `'drag'`:拖拽调整 | `wheel` \| `drag` | - | |
| scaleDBy | 调整鱼眼放大镜畸变因子的方式:<br/>- `'wheel'`:滚轮调整 <br/>- `'drag'`:拖拽调整 | `wheel` \| `drag` | - | |
| showDPercent | 是否在鱼眼放大镜中显示畸变因子数值 | boolean | true | |
| style | 鱼眼放大镜样式,[配置项](#style) | object | - | |
| nodeStyle | 在鱼眼放大镜中的节点样式 | [NodeStyle](/manual/element/node/base-node#style) \| ((datum: [NodeData](/manual/data#节点数据nodedata)) => [NodeStyle](/manual/element/node/base-node#style)) | `{ label: true }` | |
| preventDefault | 是否阻止默认事件 | boolean | true | |
### style
圆形样式属性,用于配置鱼眼放大镜的外观。
| 属性 | 描述 | 类型 | 默认值 |
| ------------- | --------------- | ----------------------------- | ------ |
| fill | 填充颜色 | string \| Pattern \| null | `#ccc` |
| stroke | 描边颜色 | string \| Pattern \| null | `#000` |
| opacity | 整体透明度 | number \| string | - |
| fillOpacity | 填充透明度 | number \| string | 0.1 |
| strokeOpacity | 描边透明度 | number \| string | - |
| lineWidth | 线宽度 | number \| string | 2 |
| lineCap | 线段端点样式 | `butt` \| `round` \| `square` | - |
| lineJoin | 线段连接处样式 | `miter` \| `round` \| `bevel` | - |
| shadowColor | 阴影颜色 | string | - |
| shadowBlur | 阴影模糊程度 | number | - |
| shadowOffsetX | 阴影 X 方向偏移 | number | - |
| shadowOffsetY | 阴影 Y 方向偏移 | number | - |
完整样式属性参考 [元素 -节点 - 内置节点 - 通用样式属性 - style](/manual/element/node/base-node#style)
### 缩放控制
通过 `scaleRBy` 和 `scaleDBy` 可以分别控制鱼眼放大镜的半径和畸变因子的调整方式:
```js
const graph = new Graph({
plugins: [
{
type: 'fisheye',
// 通过滚轮调整半径
scaleRBy: 'wheel',
// 通过拖拽调整畸变因子
scaleDBy: 'drag',
// 设置半径和畸变因子的范围
minR: 50,
maxR: 200,
minD: 1,
maxD: 3,
},
],
});
```
注意:当 `trigger`、`scaleRBy` 和 `scaleDBy` 同时设置为 `'drag'` 时,优先级顺序为 `trigger` > `scaleRBy` > `scaleDBy`,只会为优先级最高的配置项绑定拖拽事件。同理,如果 `scaleRBy` 和 `scaleDBy` 同时设置为 `'wheel'`,只会为 `scaleRBy` 绑定滚轮事件。
## 代码示例
### 基础用法
最简单的配置方式:
```js
const graph = new Graph({
plugins: ['fisheye'],
});
```
### 自定义样式
可以自定义鱼眼放大镜的外观和行为:
```js
const graph = new Graph({
plugins: [
{
type: 'fisheye',
r: 150,
d: 2,
style: {
fill: '#2f54eb', // 鱼眼区域的填充颜色
fillOpacity: 0.2, // 填充区域的透明度
stroke: '#1d39c4', // 鱼眼边框的颜色
strokeOpacity: 0.8, // 边框的透明度
lineWidth: 1.5, // 边框的线宽
shadowColor: '#1d39c4', // 阴影颜色
shadowBlur: 10, // 阴影的模糊半径
shadowOffsetX: 0, // 阴影的水平偏移
shadowOffsetY: 0, // 阴影的垂直偏移
cursor: 'pointer', // 鼠标悬停时的指针样式
},
nodeStyle: {
// 节点基础样式
size: 40, // 节点大小
fill: '#d6e4ff', // 节点填充颜色
stroke: '#2f54eb', // 节点边框颜色
lineWidth: 2, // 节点边框宽度
shadowColor: '#2f54eb', // 节点阴影颜色
shadowBlur: 5, // 节点阴影模糊半径
cursor: 'pointer', // 鼠标悬停时的指针样式
// 标签样式
label: true, // 是否显示标签
labelFontSize: 14, // 标签字体大小
labelFontWeight: 'bold', // 标签字体粗细
labelFill: '#1d39c4', // 标签文字颜色
labelBackground: true, // 是否显示标签背景
labelBackgroundFill: '#fff', // 标签背景填充颜色
labelBackgroundStroke: '#1d39c4', // 标签背景边框颜色
labelBackgroundOpacity: 0.8, // 标签背景透明度
labelBackgroundPadding: [4, 8, 4, 8], // 标签背景内边距 [上,右,下,左]
// 图标样式
icon: true, // 是否显示图标
iconFontFamily: 'iconfont', // 图标字体
iconText: '\ue6f6', // 图标的 Unicode 编码
iconFill: '#1d39c4', // 图标颜色
iconSize: 16, // 图标大小
iconFontWeight: 'normal', // 图标字体粗细
},
},
],
});
```
效果如下:
```js | ob { pin: false, inject: true }
import { Graph } from '@antv/g6';
const graph = new Graph({
container: 'container',
width: 400,
height: 300,
data: {
nodes: [
{ id: 'node-1', style: { x: 150, y: 100 } },
{ id: 'node-2', style: { x: 250, y: 100 } },
{ id: 'node-3', style: { x: 200, y: 180 } },
{ id: 'node-4', style: { x: 120, y: 180 } },
{ id: 'node-5', style: { x: 280, y: 180 } },
],
edges: [
{ id: 'edge-1', source: 'node-1', target: 'node-2' },
{ id: 'edge-2', source: 'node-1', target: 'node-3' },
{ id: 'edge-3', source: 'node-2', target: 'node-3' },
{ id: 'edge-4', source: 'node-3', target: 'node-4' },
{ id: 'edge-5', source: 'node-3', target: 'node-5' },
],
},
node: {
style: {
size: 30,
fill: '#e6f7ff',
stroke: '#1890ff',
lineWidth: 1,
label: false,
icon: false,
},
},
edge: {
style: {
stroke: '#91d5ff',
lineWidth: 1,
},
},
plugins: [
{
type: 'fisheye',
key: 'fisheye',
r: 100,
d: 2,
style: {
fill: '#2f54eb', // 鱼眼区域的填充颜色
fillOpacity: 0.2, // 填充区域的透明度
stroke: '#1d39c4', // 鱼眼边框的颜色
strokeOpacity: 0.8, // 边框的透明度
lineWidth: 1.5, // 边框的线宽
shadowColor: '#1d39c4', // 阴影颜色
shadowBlur: 10, // 阴影的模糊半径
shadowOffsetX: 0, // 阴影的水平偏移
shadowOffsetY: 0, // 阴影的垂直偏移
cursor: 'pointer', // 鼠标悬停时的指针样式
},
nodeStyle: {
// 节点基础样式
size: 40, // 节点大小
fill: '#d6e4ff', // 节点填充颜色
stroke: '#2f54eb', // 节点边框颜色
lineWidth: 2, // 节点边框宽度
shadowColor: '#2f54eb', // 节点阴影颜色
shadowBlur: 5, // 节点阴影模糊半径
cursor: 'pointer', // 鼠标悬停时的指针样式
// 标签样式
label: true, // 是否显示标签
labelFontSize: 14, // 标签字体大小
labelFontWeight: 'bold', // 标签字体粗细
labelFill: '#1d39c4', // 标签文字颜色
labelBackground: true, // 是否显示标签背景
labelBackgroundFill: '#fff', // 标签背景填充颜色
labelBackgroundStroke: '#1d39c4', // 标签背景边框颜色
labelBackgroundOpacity: 0.8, // 标签背景透明度
labelBackgroundPadding: [4, 8, 4, 8], // 标签背景内边距 [上,右,下,左]
// 图标样式
icon: true, // 是否显示图标
iconFontFamily: 'iconfont', // 图标字体
iconText: '\ue6f6', // 图标的 Unicode 编码
iconFill: '#1d39c4', // 图标颜色
iconSize: 16, // 图标大小
iconFontWeight: 'normal', // 图标字体粗细
},
},
],
});
graph.render();
```
## 实际案例
```js | ob { inject: true }
import { Graph, iconfont } from '@antv/g6';
const style = document.createElement('style');
style.innerHTML = `@import url('${iconfont.css}');`;
document.head.appendChild(style);
fetch('https://assets.antv.antgroup.com/g6/relations.json')
.then((res) => res.json())
.then((data) => {
const graph = new Graph({
container: 'container',
autoFit: 'view',
data,
node: {
style: {
size: (datum) => datum.id.length * 2 + 10,
label: false,
labelText: (datum) => datum.id,
labelBackground: true,
icon: false,
iconFontFamily: 'iconfont',
iconText: '\ue6f6',
iconFill: '#fff',
},
palette: {
type: 'group',
field: (datum) => datum.id,
color: ['#1783FF', '#00C9C9', '#F08F56', '#D580FF'],
},
},
edge: {
style: {
stroke: '#e2e2e2',
},
},
plugins: [{ key: 'fisheye', type: 'fisheye', nodeStyle: { label: true, icon: true } }],
});
graph.render();
});
```
Plugin Skill
packages/site/docs/manual/plugin/Fullscreen.en.md anthropic-skill ~1,392 tokens---
title: Fullscreen
order: 7
---
## Overview
The Fullscreen plugin allows users to expand the graph visualization content to the entire screen, providing a broader view and a better immersive experience.
## Use Cases
The Fullscreen plugin is mainly suitable for the following scenarios:
- Provide a broader view for viewing complex graph data
- Enhance immersive experience, focusing on graph visualization content
- Display graph data in presentations or reports
## Basic Usage
Below is a simple example of initializing the Fullscreen plugin:
```js
const graph = new Graph({
plugins: [
{
type: 'fullscreen',
autoFit: true,
trigger: {
request: 'F', // Use shortcut key F to enter fullscreen
exit: 'Esc', // Use shortcut key Esc to exit fullscreen
},
onEnter: () => {
console.log('Entered fullscreen mode');
},
onExit: () => {
console.log('Exited fullscreen mode');
},
},
],
});
```
## Configuration Options
| Property | Description | Type | Default Value | Required |
| -------- | ---------------------------------------------------------------------------------------------------------------- | ------------------------------------ | ------------- | -------- |
| type | Plugin type | string | `fullscreen` | ✓ |
| key | Unique identifier for the plugin, can be used to get the plugin instance or update plugin options | string | - | |
| autoFit | Whether to auto-fit the canvas size, the canvas size will automatically adapt to the screen size when fullscreen | boolean | true | |
| trigger | Method to trigger fullscreen, [example](#trigger) | { request?: string; exit?: string; } | - | |
| onEnter | Callback after entering fullscreen | () => void | - | |
| onExit | Callback after exiting fullscreen | () => void | - | |
### trigger
The trigger property is used to control the method of triggering fullscreen. It supports two configuration methods:
#### Shortcut Key Configuration
Use keyboard shortcuts to trigger fullscreen and exit fullscreen.
```js
const graph = new Graph({
plugins: [
{
type: 'fullscreen',
trigger: {
request: 'F', // Use shortcut key F to enter fullscreen
exit: 'Esc', // Use shortcut key Esc to exit fullscreen
},
},
],
});
```
#### Custom Trigger
Control fullscreen by calling the request and exit methods.
```js
const graph = new Graph({
plugins: [
{
type: 'fullscreen',
key: 'my-fullscreen',
},
],
});
// Enter fullscreen
graph.getPluginInstance('my-fullscreen').request();
// Exit fullscreen
graph.getPluginInstance('my-fullscreen').exit();
```
### autoFit
Whether to auto-fit the canvas size, the canvas size will automatically adapt to the screen size when fullscreen.
- When set to true, the canvas will automatically resize to fit the entire screen.
- When set to false, the canvas size remains unchanged.
```js
const graph = new Graph({
plugins: [
{
type: 'fullscreen',
autoFit: true,
},
],
});
```
## API
### Fullscreen.request()
This method is used to enter fullscreen mode programmatically. It can be called on the plugin instance to expand the graph visualization to the entire screen.
```js
const graph = new Graph({
plugins: [
{
type: 'fullscreen',
key: 'my-fullscreen',
},
],
});
// Enter fullscreen
graph.getPluginInstance('my-fullscreen').request();
```
### Fullscreen.exit()
This method is used to exit fullscreen mode programmatically. It can be called on the plugin instance to revert the graph visualization back to its original size.
```js
const graph = new Graph({
plugins: [
{
type: 'fullscreen',
key: 'my-fullscreen',
},
],
});
// Exit fullscreen
graph.getPluginInstance('my-fullscreen').exit();
```
## Practical Examples
```js | ob { inject: true }
import { Graph } from '@antv/g6';
const graph = new Graph({
data: { nodes: Array.from({ length: 20 }).map((_, i) => ({ id: `node${i}` })) },
autoFit: 'center',
background: '#fff',
plugins: [
{
type: 'fullscreen',
key: 'fullscreen',
},
function () {
const graph = this;
return {
type: 'toolbar',
key: 'toolbar',
position: 'top-left',
onClick: (item) => {
const fullscreenPlugin = graph.getPluginInstance('fullscreen');
if (item === 'request-fullscreen') {
fullscreenPlugin.request();
}
if (item === 'exit-fullscreen') {
fullscreenPlugin.exit();
}
},
getItems: () => {
return [
{ id: 'request-fullscreen', value: 'request-fullscreen' },
{ id: 'exit-fullscreen', value: 'exit-fullscreen' },
];
},
};
},
],
});
graph.render();
```
Plugin Skill
packages/site/docs/manual/plugin/Fullscreen.zh.md anthropic-skill ~953 tokens---
title: 全屏展示 Fullscreen
order: 7
---
## 概述
全屏展示插件允许用户将图可视化内容扩展到整个屏幕,提供更广阔的视图和更好的沉浸式体验。
## 使用场景
全屏展示插件主要适用于以下场景:
- 提供更广阔的视图,便于查看复杂图数据
- 增强沉浸式体验,专注于图可视化内容
- 在演示或报告中展示图数据
## 基本用法
以下是一个简单的 Fullscreen 插件初始化示例:
```js
const graph = new Graph({
plugins: [
{
type: 'fullscreen',
autoFit: true,
trigger: {
request: 'F', // 使用快捷键 F 进入全屏
exit: 'Esc', // 使用快捷键 Esc 退出全屏
},
onEnter: () => {
console.log('进入全屏模式');
},
onExit: () => {
console.log('退出全屏模式');
},
},
],
});
```
## 配置项
| 属性 | 描述 | 类型 | 默认值 | 必选 |
| ------- | ---------------------------------------------------- | ------------------------------------ | ------------ | ---- |
| type | 插件类型 | string | `fullscreen` | ✓ |
| key | 插件的唯一标识,可用于获取插件实例或更新插件选项 | string | - | |
| autoFit | 是否自适应画布尺寸,全屏后画布尺寸会自动适应屏幕尺寸 | boolean | true | |
| trigger | 触发全屏的方式,[示例](#trigger) | { request?: string; exit?: string; } | - | |
| onEnter | 进入全屏后的回调 | () => void | - | |
| onExit | 退出全屏后的回调 | () => void | - | |
### trigger
trigger 属性用于控制触发全屏的方式。它支持两种配置方式:
#### 快捷键配置
使用键盘快捷键来触发全屏和退出全屏。
```js
const graph = new Graph({
plugins: [
{
type: 'fullscreen',
trigger: {
request: 'F', // 使用快捷键 F 进入全屏
exit: 'Esc', // 使用快捷键 Esc 退出全屏
},
},
],
});
```
#### 自定义触发
通过调用 request 和 exit 方法来控制全屏。
```js
const graph = new Graph({
plugins: [
{
type: 'fullscreen',
key: 'my-fullscreen',
},
],
});
// 进入全屏
graph.getPluginInstance('my-fullscreen').request();
// 退出全屏
graph.getPluginInstance('my-fullscreen').exit();
```
### autoFit
是否自适应画布尺寸,全屏后画布尺寸会自动适应屏幕尺寸。
- 设置为 true 时,画布会自动调整大小以适应整个屏幕。
- 设置为 false 时,画布大小保持不变。
```js
const graph = new Graph({
plugins: [
{
type: 'fullscreen',
autoFit: true,
},
],
});
```
## API
### Fullscreen.request()
这个方法可以让你通过代码进入全屏模式。调用插件实例上的这个方法,就能把图形内容扩展到整个屏幕。
```js
const graph = new Graph({
plugins: [
{
type: 'fullscreen',
key: 'my-fullscreen',
},
],
});
// 进入全屏
graph.getPluginInstance('my-fullscreen').request();
```
### Fullscreen.exit()
这个方法可以让你通过代码退出全屏模式。调用插件实例上的这个方法,就能把图形内容恢复到原来的大小。
```js
const graph = new Graph({
plugins: [
{
type: 'fullscreen',
key: 'my-fullscreen',
},
],
});
// 退出全屏
graph.getPluginInstance('my-fullscreen').exit();
```
## 实际案例
```js | ob { inject: true }
import { Graph } from '@antv/g6';
const graph = new Graph({
data: { nodes: Array.from({ length: 20 }).map((_, i) => ({ id: `node${i}` })) },
autoFit: 'center',
background: '#fff',
plugins: [
{
type: 'fullscreen',
key: 'fullscreen',
},
function () {
const graph = this;
return {
type: 'toolbar',
key: 'toolbar',
position: 'top-left',
onClick: (item) => {
const fullscreenPlugin = graph.getPluginInstance('fullscreen');
if (item === 'request-fullscreen') {
fullscreenPlugin.request();
}
if (item === 'exit-fullscreen') {
fullscreenPlugin.exit();
}
},
getItems: () => {
return [
{ id: 'request-fullscreen', value: 'request-fullscreen' },
{ id: 'exit-fullscreen', value: 'exit-fullscreen' },
];
},
};
},
],
});
graph.render();
```
Plugin Skill
packages/site/docs/manual/plugin/GridLine.en.md anthropic-skill ~2,090 tokens---
title: GridLine
order: 8
---
## Overview
The GridLine plugin provides visual auxiliary lines for the canvas, helping users precisely position and align graphic elements. It is an indispensable tool in graphic drawing.
## Use Cases
The GridLine plugin is mainly suitable for the following scenarios:
- Assisting users in precise drawing and element alignment
- Providing visual references to enhance spatial awareness
- Building a structured reference system when designing and editing graphics
## Basic Usage
Below is a simple example of initializing the GridLine plugin:
```js
const graph = new Graph({
plugins: [
{
type: 'grid-line',
key: 'my-grid-line', // Specify a unique identifier for dynamic updates
size: 20,
stroke: '#0001',
follow: true,
},
],
});
```
## Online Experience
<embed src="@/common/api/plugins/grid-line.md"></embed>
## Configuration Options
| Property | Description | Type | Default | Required |
| --------------- | --------------------------------------------------------------------------------------------------- | ------------------------------------------------- | ----------- | -------- |
| type | Plugin type | string | `grid-line` | ✓ |
| key | Unique identifier for the plugin, used to get the plugin instance or update plugin options | string | - | |
| border | Whether to display the border | boolean | true | |
| borderLineWidth | Border line width | number | 1 | |
| borderStroke | Border color, see [CSS border-color](https://developer.mozilla.org/en-US/docs/Web/CSS/border-color) | string | `#eee` | |
| borderStyle | Border style, see [CSS border-style](https://developer.mozilla.org/en-US/docs/Web/CSS/border-style) | string | `solid` | |
| follow | Whether to follow canvas movements | boolean \| {translate ?: boolean, zoom?: boolean} | false | |
| lineWidth | Grid line width | number \| string | 1 | |
| size | Grid unit size in pixels | number | 20 | |
| stroke | Grid line color | string | `#eee` | |
### follow
The `follow` property controls whether the grid lines follow the canvas transformations. It supports two configuration methods:
1. **Boolean Configuration**: When set to `true`, the grid lines follow both canvas translation and zoom; when set to `false`, they remain static.
```js
// Enable both translation and zoom following
const graph = new Graph({
plugins: [
{
type: 'grid-line',
follow: true,
},
],
});
```
2. **Object Configuration**: Allows more precise control over the grid line following behavior.
```js
// Follow translation only, not zoom
const graph = new Graph({
plugins: [
{
type: 'grid-line',
follow: {
translate: true, // Follow translation
zoom: false, // Do not follow zoom
},
},
],
});
// Follow zoom only, not translation
const graph = new Graph({
plugins: [
{
type: 'grid-line',
follow: {
translate: false, // Do not follow translation
zoom: true, // Follow zoom
},
},
],
});
```
When grid lines follow zoom, they maintain a relative position to the canvas content, making alignment references more precise. Following translation allows the grid to move with the canvas content, enhancing the visual experience of spatial continuity.
## Code Examples
### Basic Grid Line
The simplest way is to use the preset configuration directly:
```js
const graph = new Graph({
// Other configurations...
plugins: ['grid-line'],
});
```
The effect is as follows:
```js | ob { pin: false, inject: true }
import { Graph } from '@antv/g6';
const graph = new Graph({
container: 'container',
width: 300,
height: 150,
data: { nodes: [{ id: 'node-1', style: { x: 150, y: 75 } }] },
behaviors: ['drag-canvas'],
plugins: ['grid-line'],
});
graph.render();
```
### Custom Style
You can customize the grid line style as needed:
```js
const graph = new Graph({
// Other configurations...
plugins: [
{
type: 'grid-line',
stroke: '#1890ff33', // Blue semi-transparent grid line
lineWidth: 2,
size: 40, // Larger grid unit
borderStroke: '#1890ff', // Blue border
borderLineWidth: 2,
},
],
});
```
The effect is as follows:
```js | ob { pin: false, inject: true }
import { Graph } from '@antv/g6';
const graph = new Graph({
container: 'container',
width: 300,
height: 150,
data: { nodes: [{ id: 'node-1', style: { x: 150, y: 75 } }] },
behaviors: ['drag-canvas'],
plugins: [
{
type: 'grid-line',
stroke: '#1890ff33', // Blue semi-transparent grid line
lineWidth: 2,
size: 40, // Larger grid
borderStroke: '#1890ff', // Blue border
borderLineWidth: 2,
},
],
});
graph.render();
```
### Follow Movement
Enabling the follow option allows the grid to move with the canvas, enhancing user experience:
```js
const graph = new Graph({
// Other configurations...
behaviors: ['drag-canvas', 'zoom-canvas'],
plugins: [
{
type: 'grid-line',
follow: true, // Grid follows canvas movement
},
],
});
```
Try dragging/zooming the canvas to observe the grid following effect:
```js | ob { pin: false, inject: true }
import { Graph } from '@antv/g6';
const graph = new Graph({
container: 'container',
width: 300,
height: 150,
data: { nodes: [{ id: 'node-1', style: { x: 150, y: 75 } }] },
behaviors: ['drag-canvas', 'zoom-canvas'],
plugins: [
{
type: 'grid-line',
follow: true, // Grid follows canvas movement
},
],
});
graph.render();
```
### Dynamic Grid Update
Use the key identifier to dynamically update grid properties at runtime:
```js
// Initial configuration
const graph = new Graph({
// Other configurations...
plugins: [
{
type: 'grid-line',
key: 'my-grid',
size: 20,
},
],
});
// Subsequent dynamic updates
graph.updatePlugin({
key: 'my-grid',
size: 40, // Update grid size
stroke: '#ff4d4f', // Update grid color
});
```
## Cases
```js | ob { inject: true }
import { Graph } from '@antv/g6';
const data = {
nodes: [{ id: 'node-0' }, { id: 'node-1' }, { id: 'node-2' }, { id: 'node-3' }, { id: 'node-4' }, { id: 'node-5' }],
edges: [
{ source: 'node-0', target: 'node-1' },
{ source: 'node-0', target: 'node-2' },
{ source: 'node-0', target: 'node-3' },
{ source: 'node-0', target: 'node-4' },
{ source: 'node-1', target: 'node-0' },
{ source: 'node-2', target: 'node-0' },
{ source: 'node-3', target: 'node-0' },
{ source: 'node-4', target: 'node-0' },
{ source: 'node-5', target: 'node-0' },
],
};
const graph = new Graph({
container: 'container',
data,
layout: { type: 'grid' },
behaviors: ['drag-canvas'],
plugins: [{ key: 'grid-line', type: 'grid-line', follow: false }],
});
graph.render();
window.addPanel((gui) => {
gui
.add({ follow: false }, 'follow')
.name('Follow')
.onChange((value) => {
graph.updatePlugin({
key: 'grid-line',
follow: value,
});
});
});
```
Plugin Skill
packages/site/docs/manual/plugin/GridLine.zh.md anthropic-skill ~1,685 tokens---
title: 网格线 GridLine
order: 8
---
## 概述
网格线插件为画布提供可视化辅助线,帮助用户精确定位和对齐图形元素,是图形绘制中不可或缺的辅助工具。
## 使用场景
网格线插件主要适用于以下场景:
- 辅助用户精确绘图和元素对齐
- 提供视觉参考,增强空间感知
- 在设计和编辑图形时构建结构化的参考系统
## 基本用法
以下是一个简单的 GridLine 插件初始化示例:
```js
const graph = new Graph({
plugins: [
{
type: 'grid-line',
key: 'my-grid-line', // 指定唯一标识符,便于后续动态更新
size: 20,
stroke: '#0001',
follow: true,
},
],
});
```
## 在线体验
<embed src="@/common/api/plugins/grid-line.md"></embed>
## 配置项
| 属性 | 描述 | 类型 | 默认值 | 必选 |
| --------------- | -------------------------------------------------------------------------------------------------------- | -------------------------------------------------- | ----------- | ---- |
| type | 插件类型 | string | `grid-line` | ✓ |
| key | 插件的唯一标识,可用于获取插件实例或更新插件选项 | string | - | |
| border | 是否显示边框 | boolean | true | |
| borderLineWidth | 边框线宽 | number | 1 | |
| borderStroke | 边框颜色,详细属性参考 [CSS border-color](https://developer.mozilla.org/zh-CN/docs/Web/CSS/border-color) | string | `#eee` | |
| borderStyle | 边框样式,详细属性参考 [CSS border-style](https://developer.mozilla.org/zh-CN/docs/Web/CSS/border-style) | string | `solid` | |
| follow | 是否跟随画布移动 | boolean \| {translate ?: boolean, zoom?: boolean} | false | |
| lineWidth | 网格线宽度 | number \| string | 1 | |
| size | 网格单元大小,单位为像素 | number | 20 | |
| stroke | 网格线颜色 | string | `#eee` | |
### follow
`follow` 属性用于控制网格线是否跟随画布的变换操作。它支持两种配置方式:
1. **布尔值配置**:当设置为 `true` 时,网格线会同时跟随画布的平移和缩放;设置为 `false` 时则保持静态。
```js
// 同时启用跟随平移和缩放
const graph = new Graph({
plugins: [
{
type: 'grid-line',
follow: true,
},
],
});
```
2. **对象配置**:可以更精细地控制网格线的跟随行为。
```js
// 仅跟随平移,不跟随缩放
const graph = new Graph({
plugins: [
{
type: 'grid-line',
follow: {
translate: true, // 跟随平移
zoom: false, // 不跟随缩放
},
},
],
});
// 仅跟随缩放,不跟随平移
const graph = new Graph({
plugins: [
{
type: 'grid-line',
follow: {
translate: false, // 不跟随平移
zoom: true, // 跟随缩放
},
},
],
});
```
当网格线跟随缩放时,它会保持与画布内容的相对位置关系,使得对齐参考更加精准。跟随平移则让网格随着画布内容一起移动,增强空间连续性的视觉体验。
## 代码示例
### 基础网格线
最简单的方式是直接使用预设配置:
```js
const graph = new Graph({
// 其他配置...
plugins: ['grid-line'],
});
```
效果如下:
```js | ob { pin: false, inject: true }
import { Graph } from '@antv/g6';
const graph = new Graph({
container: 'container',
width: 300,
height: 150,
data: { nodes: [{ id: 'node-1', style: { x: 150, y: 75 } }] },
behaviors: ['drag-canvas'],
plugins: ['grid-line'],
});
graph.render();
```
### 自定义样式
您可以根据需要自定义网格线的样式:
```js
const graph = new Graph({
// 其他配置...
plugins: [
{
type: 'grid-line',
stroke: '#1890ff33', // 蓝色半透明网格线
lineWidth: 2,
size: 40, // 更大的网格单元
borderStroke: '#1890ff', // 蓝色边框
borderLineWidth: 2,
},
],
});
```
效果如下:
```js | ob { pin: false, inject: true }
import { Graph } from '@antv/g6';
const graph = new Graph({
container: 'container',
width: 300,
height: 150,
data: { nodes: [{ id: 'node-1', style: { x: 150, y: 75 } }] },
behaviors: ['drag-canvas'],
plugins: [
{
type: 'grid-line',
stroke: '#1890ff33', // 蓝色半透明网格线
lineWidth: 2,
size: 40, // 更大的网格
borderStroke: '#1890ff', // 蓝色边框
borderLineWidth: 2,
},
],
});
graph.render();
```
### 跟随移动
启用 follow 选项可以让网格跟随画布移动,增强用户体验:
```js
const graph = new Graph({
// 其他配置...
behaviors: ['drag-canvas', 'zoom-canvas'],
plugins: [
{
type: 'grid-line',
follow: true, // 网格跟随画布移动
},
],
});
```
试着拖拽/缩放画布,观察网格的跟随效果:
```js | ob { pin: false, inject: true }
import { Graph } from '@antv/g6';
const graph = new Graph({
container: 'container',
width: 300,
height: 150,
data: { nodes: [{ id: 'node-1', style: { x: 150, y: 75 } }] },
behaviors: ['drag-canvas', 'zoom-canvas'],
plugins: [
{
type: 'grid-line',
follow: true, // 网格跟随画布移动
},
],
});
graph.render();
```
### 动态更新网格
使用 key 标识符可以在运行时动态更新网格属性:
```js
// 初始化配置
const graph = new Graph({
// 其他配置...
plugins: [
{
type: 'grid-line',
key: 'my-grid',
size: 20,
},
],
});
// 后续动态更新
graph.updatePlugin({
key: 'my-grid',
size: 40, // 更新网格大小
stroke: '#ff4d4f', // 更新网格颜色
});
```
## 实际案例
```js | ob { inject: true }
import { Graph } from '@antv/g6';
const data = {
nodes: [{ id: 'node-0' }, { id: 'node-1' }, { id: 'node-2' }, { id: 'node-3' }, { id: 'node-4' }, { id: 'node-5' }],
edges: [
{ source: 'node-0', target: 'node-1' },
{ source: 'node-0', target: 'node-2' },
{ source: 'node-0', target: 'node-3' },
{ source: 'node-0', target: 'node-4' },
{ source: 'node-1', target: 'node-0' },
{ source: 'node-2', target: 'node-0' },
{ source: 'node-3', target: 'node-0' },
{ source: 'node-4', target: 'node-0' },
{ source: 'node-5', target: 'node-0' },
],
};
const graph = new Graph({
container: 'container',
data,
layout: { type: 'grid' },
behaviors: ['drag-canvas'],
plugins: [{ key: 'grid-line', type: 'grid-line', follow: false }],
});
graph.render();
window.addPanel((gui) => {
gui
.add({ follow: false }, 'follow')
.name('Follow')
.onChange((value) => {
graph.updatePlugin({
key: 'grid-line',
follow: value,
});
});
});
```
Plugin Skill
packages/site/docs/manual/plugin/History.en.md anthropic-skill ~2,683 tokens---
title: History
order: 9
---
## Overview
This plugin is used to implement the **Undo** and **Redo** functions in graph editing. By recording the historical state stack of user operations, it supports backtracking or restoring operations during graph interactions. The plugin provides users with comprehensive configuration options and APIs.
## Usage Scenarios
The history plugin is suitable for all scenarios involving graph editing.
## Online Experience
<embed src="@/common/api/plugins/history.md"></embed>
## Basic Usage
Add this plugin in the graph configuration:
**1. Quick Configuration (Static)**
Declare directly using a string. This method is simple but only supports default configurations and cannot be dynamically modified after configuration:
```javascript
const graph = new Graph({
// Other configurations...
plugins: ['history'],
});
```
**2. Object Configuration (Recommended)**
Configure using an object form, supporting custom parameters, and allowing dynamic updates at runtime:
```javascript
const graph = new Graph({
// Other configurations...
plugins: [
{
type: 'history',
key: 'history-1',
stackSize: 10,
},
],
});
```
## Configuration Options
| Property | Description | Type | Default Value | Required |
| ---------------- | ------------------------------------------------------------------------------------------------------------------------------------------------------------------------------------------------------------- | -------------------------------------------------------------- | ------------- | -------- |
| afterAddCommand | Called after a command is added to the `Undo/Redo` queue. `revert` is `true` for undo operations and `false` for redo operations | (cmd: [Command](#command), revert: boolean) => void | - | |
| beforeAddCommand | Called before a command is added to the `Undo/Redo` queue. If this method returns `false`, the command will not be added to the queue. `revert` is `true` for undo operations and `false` for redo operations | (cmd: [Command](#command), revert: boolean) => boolean \| void | - | |
| executeCommand | Callback function when executing a command | (cmd: [Command](#command)) => void | - | |
| stackSize | Maximum length of history records to be recorded | number | 0 (unlimited) | |
### Parameter Type Description
#### `Command`
```typescript
// Single history command
interface Command {
current: CommandData; // Current data
original: CommandData; // Original data
animation: boolean; // Whether to enable animation
}
// Single history command data
interface CommandData {
add: GraphData; // Added data
update: GraphData; // Updated data
remove: GraphData; // Removed data
}
// Graph data
interface GraphData {
nodes?: NodeData[]; // Node data
edges?: EdgeData[]; // Edge data
combos?: ComboData[]; // Combo data
}
```
## API
The history plugin provides the following APIs for users to use as needed. For how to call plugin methods, please refer to the [Plugin Overview Document](/en/manual/plugin/overview#calling-plugin-methods)
### History.canRedo()
Determines whether a **redo** operation can be performed. If there are records in the redo stack, it returns `true`; otherwise, it returns `false`.
```typescript
canRedo(): boolean;
```
**Example:**
```typescript
const canRedo = historyInstance.canRedo();
if (canRedo) {
console.log('Redo operation can be performed');
} else {
console.log('Redo stack is empty, cannot redo');
}
```
### History.canUndo()
Determines whether an **undo** operation can be performed. If there are records in the undo stack, it returns `true`; otherwise, it returns `false`.
```typescript
canUndo(): boolean;
```
**Example:**
```typescript
const canUndo = historyInstance.canUndo();
if (canUndo) {
console.log('Undo operation can be performed');
} else {
console.log('Undo stack is empty, cannot undo');
}
```
### History.clear()
Clears the history records, including the undo and redo stacks.
```typescript
clear(): void;
```
**Example:**
```typescript
historyInstance.clear();
console.log('History records cleared');
```
### History.on()
Listens to history events, allowing users to execute custom logic when specific events occur.
```typescript
on(event: Loosen<HistoryEvent>, handler: (e: { cmd?: Command | null }) => void): void;
```
Parameter Type Description:
- HistoryEvent
```typescript
enum HistoryEvent {
UNDO = 'undo', // When a command is undone
REDO = 'redo', // When a command is redone
CANCEL = 'cancel', // When a command is canceled
ADD = 'add', // When a command is added to the queue
CLEAR = 'clear', // When the history queue is cleared
CHANGE = 'change', // When the history queue changes
}
```
- Command
Please refer to the previous [Command](#parameter-type-description) type description
Example:
```typescript
historyInstance.on(HistoryEvent.UNDO, () => {
console.log('Undo operation executed');
});
```
### History.redo()
Performs a **redo** operation and returns the plugin instance. If the redo stack is empty, no operation is performed.
```typescript
redo(): History;
```
**Example:**
```typescript
historyInstance.redo();
console.log('Redo operation executed');
```
### History.undo()
Performs an **undo** operation and returns the plugin instance. If the undo stack is empty, no operation is performed.
```typescript
undo(): History;
```
**Example:**
```typescript
historyInstance.undo();
console.log('Undo operation executed');
```
### History.undoAndCancel()
Performs an undo operation without recording it in the history and returns the plugin instance. Note that this operation will clear the **redo** stack.
```typescript
undoAndCancel(): History;
```
**Example:**
```typescript
historyInstance.undoAndCancel();
console.log('Undo and cancel operation executed');
```
## History Modes
This plugin supports two history modes:
### Default Mode
In default mode, every time a **render** is triggered (for example, after updating element data, the user actively executes the `graph.draw()` method to trigger rendering), the plugin records the data **before** and **after** rendering and stacks it as an operation record.
### Custom Mode
#### Scenario Description
In actual needs, a user's graph editing operation may involve **multiple renders**. For example, in one editing operation, first display nodes A and B, then display the connection from A to B. This involves two renders (i.e., the user needs to perform `graph.draw()` twice). In this scenario, the default mode will stack two history records, which are:
- Display nodes A and B
- Display the connection from A to B
Obviously, in actual business, one operation should only require one undo.
But here, when undoing this operation, the user needs to call the `undo` method twice, which means two undos are required.
#### Scenario Support
To support such scenarios, G6 provides a batch controller (`BatchController`, [refer to the source code](https://github.com/antvis/G6/blob/v5/packages/g6/src/runtime/batch.ts)), which is provided in the graph instance context.
The history plugin implements custom operation records based on this batch controller. The code example is as follows:
```typescript
const graph = new Graph({
// Other configurations...
plugins: [
{
type: 'history',
key: 'history',
},
],
});
graph.context.batch.startBatch(); // Start batch operation
graph.addNodeData(...); // Display nodes A and B
graph.draw(); // First render trigger
graph.addEdgeData(...); // Display the connection from A to B
graph.draw(); // Second render trigger
graph.context.batch.endBatch(); // End batch operation
```
In the example:
- By calling the `startBatch` method of the batch controller instance, the history plugin is informed that batch operations are now being performed. Before the batch operation ends, no matter how many renders are triggered, no history records should be stacked (the history plugin will record the change data for each render trigger).
- After completing the last data change, call the `endBatch()` method. The history plugin listens for the completion of the batch operation and stacks this batch operation as a history record.
Finally, the user only needs to perform one `undo` to undo.
## Code Examples
Below are some common cases with corresponding code references.
### Undo and Redo Button States
In actual business scenarios, you may need to customize the toolbar of the canvas, which involves the enable and disable states of the undo and redo buttons.
```typescript
const canUndo = false;
const canRedo = false;
const graph = new Graph({
// Other configurations...
plugins: [
{
type: 'history',
key: 'history',
},
],
});
const historyInstance = graph.getPluginInstance('history');
historyInstance.on(HistoryEvent.CHANGE, () => {
canUndo = historyInstance.canUndo();
canRedo = historyInstance.canRedo();
});
```
In the example, by listening to the `HistoryEvent.CHANGE` event, which is triggered when the history queue changes, it is determined in real-time whether undo and redo operations can be performed.
### Determine Whether a Command is Allowed to Enter the Queue
Here is a simple scenario: only the operation of removing elements is allowed to enter the history queue.
```typescript
const graph = new Graph({
// Other configurations...
plugins: [
{
type: 'history',
key: 'history',
beforeAddCommand: (cmd) => {
return (
cmd.current.remove?.nodes?.length > 0 ||
cmd.current.remove?.combos?.length > 0 ||
cmd.current.remove?.edges?.length > 0
);
},
},
],
});
```
In the example, the configuration option [beforeAddCommand](#beforeAddCommand) is used to determine whether there are elements removed in `cmd.current.remove`.
Plugin Skill
packages/site/docs/manual/plugin/History.zh.md anthropic-skill ~1,668 tokens---
title: 历史记录 History
order: 9
---
## 概述
该插件用于实现图编辑的 **撤销(Undo)** 和 **重做(Redo)** 功能,通过记录用户操作的历史状态堆栈,支持在图交互过程中进行回溯或恢复操作。该插件为用户提供了完善的配置项和 API 。
## 使用场景
历史记录插件适用于所有涉及到图编辑的场景。
## 在线体验
<embed src="@/common/api/plugins/history.md"></embed>
## 基本用法
在图配置中添加这一插件:
**1. 快速配置(静态)**
使用字符串形式直接声明,这种方式简洁但仅支持默认配置,且配置后不可动态修改:
```javascript
const graph = new Graph({
// 其他配置...
plugins: ['history'],
});
```
**2. 对象配置(推荐)**
使用对象形式进行配置,支持自定义参数,且可以在运行时动态更新配置:
```javascript
const graph = new Graph({
// 其他配置...
plugins: [
{
type: 'history',
key: 'history-1',
stackSize: 10,
},
],
});
```
## 配置项
| 属性 | 描述 | 类型 | 默认值 | 必选 |
| ---------------- | ------------------------------------------------------------------------------------------------------------------------------------------------------------------- | -------------------------------------------------------------- | ----------- | ---- |
| afterAddCommand | 当一个命令被添加到 `Undo/Redo` 队列后被调用。`revert` 为 `true` 时表示撤销操作,为 `false` 时表示重做操作 | (cmd: [Command](#command), revert: boolean) => void | - | |
| beforeAddCommand | 当一个命令被添加到 `Undo/Redo` 队列前被调用,如果该方法返回 `false`,那么这个命令将不会被添加到队列中。`revert` 为 `true` 时表示撤销操作,为 `false` 时表示重做操作 | (cmd: [Command](#command), revert: boolean) => boolean \| void | - | |
| executeCommand | 执行命令时的回调函数 | (cmd: [Command](#command)) => void | - | |
| stackSize | 最多记录该数据长度的历史记录 | number | 0(不限制) | |
### 参数类型说明
#### `Command`
```typescript
// 单条历史记录命令
interface Command {
current: CommandData; // 当前数据
original: CommandData; // 原始数据
animation: boolean; // 是否开启动画
}
// 单条历史记录命令数据
interface CommandData {
add: GraphData; // 新增的数据
update: GraphData; // 更新的数据
remove: GraphData; // 移除的数据
}
// 图数据
interface GraphData {
nodes?: NodeData[]; // 节点数据
edges?: EdgeData[]; // 边数据
combos?: ComboData[]; // Combo 数据
}
```
## API
history 插件提供了以下 API 供用户按需使用,调用插件方法的方式请参考 [插件总览文档](/manual/plugin/overview#调用插件方法)
### History.canRedo()
判断是否可以进行**重做**操作。如果重做堆栈中有记录,则返回 `true`,否则返回 `false`。
```typescript
canRedo(): boolean;
```
**示例:**
```typescript
const canRedo = historyInstance.canRedo();
if (canRedo) {
console.log('可以进行重做操作');
} else {
console.log('重做堆栈为空,无法重做');
}
```
### History.canUndo()
判断是否可以进行**撤销**操作。如果撤销堆栈中有记录,则返回 `true`,否则返回 `false`。
```typescript
canUndo(): boolean;
```
**示例:**
```typescript
const canUndo = historyInstance.canUndo();
if (canUndo) {
console.log('可以进行撤销操作');
} else {
console.log('撤销堆栈为空,无法撤销');
}
```
### History.clear()
清空历史记录,包括撤销和重做堆栈。
```typescript
clear(): void;
```
**示例:**
```typescript
historyInstance.clear();
console.log('历史记录已清空');
```
### History.on()
监听历史记录事件,允许用户在特定事件发生时执行自定义逻辑。
```typescript
on(event: Loosen/<HistoryEvent/>, handler: (e: { cmd?: Command | null }) => void): void;
```
参数类型说明:
- HistoryEvent
```typescript
enum HistoryEvent {
UNDO = 'undo', // 当命令被撤销时
REDO = 'redo', // 当命令被重做时
CANCEL = 'cancel', // 当命令被取消时
ADD = 'add', // 当命令被添加到队列时
CLEAR = 'clear', // 当历史队列被清空时
CHANGE = 'change', // 当历史队列发生变化时
}
```
- Command
请参考前面的 [Command](#参数类型说明) 类型说明
示例:
```typescript
historyInstance.on(HistoryEvent.UNDO, () => {
console.log('执行了撤销操作');
});
```
### History.redo()
执行**重做**操作,并返回插件实例。如果重做堆栈为空,则不执行任何操作。
```typescript
redo(): History;
```
**示例:**
```typescript
historyInstance.redo();
console.log('执行了重做操作');
```
### History.undo()
执行**撤销**操作,并返回插件实例。如果撤销堆栈为空,则不执行任何操作。
```typescript
undo(): History;
```
**示例:**
```typescript
historyInstance.undo();
console.log('执行了撤销操作');
```
### History.undoAndCancel()
执行撤销操作且不计入历史记录,并返回插件实例。注意,执行该操作会清空**重做**栈。
```typescript
undoAndCancel(): History;
```
**示例:**
```typescript
historyInstance.undoAndCancel();
console.log('执行了撤销并取消操作');
```
## 历史记录模式
该插件支持两种历史记录模式:
### 默认模式
默认模式下,每一次触发**渲染后**(比如更新元素数据后,用户主动执行 `graph.draw()` 方法触发渲染),插件会把**渲染前**和**渲染后**的数据记录下来并作为一次操作记录入栈。
### 自定义模式
#### 场景描述
实际需求中,用户的一次图编辑操作可能涉及到**多次渲染**,比如,一次编辑操作中,首先把节点 A、B 展示出来,然后展示 A->B 的连线,这里就涉及到两次渲染(即用户需要进行两次 `graph.draw()` ),这种场景下,默认模式会入栈两次历史记录,分别是:
- 展示节点 A 和 B
- 展示 A->B 的连线
显然,实际业务中,一次操作,也应该只需一次撤销。
但这里在撤销本次操作时,用户需要调用两次 `undo` 方法,也就是需要进行两次撤销。
#### 场景支持
为了支持这样的场景,G6 提供了一个批量控制器( `BatchController`,[可参考源码](https://github.com/antvis/G6/blob/v5/packages/g6/src/runtime/batch.ts)),在图实例上下文中提供了这个批量控制器实例。
历史记录插件则基于这个批量控制器,来实现自定义操作记录,代码示例如下:
```typescript
const graph = new Graph({
// 其他配置...
plugins: [
{
type: 'history',
key: 'history',
},
],
});
graph.context.batch.startBatch(); // 开始批量操作
graph.addNodeData(...); // 把节点 A、B 展示出来
graph.draw(); // 第一次触发渲染
graph.addEdgeData(...); // 把 A->B 连线展示出来
graph.draw(); // 第二次触发渲染
graph.context.batch.endBatch(); // 结束批量操作
```
示例中:
- 通过调用批量控制器实例的 `startBatch` 方法,告诉历史记录插件,现在开始进行批量操作,在批量操作没有结束前,不管触发多少次渲染,都不能进行历史记录入栈(历史记录插件会把每次触发渲染的变更数据记录下来)
- 在完成最后一次数据变更后,调用 `endBatch()` 方法,历史记录插件监听到批量操作完成,则把本次批量操作作为一次历史记录入栈
最终,用户只需要进行一次 `undo` 即可撤销。
## 代码示例
下面列举一些常见的案例,并给出相应的代码参考
### 撤销、重做按钮状态
实际业务场景中,可能需要自定义画布的工具栏,也就涉及到撤销和重做按钮的启禁用状态
```typescript
const canUndo = false;
const canRedo = false;
const graph = new Graph({
// 其他配置...
plugins: [
{
type: 'history',
key: 'history',
},
],
});
const historyInstance = graph.getPluginInstance('history');
historyInstance.on(HistoryEvent.CHANGE, () => {
canUndo = historyInstance.canUndo();
canRedo = historyInstance.canRedo();
});
```
示例中通过监听 `HistoryEvent.CHANGE` 事件,这个事件在历史队列发生变化时会触发,每次发生变化后,实时判断当前是否可以进行撤销和重做操作
### 判断是否允许命令进入队列
这里实现一个简单的场景:只有移除元素的操作才允许进入历史记录队列
```typescript
const graph = new Graph({
// 其他配置...
plugins: [
{
type: 'history',
key: 'history',
beforeAddCommand: (cmd) => {
return (
cmd.current.remove?.nodes?.length > 0 ||
cmd.current.remove?.combos?.length > 0 ||
cmd.current.remove?.edges?.length > 0
);
},
},
],
});
```
示例中通过配置项 [beforeAddCommand](#beforeAddCommand) 来实现,判断 `cmd.current.remove` 里面是否存在被移除的元素
Plugin Skill
packages/site/docs/manual/plugin/Hull.en.md anthropic-skill ~3,438 tokens---
title: Hull
order: 10
---
## Overview
Hull is used to process and represent the convex or concave polygon bounding box of a set of points. It can wrap a set of nodes in a minimal geometric shape, helping users better understand and analyze datasets.
- **Convex Hull**: This is a convex polygon that contains all the points and has no indentations.
- **Concave Hull**: This is a concave polygon that also contains all the points but may have indentations. The degree of indentation is controlled by the concavity parameter.
## Usage Scenarios
The hull plugin is mainly applicable to the following scenarios:
- Wrapping node collections in data visualization
- Providing visual references to enhance spatial awareness
- Identifying the collection relationship of specific nodes in complex network graphs
## Basic Usage
Below is a simple example of initializing the Hull plugin:
```js
const graph = new Graph({
plugins: [
{
type: 'hull',
key: 'my-hull', // Specify a unique identifier for subsequent dynamic updates
members: ['node-1', 'node-2'], // List of node IDs to be wrapped
concavity: Infinity, // Default to convex hull
},
],
});
```
## Online Experience
<embed src="@/common/api/plugins/hull.md"></embed>
## Configuration Options
| Property | Description | Type | Default Value | Required |
| ---------------- | -------------------------------------------------------------------------------------------------------- | -------------------------------------------------- | ------------- | -------- |
| type | Plugin type | string | `hull` | ✓ |
| key | Unique identifier for the plugin, used for subsequent updates | string | - | |
| members | Elements within the Hull, including nodes and edges | string[] | - | ✓ |
| concavity | Concavity, the larger the value, the smaller the concavity; default is Infinity representing Convex Hull | number | Infinity | |
| corner | Corner type, options are `rounded` \| `smooth` \| `sharp` | string | `rounded` | |
| padding | Padding | number | `10` | |
| label | Whether to display the label | boolean | true | |
| labelPlacement | Label position | `left` \| `right` \| `top` \| `bottom` \| `center` | `bottom` | |
| labelBackground | Whether to display the background | boolean | false | |
| labelPadding | Label padding | number \| number[] | 0 | |
| labelCloseToPath | Whether the label is close to the hull | boolean | true | |
| labelAutoRotate | Whether the label rotates with the hull, effective only when closeToPath is true | boolean | true | |
| labelOffsetX | X-axis offset | number | 0 | |
| labelOffsetY | Y-axis offset | number | 0 | |
| labelMaxWidth | Maximum width of the text, exceeding will automatically ellipsis | number | 0 | |
For complete label styles, see [this link](https://g6.antv.antgroup.com/manual/element/node/base-node#%E6%A0%87%E7%AD%BE%E6%A0%B7%E5%BC%8F)
### concavity
The concavity attribute is used to control the concavity of the Hull. When set to Infinity, a convex hull is generated; otherwise, a concave hull is generated.
```js
// Convex hull example
const graph = new Graph({
plugins: [
{
type: 'hull',
concavity: Infinity, // Convex hull
members: ['node-1', 'node-2'],
},
],
});
// Concave hull example
const graph = new Graph({
plugins: [
{
type: 'hull',
concavity: 50, // Concave hull
members: ['node-1', 'node-2'],
},
],
});
```
## Code Examples
### Basic Hull
The simplest way is to use the preset configuration directly:
```js
const graph = new Graph({
plugins: [
{
type: 'hull',
members: ['node-1', 'node-2'], // List of node IDs to be wrapped
},
],
});
```
The effect is as follows:
```js | ob { pin: false, inject: true }
import { Graph } from '@antv/g6';
const graph = new Graph({
container: 'container',
width: 300,
height: 150,
autoFit: 'view',
data: {
nodes: [
{
id: 'node-0',
data: { cluster: 'a' },
style: { x: 555, y: 151 },
},
{
id: 'node-1',
data: { cluster: 'a' },
style: { x: 532, y: 323 },
},
{
id: 'node-2',
data: { cluster: 'a' },
style: { x: 473, y: 227 },
},
{
id: 'node-3',
data: { cluster: 'a' },
style: { x: 349, y: 212 },
},
{
id: 'node-4',
data: { cluster: 'b' },
style: { x: 234, y: 201 },
},
{
id: 'node-5',
data: { cluster: 'b' },
style: { x: 338, y: 333 },
},
{
id: 'node-6',
data: { cluster: 'b' },
style: { x: 365, y: 91 },
},
],
edges: [
{
source: 'node-0',
target: 'node-2',
},
{
source: 'node-1',
target: 'node-2',
},
{
source: 'node-2',
target: 'node-3',
},
{
source: 'node-3',
target: 'node-4',
},
{
source: 'node-3',
target: 'node-5',
},
{
source: 'node-3',
target: 'node-6',
},
],
},
plugins: [
{
type: 'hull',
members: ['node-1', 'node-2'], // List of node IDs to be wrapped
},
],
behaviors: ['zoom-canvas', 'drag-canvas'],
});
graph.render();
```
### Custom Styles
You can customize the style of the Hull as needed, such as adjusting color, transparency, and other properties.
```js
const graph = new Graph({
plugins: [
{
type: 'hull',
members: ['node-1', 'node-2', 'node-3'],
stroke: '#ff000033', // Red semi-transparent border
fill: '#7e3feb', // Light purple fill
fillOpacity: 0.2,
lineWidth: 2,
padding: 15, // Larger padding
},
],
});
```
The effect is as follows:
```js | ob { pin: false, inject: true }
import { Graph } from '@antv/g6';
const graph = new Graph({
container: 'container',
width: 300,
height: 150,
autoFit: 'view',
data: {
nodes: [
{
id: 'node-0',
data: { cluster: 'a' },
style: { x: 555, y: 151 },
},
{
id: 'node-1',
data: { cluster: 'a' },
style: { x: 532, y: 323 },
},
{
id: 'node-2',
data: { cluster: 'a' },
style: { x: 473, y: 227 },
},
{
id: 'node-3',
data: { cluster: 'a' },
style: { x: 349, y: 212 },
},
{
id: 'node-4',
data: { cluster: 'b' },
style: { x: 234, y: 201 },
},
{
id: 'node-5',
data: { cluster: 'b' },
style: { x: 338, y: 333 },
},
{
id: 'node-6',
data: { cluster: 'b' },
style: { x: 365, y: 91 },
},
],
edges: [
{
source: 'node-0',
target: 'node-2',
},
{
source: 'node-1',
target: 'node-2',
},
{
source: 'node-2',
target: 'node-3',
},
{
source: 'node-3',
target: 'node-4',
},
{
source: 'node-3',
target: 'node-5',
},
{
source: 'node-3',
target: 'node-6',
},
],
},
plugins: [
{
type: 'hull',
members: ['node-1', 'node-2', 'node-3'],
stroke: '#ff000033', // Red semi-transparent border
fill: '#7e3feb', // Light purple fill
fillOpacity: 0.2,
lineWidth: 2,
padding: 15, // Larger padding
},
],
behaviors: ['zoom-canvas', 'drag-canvas'],
});
graph.render();
```
### Label Configuration
You can configure the position, background, offset, and other properties of the label to enhance the visual effect.
```js
const graph = new Graph({
plugins: [
{
type: 'hull',
members: ['node-1', 'node-2'],
label: true, // Display label
labelText: 'hull-a',
labelPlacement: 'top', // Label position
labelBackground: true, // Display label background
labelPadding: 5, // Label padding
},
],
});
```
The effect is as follows:
```js | ob { pin: false, inject: true }
import { Graph } from '@antv/g6';
const graph = new Graph({
container: 'container',
width: 300,
height: 150,
autoFit: 'center',
data: {
nodes: [
{
id: 'node-0',
data: { cluster: 'a' },
style: { x: 555, y: 151 },
},
{
id: 'node-1',
data: { cluster: 'a' },
style: { x: 532, y: 323 },
},
{
id: 'node-2',
data: { cluster: 'a' },
style: { x: 473, y: 227 },
},
{
id: 'node-3',
data: { cluster: 'a' },
style: { x: 349, y: 212 },
},
{
id: 'node-4',
data: { cluster: 'b' },
style: { x: 234, y: 201 },
},
{
id: 'node-5',
data: { cluster: 'b' },
style: { x: 338, y: 333 },
},
{
id: 'node-6',
data: { cluster: 'b' },
style: { x: 365, y: 91 },
},
],
edges: [
{
source: 'node-0',
target: 'node-2',
},
{
source: 'node-1',
target: 'node-2',
},
{
source: 'node-2',
target: 'node-3',
},
{
source: 'node-3',
target: 'node-4',
},
{
source: 'node-3',
target: 'node-5',
},
{
source: 'node-3',
target: 'node-6',
},
],
},
plugins: [
{
type: 'hull',
members: ['node-1', 'node-2'],
label: true, // Display label
labelText: 'hull-a',
labelPlacement: 'top', // Label position
labelBackground: true, // Display label background
labelPadding: 5, // Label padding
},
],
behaviors: ['zoom-canvas', 'drag-canvas'],
});
graph.render();
```
## Practical Cases
```js | ob { inject: true }
import { Graph } from '@antv/g6';
fetch('https://assets.antv.antgroup.com/g6/collection.json')
.then((res) => res.json())
.then((data) => {
const groupedNodesByCluster = data.nodes.reduce((acc, node) => {
const cluster = node.data.cluster;
acc[cluster] ||= [];
acc[cluster].push(node.id);
return acc;
}, {});
const createStyle = (baseColor) => ({
fill: baseColor,
stroke: baseColor,
labelFill: '#fff',
labelPadding: 2,
labelBackgroundFill: baseColor,
labelBackgroundRadius: 5,
});
const graph = new Graph({
container: 'container',
data,
behaviors: ['zoom-canvas', 'drag-canvas', 'drag-element'],
node: {
palette: { field: 'cluster' },
},
layout: {
type: 'force',
preventOverlap: true,
linkDistance: (d) => {
if (d.source === 'node0' || d.target === 'node0') {
return 200;
}
return 80;
},
},
plugins: [
{
key: 'hull-a',
type: 'hull',
members: groupedNodesByCluster['a'],
labelText: 'cluster-a',
...createStyle('#1783FF'),
},
{
key: 'hull-b',
type: 'hull',
members: groupedNodesByCluster['b'],
labelText: 'cluster-b',
...createStyle('#00C9C9'),
},
{
key: 'hull-c',
type: 'hull',
members: groupedNodesByCluster['c'],
labelText: 'cluster-c',
...createStyle('#F08F56'),
},
{
key: 'hull-d',
type: 'hull',
members: groupedNodesByCluster['d'],
labelText: 'cluster-d',
...createStyle('#D580FF'),
},
],
autoFit: 'center',
});
graph.render();
});
```
Plugin Skill
packages/site/docs/manual/plugin/Hull.zh.md anthropic-skill ~2,842 tokens---
title: 轮廓包围 Hull
order: 10
---
## 概述
轮廓包围(Hull)用于处理和表示一组点的凸多边形或凹多边形包围盒。它可以将一组节点包裹在一个最小的几何形状中,帮助用户更好地理解和分析数据集。
- **凸包(Convex Hull)**:这是一个凸多边形,它包含所有的点,并且没有任何凹陷。
- **凹包(Concave Hull)**:这是一个凹多边形,它同样包含所有的点,但是可能会有凹陷。凹包的凹陷程度由 concavity 参数控制。
## 使用场景
轮廓包围插件主要适用于以下场景:
- 数据可视化中的节点集合包裹
- 提供视觉参考,增强空间感知
- 在复杂网络图中标识特定节点的集合关系
## 基本用法
以下是一个简单的 Hull 插件初始化示例:
```js
const graph = new Graph({
plugins: [
{
type: 'hull',
key: 'my-hull', // 指定唯一标识符,便于后续动态更新
members: ['node-1', 'node-2'], // 需要包裹的节点 ID 列表
concavity: Infinity, // 默认为凸包
},
],
});
```
## 在线体验
<embed src="@/common/api/plugins/hull.md"></embed>
## 配置项
| 属性 | 描述 | 类型 | 默认值 | 必选 |
| ---------------- | ---------------------------------------------------------- | -------------------------------------------------- | --------- | ---- |
| type | 插件类型 | string | `hull` | ✓ |
| key | 插件唯一标识符,用于后续更新 | string | - | |
| members | Hull 内的元素,包括节点和边 | string[] | - | ✓ |
| concavity | 凹度,数值越大凹度越小;默认为 Infinity 代表为 Convex Hull | number | Infinity | |
| corner | 拐角类型,可选值为 `rounded` \| `smooth` \| `sharp` | string | `rounded` | |
| padding | 内边距 | number | `10` | |
| label | 是否显示标签 | boolean | true | |
| labelPlacement | 标签位置 | `left` \| `right` \| `top` \| `bottom` \| `center` | `bottom` | |
| labelBackground | 是否显示背景 | boolean | false | |
| labelPadding | 标签内边距 | number \| number[] | 0 | |
| labelCloseToPath | 标签是否贴合轮廓 | boolean | true | |
| labelAutoRotate | 标签是否跟随轮廓旋转,仅在 closeToPath 为 true 时生效 | boolean | true | |
| labelOffsetX | x 轴偏移量 | number | 0 | |
| labelOffsetY | y 轴偏移量 | number | 0 | |
| labelMaxWidth | 文本的最大宽度,超出会自动省略 | number | 0 | |
完整的标签样式见[此链接](https://g6.antv.antgroup.com/manual/element/node/base-node#%E6%A0%87%E7%AD%BE%E6%A0%B7%E5%BC%8F)
### concavity
concavity 属性用于控制 Hull 的凹度。当设置为 Infinity 时,生成的是凸包;否则会生成凹包。
```js
// 凸包示例
const graph = new Graph({
plugins: [
{
type: 'hull',
concavity: Infinity, // 凸包
members: ['node-1', 'node-2'],
},
],
});
// 凹包示例
const graph = new Graph({
plugins: [
{
type: 'hull',
concavity: 50, // 凹包
members: ['node-1', 'node-2'],
},
],
});
```
## 代码示例
### 基础 Hull
最简单的方式是直接使用预设配置:
```js
const graph = new Graph({
plugins: [
{
type: 'hull',
members: ['node-1', 'node-2'], // 需要包裹的节点 ID 列表
},
],
});
```
效果如下:
```js | ob { pin: false, inject: true }
import { Graph } from '@antv/g6';
const graph = new Graph({
container: 'container',
width: 300,
height: 150,
autoFit: 'view',
data: {
nodes: [
{
id: 'node-0',
data: { cluster: 'a' },
style: { x: 555, y: 151 },
},
{
id: 'node-1',
data: { cluster: 'a' },
style: { x: 532, y: 323 },
},
{
id: 'node-2',
data: { cluster: 'a' },
style: { x: 473, y: 227 },
},
{
id: 'node-3',
data: { cluster: 'a' },
style: { x: 349, y: 212 },
},
{
id: 'node-4',
data: { cluster: 'b' },
style: { x: 234, y: 201 },
},
{
id: 'node-5',
data: { cluster: 'b' },
style: { x: 338, y: 333 },
},
{
id: 'node-6',
data: { cluster: 'b' },
style: { x: 365, y: 91 },
},
],
edges: [
{
source: 'node-0',
target: 'node-2',
},
{
source: 'node-1',
target: 'node-2',
},
{
source: 'node-2',
target: 'node-3',
},
{
source: 'node-3',
target: 'node-4',
},
{
source: 'node-3',
target: 'node-5',
},
{
source: 'node-3',
target: 'node-6',
},
],
},
plugins: [
{
type: 'hull',
members: ['node-1', 'node-2'], // 需要包裹的节点 ID 列表
},
],
behaviors: ['zoom-canvas', 'drag-canvas'],
});
graph.render();
```
### 自定义样式
您可以根据需要自定义 Hull 的样式,例如调整颜色、透明度等属性。
```js
const graph = new Graph({
plugins: [
{
type: 'hull',
members: ['node-1', 'node-2', 'node-3'],
stroke: '#ff000033', // 红色半透明边框
fill: '#7e3feb', // 浅紫色填充
fillOpacity: 0.2,
lineWidth: 2,
padding: 15, // 更大的内边距
},
],
});
```
效果如下:
```js | ob { pin: false, inject: true }
import { Graph } from '@antv/g6';
const graph = new Graph({
container: 'container',
width: 300,
height: 150,
autoFit: 'view',
data: {
nodes: [
{
id: 'node-0',
data: { cluster: 'a' },
style: { x: 555, y: 151 },
},
{
id: 'node-1',
data: { cluster: 'a' },
style: { x: 532, y: 323 },
},
{
id: 'node-2',
data: { cluster: 'a' },
style: { x: 473, y: 227 },
},
{
id: 'node-3',
data: { cluster: 'a' },
style: { x: 349, y: 212 },
},
{
id: 'node-4',
data: { cluster: 'b' },
style: { x: 234, y: 201 },
},
{
id: 'node-5',
data: { cluster: 'b' },
style: { x: 338, y: 333 },
},
{
id: 'node-6',
data: { cluster: 'b' },
style: { x: 365, y: 91 },
},
],
edges: [
{
source: 'node-0',
target: 'node-2',
},
{
source: 'node-1',
target: 'node-2',
},
{
source: 'node-2',
target: 'node-3',
},
{
source: 'node-3',
target: 'node-4',
},
{
source: 'node-3',
target: 'node-5',
},
{
source: 'node-3',
target: 'node-6',
},
],
},
plugins: [
{
type: 'hull',
members: ['node-1', 'node-2', 'node-3'],
stroke: '#ff000033', // 红色半透明边框
fill: '#7e3feb', // 浅紫色填充
fillOpacity: 0.2,
lineWidth: 2,
padding: 15, // 更大的内边距
},
],
behaviors: ['zoom-canvas', 'drag-canvas'],
});
graph.render();
```
### 标签配置
您可以配置标签的位置、背景、偏移量等属性,以增强可视化效果。
```js
const graph = new Graph({
plugins: [
{
type: 'hull',
members: ['node-1', 'node-2'],
label: true, // 显示标签
labelText: 'hull-a',
labelPlacement: 'top', // 标签位置
labelBackground: true, // 显示标签背景
labelPadding: 5, // 标签内边距
},
],
});
```
效果如下:
```js | ob { pin: false, inject: true }
import { Graph } from '@antv/g6';
const graph = new Graph({
container: 'container',
width: 300,
height: 150,
autoFit: 'center',
data: {
nodes: [
{
id: 'node-0',
data: { cluster: 'a' },
style: { x: 555, y: 151 },
},
{
id: 'node-1',
data: { cluster: 'a' },
style: { x: 532, y: 323 },
},
{
id: 'node-2',
data: { cluster: 'a' },
style: { x: 473, y: 227 },
},
{
id: 'node-3',
data: { cluster: 'a' },
style: { x: 349, y: 212 },
},
{
id: 'node-4',
data: { cluster: 'b' },
style: { x: 234, y: 201 },
},
{
id: 'node-5',
data: { cluster: 'b' },
style: { x: 338, y: 333 },
},
{
id: 'node-6',
data: { cluster: 'b' },
style: { x: 365, y: 91 },
},
],
edges: [
{
source: 'node-0',
target: 'node-2',
},
{
source: 'node-1',
target: 'node-2',
},
{
source: 'node-2',
target: 'node-3',
},
{
source: 'node-3',
target: 'node-4',
},
{
source: 'node-3',
target: 'node-5',
},
{
source: 'node-3',
target: 'node-6',
},
],
},
plugins: [
{
type: 'hull',
members: ['node-1', 'node-2'],
label: true, // 显示标签
labelText: 'hull-a',
labelPlacement: 'top', // 标签位置
labelBackground: true, // 显示标签背景
labelPadding: 5, // 标签内边距
},
],
behaviors: ['zoom-canvas', 'drag-canvas'],
});
graph.render();
```
## 实际案例
```js | ob { inject: true }
import { Graph } from '@antv/g6';
fetch('https://assets.antv.antgroup.com/g6/collection.json')
.then((res) => res.json())
.then((data) => {
const groupedNodesByCluster = data.nodes.reduce((acc, node) => {
const cluster = node.data.cluster;
acc[cluster] ||= [];
acc[cluster].push(node.id);
return acc;
}, {});
const createStyle = (baseColor) => ({
fill: baseColor,
stroke: baseColor,
labelFill: '#fff',
labelPadding: 2,
labelBackgroundFill: baseColor,
labelBackgroundRadius: 5,
});
const graph = new Graph({
container: 'container',
data,
behaviors: ['zoom-canvas', 'drag-canvas', 'drag-element'],
node: {
palette: { field: 'cluster' },
},
layout: {
type: 'force',
preventOverlap: true,
linkDistance: (d) => {
if (d.source === 'node0' || d.target === 'node0') {
return 200;
}
return 80;
},
},
plugins: [
{
key: 'hull-a',
type: 'hull',
members: groupedNodesByCluster['a'],
labelText: 'cluster-a',
...createStyle('#1783FF'),
},
{
key: 'hull-b',
type: 'hull',
members: groupedNodesByCluster['b'],
labelText: 'cluster-b',
...createStyle('#00C9C9'),
},
{
key: 'hull-c',
type: 'hull',
members: groupedNodesByCluster['c'],
labelText: 'cluster-c',
...createStyle('#F08F56'),
},
{
key: 'hull-d',
type: 'hull',
members: groupedNodesByCluster['d'],
labelText: 'cluster-d',
...createStyle('#D580FF'),
},
],
autoFit: 'center',
});
graph.render();
});
```
```
```
Plugin Skill
packages/site/docs/manual/plugin/Legend.en.md anthropic-skill ~3,696 tokens---
title: Legend
order: 11
---
## Overview
The Legend plugin is used to display classification information of elements in the graph, supporting the display of classification information for nodes, edges, and combos. Through the legend, users can quickly perceive the classification information of related elements in the graph and quickly locate elements by clicking on the corresponding legend items, improving user browsing efficiency.
## Usage Scenarios
This plugin is mainly used for:
- Quickly classifying elements through the legend
- Quickly highlighting and locating corresponding elements through the legend
## Basic Usage
```js
const data = {
nodes: [
{ id: 'node-1', type: 'circle', data: { cluster: 'node-type1' } },
{ id: 'node-2', type: 'rect', data: { cluster: 'node-type2' } },
],
edges: [{ source: 'node-1', target: 'node-2', data: { cluster: 'edge-type1' } }],
};
const graph = new Graph({
data,
// Other configurations...
plugins: [
{
type: 'legend', // Plugin type is legend
nodeField: 'cluster', // Array field name for node grouping
edgeField: 'cluster', // Array field name for edge grouping
},
],
});
```
## Configuration Options
| Property | Description | Type | Default Value | Required |
| ----------------- | ---------------------------------------------------------------------------------------------------------------------------------------------------------------------------------------------- | ------------------------------------------------------------------------------------------- | ------------- | -------- |
| type | Plugin type | string | `legend` | ✓ |
| key | Unique identifier for the plugin, used for subsequent updates | string | - | |
| trigger | How the legend item triggers the corresponding item highlight: <br/>- `hover`: Triggered when the mouse enters the legend item <br/>- `click`: Triggered when the mouse clicks the legend item | `hover` \| `click` | `hover` | |
| position | Relative position of the legend on the canvas, [optional values](#cardinalplacement) | [CardinalPlacement](#cardinalplacement) | `bottom` | |
| container | Container to which the legend is mounted, if not provided, it is mounted to the container where the Graph is located | HTMLElement \| string | - | |
| className | Legend canvas class name, not effective when an external container is passed | string | - | |
| containerStyle | Style of the legend container, not effective when an external container is passed | [CSSStyleDeclaration](https://developer.mozilla.org/en-US/docs/Web/API/CSSStyleDeclaration) | - | |
| nodeField | Node classification identifier | string \| (item: ElementDatum) => string | - | |
| edgeField | Edge classification identifier | string \| (item: ElementDatum) => string | - | |
| comboField | Combo classification identifier | string \| (item: ElementDatum) => string | - | |
| orientation | Layout direction of legend items: <br/>- `horizontal`: Horizontal direction <br/>- `vertical`: Vertical direction | `horizontal` \| `vertical` | 'horizontal' | |
| layout | Layout method: <br/>- `flex`: Flexible layout <br/>- `grid`: Grid layout | `flex` \| `grid` | `flex` | |
| showTitle | Whether to display the title | boolean | false |
| titleText | Title content | string | "" |
| x | Relative horizontal position of the legend on the canvas, higher priority than position | number | - | |
| y | Relative vertical position of the legend on the canvas, higher priority than position | number | - | |
| width | Width of the legend | number | 240 | |
| height | Height of the legend | number | 160 | |
| itemSpacing | Spacing between the text of the legend item and the corresponding marker | number | 4 | |
| rowPadding | Spacing between each row in the legend | number | 10 | |
| colPadding | Spacing between each column in the legend | number | 10 | |
| itemMarkerSize | Size of the legend item marker | number | 16 | |
| itemLabelFontSize | Font size of the legend item text | number | 16 | |
| gridCol | Maximum number of columns allowed for legend items when width permits | number | - | |
| gridRow | Maximum number of rows allowed for legend items when height permits | number | - | |
### CardinalPlacement
The `position` property supports the following values:
- `'top-left'`: Top left corner
- `'top-right'`: Top right corner
- `'bottom-left'`: Bottom left corner
- `'bottom-right'`: Bottom right corner
- `'left-top'`: Left side near the top
- `'left-bottom'`: Left side near the bottom
- `'right-top'`: Right side near the top
- `'right-bottom'`: Right side near the bottom
## Code Examples
### Basic Legend
```js
const data = {
nodes: [
{ id: 'node-1', type: 'circle', data: { cluster: 'node-type1' } },
{ id: 'node-2', type: 'rect', data: { cluster: 'node-type2' } },
],
edges: [{ source: 'node-1', target: 'node-2', data: { cluster: 'edge-type1' } }],
};
const graph = new Graph({
// Other configurations...
plugins: [
{
type: 'legend', // Plugin type is legend
nodeField: 'cluster', // Array field name for node grouping
edgeField: 'cluster', // Array field name for edge grouping
},
],
});
```
### Custom Legend Position
```js
const data = {
nodes: [
{ id: 'node-1', type: 'circle', data: { cluster: 'node-type1' } },
{ id: 'node-2', type: 'rect', data: { cluster: 'node-type2' } },
],
edges: [{ source: 'node-1', target: 'node-2', data: { cluster: 'edge-type1' } }],
};
const graph = new Graph({
data,
// Other configurations...
plugins: [
{
type: 'legend',
nodeField: 'cluster',
edgeField: 'cluster',
// You can quickly specify the position through position
// position: "top-left",
// Or you can more flexibly control the position of the legend through x, y
x: 20,
y: 20,
},
],
});
```
### Custom Legend Item Layout
```js
const data = {
nodes: [
{ id: 'node-1', type: 'circle', data: { cluster: 'node-type1' } },
{ id: 'node-2', type: 'rect', data: { cluster: 'node-type2' } },
],
edges: [{ source: 'node-1', target: 'node-2', data: { cluster: 'edge-type1' } }],
};
const graph = new Graph({
data,
// Other configurations...
plugins: [
{
type: 'legend',
nodeField: 'cluster',
edgeField: 'cluster',
layout: 'flex',
// Control to display only one row
gridRow: 1,
// Control to display 10 columns in one row, a page button will be displayed when the column width is insufficient
gridCol: 10,
},
],
});
```
## Common Issues
### 1. Setting orientation is ineffective?
`orientation` mainly controls the direction of the layout, and the specific display of **multiple columns in one row** or **multiple rows in one column** is mainly controlled by `gridRow` and `gridCol`. For example, if you want it to look like a vertical legend item, you can configure it like this:
```js
plugins: [
{
type: 'legend',
nodeField: 'cluster',
edgeField: 'cluster',
layout: "flex",
// Control to display 1 column in one row
gridCol:1,
// Control to display up to 20 rows
gridRow: 20,
},
],
```
This way, it becomes a legend with only one column, conforming to the visual vertical arrangement.
### 2. How to dynamically update the toolbar?
You can use the `updatePlugin` method to dynamically update the toolbar:
```js
const graph = new Graph({
data,
// Other configurations...
plugins: [
{
type: 'legend',
key: 'my-legend',
nodeField: 'cluster',
edgeField: 'cluster',
},
],
});
// Update legend position
graph.updatePlugin({
key: 'my-legend',
position: 'bottom-right',
});
```
## Practical Cases
```js | ob { inject: true }
import { Graph } from '@antv/g6';
const data = {
nodes: [
{ id: 'node-1', type: 'circle', data: { cluster: 'node-type1' } },
{ id: 'node-2', type: 'rect', data: { cluster: 'node-type2' } },
{ id: 'node-3', type: 'triangle', data: { cluster: 'node-type3' } },
{ id: 'node-4', type: 'diamond', data: { cluster: 'node-type4' } },
],
edges: [
{ source: 'node-1', target: 'node-2', data: { cluster: 'edge-type1' } },
{ source: 'node-1', target: 'node-4', data: { cluster: 'edge-type2' } },
{ source: 'node-3', target: 'node-4' },
{ source: 'node-2', target: 'node-4', data: { cluster: 'edge-type3' } },
],
};
const graph = new Graph({
container: 'container',
data,
node: {
style: { size: 32 },
palette: {
field: 'cluster',
},
},
layout: {
type: 'force',
},
plugins: [
{
type: 'legend',
nodeField: 'cluster',
edgeField: 'cluster',
},
],
});
graph.render();
```
Plugin Skill
packages/site/docs/manual/plugin/Legend.zh.md anthropic-skill ~2,606 tokens---
title: 图例 Legend
order: 11
---
## 概述
图例(Legend)插件用于展示图中元素的分类信息,支持节点、边、组合的分类信息展示。通过图例,用户可以快速感知到图中相关元素的分类信息,也可以通过点击对应图例项来快速定位到元素,提高用户的浏览效率。
## 使用场景
这一插件主要用于:
- 通过图例快速对元素进行分类
- 通过图例快速高亮定位到对应元素
## 基本用法
```js
const data = {
nodes: [
{ id: 'node-1', type: 'circle', data: { cluster: 'node-type1' } },
{ id: 'node-2', type: 'rect', data: { cluster: 'node-type2' } },
],
edges: [{ source: 'node-1', target: 'node-2', data: { cluster: 'edge-type1' } }],
};
const graph = new Graph({
data,
// 其他配置...
plugins: [
{
type: 'legend', // 插件类型为 legend
nodeField: 'cluster', // 用于节点分组的数组字段名称
edgeField: 'cluster', // 用于边分组的数组字段名称
},
],
});
```
## 配置项
| 属性 | 描述 | 类型 | 默认值 | 必选 |
| ----------------- | ----------------------------------------------------------------------------------------------------- | ------------------------------------------------------------------------------------------- | ------------ | ---- |
| type | 插件类型 | string | `legend` | ✓ |
| key | 插件唯一标识符,用于后续更新 | string | - | |
| trigger | 图例项触发对应项高亮的方式:<br/>- `hover`:鼠标移入图例项时触发 <br/>- `click`:鼠标点击图例项时触发 | `hover` \| `click` | `hover` | |
| position | 图例在画布中的相对位置,[可选值](#cardinalplacement) | [CardinalPlacement](#cardinalplacement) | `bottom` | |
| container | 图例挂载的容器,无则挂载到 Graph 所在容器 | HTMLElement \| string | - | |
| className | 图例画布类名,传入外置容器时不生效 | string | - | |
| containerStyle | 图例的容器样式,传入外置容器时不生效 | [CSSStyleDeclaration](https://developer.mozilla.org/zh-CN/docs/Web/API/CSSStyleDeclaration) | - | |
| nodeField | 节点分类标识 | string \| (item: ElementDatum) => string | - | |
| edgeField | 边分类标识 | string \| (item: ElementDatum) => string | - | |
| comboField | 组合分类标识 | string \| (item: ElementDatum) => string | - | |
| orientation | 图例项的布局方向:<br/>- `horizontal`:水平方向 <br/>- `vertical`:垂直方向 | `horizontal` \| `vertical` | 'horizontal' | |
| layout | 布局方式:<br/>- `flex`:弹性布局 <br/>- `grid`:网格布局 | `flex` \| `grid` | `flex` | |
| showTitle | 是否显示标题 | boolean | false |
| titleText | 标题内容 | string | "" |
| x | 图例在画布中的相对的横向位置,优先级高于position | number | - | |
| y | 图例在画布中的相对的纵向位置,优先级高于position | number | - | |
| width | 图例的宽度 | number | 240 | |
| height | 图例的高度 | number | 160 | |
| itemSpacing | 图例项的文本和对应标记之间的间距 | number | 4 | |
| rowPadding | 图例中每行之间的间距 | number | 10 | |
| colPadding | 图例中每列之间的间距 | number | 10 | |
| itemMarkerSize | 图例项标记的大小 | number | 16 | |
| itemLabelFontSize | 图例项文本的字体大小 | number | 16 | |
| gridCol | 图例项在宽度允许情况下的最大列数 | number | - | |
| gridRow | 图例项在高度允许情况下的最大行数 | number | - | |
### CardinalPlacement
`position` 属性支持以下值:
- `'top-left'`:左上角
- `'top-right'`:右上角
- `'bottom-left'`:左下角
- `'bottom-right'`:右下角
- `'left-top'`:左侧靠上
- `'left-bottom'`:左侧靠下
- `'right-top'`:右侧靠上
- `'right-bottom'`:右侧靠下
## 代码示例
### 基础图例
```js
const data = {
nodes: [
{ id: 'node-1', type: 'circle', data: { cluster: 'node-type1' } },
{ id: 'node-2', type: 'rect', data: { cluster: 'node-type2' } },
],
edges: [{ source: 'node-1', target: 'node-2', data: { cluster: 'edge-type1' } }],
};
const graph = new Graph({
// 其他配置...
plugins: [
{
type: 'legend', // 插件类型为 legend
nodeField: 'cluster', // 用于节点分组的数组字段名称
edgeField: 'cluster', // 用于边分组的数组字段名称
},
],
});
```
### 自定义图例位置
```js
const data = {
nodes: [
{ id: 'node-1', type: 'circle', data: { cluster: 'node-type1' } },
{ id: 'node-2', type: 'rect', data: { cluster: 'node-type2' } },
],
edges: [{ source: 'node-1', target: 'node-2', data: { cluster: 'edge-type1' } }],
};
const graph = new Graph({
data,
// 其他配置...
plugins: [
{
type: 'legend',
nodeField: 'cluster',
edgeField: 'cluster',
// 可以通过 position 快捷的来指定位置
// position: "top-left",
// 也可以通过x,y来更加灵活的控制图例的位置
x: 20,
y: 20,
},
],
});
```
### 自定义图例项布局
```js
const data = {
nodes: [
{ id: 'node-1', type: 'circle', data: { cluster: 'node-type1' } },
{ id: 'node-2', type: 'rect', data: { cluster: 'node-type2' } },
],
edges: [{ source: 'node-1', target: 'node-2', data: { cluster: 'edge-type1' } }],
};
const graph = new Graph({
data,
// 其他配置...
plugins: [
{
type: 'legend',
nodeField: 'cluster',
edgeField: 'cluster',
layout: 'flex',
// 控制只显示一行
gridRow: 1,
// 控制一行显示10列,当列宽不足时会显示翻页按钮
gridCol: 10,
},
],
});
```
## 常见问题
### 1. 设置了 orientation 无效?
`orientation`主要控制布局的方向,具体展示**一行多列**还是**一列多行**,主要通过 `gridRow` 以及`gridCol`来控制,例如想要看起来像是竖向的图例项,则可以通过这样配置:
```js
plugins: [
{
type: 'legend',
nodeField: 'cluster',
edgeField: 'cluster',
layout: "flex",
// 控制一行显示1列
gridCol:1,
// 控制显示最多20行
gridRow: 20,
},
],
```
这样就变成了只有一列的图例,符合视觉上的竖向排列。
### 2. 如何动态更新工具栏?
可以使用 `updatePlugin` 方法动态更新工具栏:
```js
const graph = new Graph({
data,
// 其他配置...
plugins: [
{
type: 'legend',
key: 'my-legend',
nodeField: 'cluster',
edgeField: 'cluster',
},
],
});
// 更新图例位置
graph.updatePlugin({
key: 'my-legend',
position: 'bottom-right',
});
```
## 实际案例
```js | ob { inject: true }
import { Graph } from '@antv/g6';
const data = {
nodes: [
{ id: 'node-1', type: 'circle', data: { cluster: 'node-type1' } },
{ id: 'node-2', type: 'rect', data: { cluster: 'node-type2' } },
{ id: 'node-3', type: 'triangle', data: { cluster: 'node-type3' } },
{ id: 'node-4', type: 'diamond', data: { cluster: 'node-type4' } },
],
edges: [
{ source: 'node-1', target: 'node-2', data: { cluster: 'edge-type1' } },
{ source: 'node-1', target: 'node-4', data: { cluster: 'edge-type2' } },
{ source: 'node-3', target: 'node-4' },
{ source: 'node-2', target: 'node-4', data: { cluster: 'edge-type3' } },
],
};
const graph = new Graph({
container: 'container',
data,
node: {
style: { size: 32 },
palette: {
field: 'cluster',
},
},
layout: {
type: 'force',
},
plugins: [
{
type: 'legend',
nodeField: 'cluster',
edgeField: 'cluster',
},
],
});
graph.render();
```
Plugin Skill
packages/site/docs/manual/plugin/Minimap.en.md anthropic-skill ~3,003 tokens---
title: Minimap
order: 12
---
## Overview
The main function of the Minimap is to provide users with an overall layout of the current graph content in the form of a thumbnail, allowing quick positioning of graph operation locations.
**⚠️ Note**, The Minimap plugin is currently incompatible with React Node rendering mechanism. When using Minimap functionality, it is recommended to implement node rendering through [built-in nodes](/en/manual/element/node/overview) or [custom nodes](/en/manual/element/node/custom-node).
## Usage Scenarios
The Minimap plugin is mainly applicable to the following scenarios:
- Providing a global view for quick area positioning
- Navigation and interaction assistance, allowing quick positioning to the target location through the minimap
## Basic Usage
Below is a simple example of initializing the Minimap plugin:
```js
const graph = new Graph({
plugins: [
{
key: 'minimap',
type: 'minimap',
size: [240, 160],
},
],
});
```
## Online Experience
<embed src="@/common/api/plugins/minimap.md"></embed>
## Configuration Options
| Property | Description | Type | Default Value | Required |
| -------------- | ----------------------------------------------------------------------------------------------------------------------- | ------------------------------------------------------------------------------------------------------------------------------------------------------------------------------------------------------ | -------------- | -------- |
| type | Plugin type | string | `minimap` | ✓ |
| key | Unique identifier for the plugin, used for subsequent updates | string | - | |
| className | Class name of the thumbnail canvas, not effective when an external container is passed | string | | |
| container | Container to which the thumbnail is mounted, if not provided, it is mounted to the container where the Graph is located | HTMLElement \| string | | |
| containerStyle | Style of the thumbnail container, not effective when an external container is passed | Partial\<CSSStyleDeclaration\> | | |
| delay | Delay update time (milliseconds) for performance optimization | number | 128 | |
| filter | Filter for filtering out elements that do not need to be displayed | (id: string, elementType: `node` \| `edge` \| `combo`) => boolean | | |
| maskStyle | Style of the mask | Partial\<CSSStyleDeclaration\> | | |
| padding | Padding | number \| number[] | 10 | |
| position | Position of the thumbnail relative to the canvas | [number, number] \| `left` \| `right` \| `top` \| `bottom` \| `left-top` \| `left-bottom` \| `right-top` \| `right-bottom` \| `top-left` \| `top-right` \| `bottom-left` \| `bottom-right` \| `center` | `right-bottom` | |
| renderer | Renderer, default is Canvas renderer | IRenderer | | |
| shape | Method for generating element thumbnails | `key` \| ((id: string, elementType: `node` \| `edge` \| `combo`, element: DisplayObject) => DisplayObject) | `key` | |
| size | Width and height | [number, number] | [240, 160] | |
### containerStyle
Set the style of the thumbnail container, not effective when an external container is passed. Inherits all CSS style properties (CSSStyleDeclaration), and you can use any valid CSS property to configure the style of the thumbnail container.
Below are some common configurations:
| Property | Description | Type | Default Value | Required |
| ------------ | -------------------------- | ------ | ---------------- | -------- |
| border | Container border style | string | `1px solid #ddd` | ✓ |
| background | Container background color | string | `#fff` | ✓ |
| borderRadius | Container border radius | string | - | |
| boxShadow | Container shadow effect | string | - | |
| padding | Container padding | string | - | |
| margin | Container margin | string | - | |
| opacity | Opacity | string | - | |
### maskStyle
Specify the style of the mask. Inherits all CSS style properties (CSSStyleDeclaration), and you can use any valid CSS property to configure the style of the thumbnail container.
Below are some common configurations:
| Property | Description | Type | Default Value | Required |
| ------------ | -------------------------- | ------ | -------------------- | -------- |
| border | Container border style | string | `1px solid #ddd` | ✓ |
| background | Container background color | string | `rgba(0, 0, 0, 0.1)` | ✓ |
| borderRadius | Container border radius | string | - | - |
| boxShadow | Container shadow effect | string | - | - |
| padding | Container padding | string | - | - |
| margin | Container margin | string | - | - |
| opacity | Opacity | string | - | - |
### position
Position of the thumbnail relative to the canvas, the thumbnail position configuration supports array form and preset value form.
- Array form [number, number] represents relative position, with a value range of 0~1. For example: [0, 0] represents the top left corner of the canvas, [1, 1] represents the bottom right corner of the canvas.
- Preset value form is used to set the fixed position of the thumbnail on the canvas, optional values are: `left` \| `right` \| `top` \| `bottom` \| `left-top` \| `left-bottom` \| `right-top` \| `right-bottom` \| `top-left` \| `top-right` \| `bottom-left` \| `bottom-right` \| `center`
```js
const graph = new Graph({
plugins:[
{
... // Other configurations
key: 'minimap',
type: 'minimap',
position: 'right-bottom' // Modify the position of the minimap here
}
]
})
```
The effect is as follows:
```js | ob { pin: false, inject: true }
import { Graph } from '@antv/g6';
const graph = new Graph({
container: 'container',
width: 600,
height: 300,
data: {
nodes: Array.from({ length: 50 }).map((_, i) => ({
id: `node-${i}`,
x: Math.random() * 500,
y: Math.random() * 300,
})),
edges: Array.from({ length: 100 }).map((_, i) => ({
id: `edge-${i}`,
source: `node-${Math.floor(Math.random() * 50)}`,
target: `node-${Math.floor(Math.random() * 50)}`,
})),
},
node: { style: { fill: '#7e3feb' } },
edge: { style: { stroke: '#8b9baf' } },
layout: { type: 'force' },
behaviors: ['drag-canvas'],
plugins: [{ type: 'minimap', key: 'minimap', size: [240, 160], position: 'right-bottom' }],
});
graph.render();
```
### size
Set the width and height of the minimap, default value is [240, 160]
```js
const graph = new Graph({
plugins:[
{
... // Other configurations
key: 'minimap',
type: 'minimap',
size: [200, 120] // Set the width and height of the minimap
}
]
})
```
The effect is as follows:
```js | ob { pin: false, inject: true }
import { Graph } from '@antv/g6';
const graph = new Graph({
container: 'container',
width: 600,
height: 300,
data: {
nodes: Array.from({ length: 50 }).map((_, i) => ({
id: `node-${i}`,
x: Math.random() * 500,
y: Math.random() * 300,
})),
edges: Array.from({ length: 100 }).map((_, i) => ({
id: `edge-${i}`,
source: `node-${Math.floor(Math.random() * 50)}`,
target: `node-${Math.floor(Math.random() * 50)}`,
})),
},
node: { style: { fill: '#7e3feb' } },
edge: { style: { stroke: '#8b9baf' } },
layout: { type: 'force' },
behaviors: ['drag-canvas'],
plugins: [{ type: 'minimap', key: 'minimap', size: [200, 120], position: 'right-bottom' }],
});
graph.render();
```
## Practical Cases
```js | ob { inject: true }
import { Graph } from '@antv/g6';
const graph = new Graph({
container: 'container',
data: { nodes: Array.from({ length: 20 }).map((_, i) => ({ id: `node${i}` })) },
behaviors: ['drag-canvas', 'zoom-canvas', 'drag-element'],
plugins: [
{
type: 'minimap',
size: [240, 160],
},
],
node: {
palette: 'spectral',
},
layout: {
type: 'circular',
},
autoFit: 'view',
});
graph.render();
```
Plugin Skill
packages/site/docs/manual/plugin/Minimap.zh.md anthropic-skill ~2,231 tokens---
title: 小地图 Minimap
order: 12
---
## 概述
Minimap(小地图)的主要作用是为用户提供以缩略图形式展示当前图内容的整体布局,可以快速定位图操作位置。
**⚠️ 需要注意**,Minimap 插件当前不兼容 React Node 渲染机制,在需要使用 Minimap 功能的场景中,建议通过 [内置节点](/manual/element/node/overview) 或者[自定义节点](/manual/element/node/custom-node) 实现节点渲染。
## 使用场景
Minimap(小地图)插件主要适用于以下场景:
- 提供全局视野,快速定位区域
- 导航与交互辅助,通过操作小地图可以快速定位到目标位置
## 基本用法
以下是一个简单的 Minimap 插件初始化示例:
```js
const graph = new Graph({
plugins: [
{
key: 'minimap',
type: 'minimap',
size: [240, 160],
},
],
});
```
## 在线体验
<embed src="@/common/api/plugins/minimap.md"></embed>
## 配置项
| 属性 | 描述 | 类型 | 默认值 | 必选 |
| -------------- | ------------------------------------------- | ------------------------------------------------------------------------------------------------------------------------------------------------------------------------------------------------------ | -------------- | ---- |
| type | 插件类型 | string | `minimap` | ✓ |
| key | 插件唯一标识符,用于后续更新 | string | - | |
| className | 缩略图画布类名,传入外置容器时不生效 | string | | |
| container | 缩略图挂载的容器,无则挂载到 Graph 所在容器 | HTMLElement \| string | | |
| containerStyle | 缩略图的容器样式,传入外置容器时不生效 | Partial\<CSSStyleDeclaration\> | | |
| delay | 延迟更新时间(毫秒),用于性能优化 | number | 128 | |
| filter | 过滤器,用于过滤不必显示的元素 | (id: string, elementType: `node` \| `edge` \| `combo`) => boolean | | |
| maskStyle | 遮罩的样式 | Partial\<CSSStyleDeclaration\> | | |
| padding | 内边距 | number \| number[] | 10 | |
| position | 缩略图相对于画布的位置 | [number, number] \| `left` \| `right` \| `top` \| `bottom` \| `left-top` \| `left-bottom` \| `right-top` \| `right-bottom` \| `top-left` \| `top-right` \| `bottom-left` \| `bottom-right` \| `center` | `right-bottom` | |
| renderer | 渲染器,默认使用 Canvas 渲染器 | IRenderer | | |
| shape | 元素缩略图形的生成方法 | `key` \| ((id: string, elementType: `node` \| `edge` \| `combo`, element: DisplayObject) => DisplayObject) | `key` | |
| size | 宽度和高度 | [number, number] | [240, 160] | |
### containerStyle
设置缩略图的容器样式,传入外置容器时不生效。继承了所有 CSS 样式属性(CSSStyleDeclaration),你可以使用任何合法的 CSS 属性来配置缩略图容器的样式。
以下是一些常用配置:
| 属性 | 描述 | 类型 | 默认值 | 必选 |
| ------------ | ------------ | ------ | ---------------- | ---- |
| border | 容器边框样式 | string | `1px solid #ddd` | ✓ |
| background | 容器背景颜色 | string | `#fff` | ✓ |
| borderRadius | 容器圆角大小 | string | - | |
| boxShadow | 容器阴影效果 | string | - | |
| padding | 容器内边距 | string | - | |
| margin | 容器外边距 | string | - | |
| opacity | 透明度 | string | - | |
### maskStyle
指定遮罩的样式。继承了所有 CSS 样式属性(CSSStyleDeclaration),你可以使用任何合法的 CSS 属性来配置缩略图容器的样式。
以下是一些常用配置:
| 属性 | 描述 | 类型 | 默认值 | 必选 |
| ------------ | ------------ | ------ | -------------------- | ---- |
| border | 容器边框样式 | string | `1px solid #ddd` | ✓ |
| background | 容器背景颜色 | string | `rgba(0, 0, 0, 0.1)` | ✓ |
| borderRadius | 容器圆角大小 | string | - | - |
| boxShadow | 容器阴影效果 | string | - | - |
| padding | 容器内边距 | string | - | - |
| margin | 容器外边距 | string | - | - |
| opacity | 透明度 | string | - | - |
### position
缩略图相对于画布的位置,缩略图位置配置支持数组形式和预设值形式。
- 数组形式 [number, number] 表示相对位置,取值范围为 0~1。举例:[0, 0] 代表画布左上角,[1, 1] 代表画布右下角。
- 预设值形式用于设定缩略图所在画布固定方位,可选值有:`left` \| `right` \| `top` \| `bottom` \| `left-top` \| `left-bottom` \| `right-top` \| `right-bottom` \| `top-left` \| `top-right` \| `bottom-left` \| `bottom-right` \| `center`
```js
const graph = new Graph({
plugins:[
{
... // 其他配置
key: 'minimap',
type: 'minimap',
position: 'right-bottom' // 这里进行修改minimap所在位置
}
]
})
```
效果如下:
```js | ob { pin: false, inject: true }
import { Graph } from '@antv/g6';
const graph = new Graph({
container: 'container',
width: 600,
height: 300,
data: {
nodes: Array.from({ length: 50 }).map((_, i) => ({
id: `node-${i}`,
x: Math.random() * 500,
y: Math.random() * 300,
})),
edges: Array.from({ length: 100 }).map((_, i) => ({
id: `edge-${i}`,
source: `node-${Math.floor(Math.random() * 50)}`,
target: `node-${Math.floor(Math.random() * 50)}`,
})),
},
node: { style: { fill: '#7e3feb' } },
edge: { style: { stroke: '#8b9baf' } },
layout: { type: 'force' },
behaviors: ['drag-canvas'],
plugins: [{ type: 'minimap', key: 'minimap', size: [240, 160], position: 'right-bottom' }],
});
graph.render();
```
### size
设置小地图的宽度和高度,默认值为 [240, 160]
```js
const graph = new Graph({
plugins:[
{
... // 其他配置
key: 'minimap',
type: 'minimap',
size: [200, 120] // minimap的宽度和高度的设置
}
]
})
```
效果如下:
```js | ob { pin: false, inject: true }
import { Graph } from '@antv/g6';
const graph = new Graph({
container: 'container',
width: 600,
height: 300,
data: {
nodes: Array.from({ length: 50 }).map((_, i) => ({
id: `node-${i}`,
x: Math.random() * 500,
y: Math.random() * 300,
})),
edges: Array.from({ length: 100 }).map((_, i) => ({
id: `edge-${i}`,
source: `node-${Math.floor(Math.random() * 50)}`,
target: `node-${Math.floor(Math.random() * 50)}`,
})),
},
node: { style: { fill: '#7e3feb' } },
edge: { style: { stroke: '#8b9baf' } },
layout: { type: 'force' },
behaviors: ['drag-canvas'],
plugins: [{ type: 'minimap', key: 'minimap', size: [200, 120], position: 'right-bottom' }],
});
graph.render();
```
## 实际案例
```js | ob { inject: true }
import { Graph } from '@antv/g6';
const graph = new Graph({
container: 'container',
data: { nodes: Array.from({ length: 20 }).map((_, i) => ({ id: `node${i}` })) },
behaviors: ['drag-canvas', 'zoom-canvas', 'drag-element'],
plugins: [
{
type: 'minimap',
size: [240, 160],
},
],
node: {
palette: 'spectral',
},
layout: {
type: 'circular',
},
autoFit: 'view',
});
graph.render();
```
Plugin Skill
packages/site/docs/manual/plugin/overview.en.md anthropic-skill ~2,643 tokens---
title: Plugin Overview
order: 0
---
## What is a Plugin
<image width="200px" src="https://mdn.alipayobjects.com/huamei_qa8qxu/afts/img/A*sa3jRqp83K4AAAAAAAAAAAAADmJ7AQ/original" />
A Plugin is the most flexible extension mechanism in G6, allowing users to extend G6's functionality, such as adding graphical components to the canvas or implementing undo/redo features.
Most customization needs can be achieved through plugins. G6 comes with some built-in plugins, such as: [Tooltip](/en/manual/plugin/tooltip), [Grid](/en/manual/plugin/grid-line), [History](/en/manual/plugin/history).
## Built-in Plugins
G6 provides a rich set of built-in plugins covering various common functional scenarios:
| Category | Plugin Name | Registration Type | Description |
| ---------------------------- | --------------------------------------------------------------------------------------------------- | ------------------ | ---------------------------------------------------------------------- |
| **Visual Style Enhancement** | | | |
| | [Grid Line](/en/manual/plugin/grid-line) | `grid-line` | Displays grid reference lines on the canvas |
| | [Background](/en/manual/plugin/background) | `background` | Adds background images or colors to the canvas |
| | [Watermark](/en/manual/plugin/watermark) | `watermark` | Adds a watermark to the canvas to protect copyright |
| | [Hull](/en/manual/plugin/hull) | `hull` | Creates an outline for a specified set of nodes |
| | [Bubble Sets](/en/manual/plugin/bubble-sets) | `bubble-sets` | Creates smooth bubble-like element outlines |
| | [Snapline](/en/manual/plugin/snapline) | `snapline` | Displays alignment reference lines when dragging elements |
| **Navigation and Overview** | | | |
| | [Minimap](/en/manual/plugin/minimap) | `minimap` | Displays a thumbnail preview of the graph, supporting navigation |
| | [Fullscreen](/en/manual/plugin/fullscreen) | `fullscreen` | Supports full-screen display and exit for charts |
| | [Timebar](/en/manual/plugin/timebar) | `timebar` | Provides filtering and playback control for temporal data |
| **Interactive Controls** | | | |
| | [Toolbar](/en/manual/plugin/toolbar) | `toolbar` | Provides a collection of common operation buttons |
| | [Context Menu](/en/manual/plugin/contextmenu) | `contextmenu` | Displays a menu of selectable operations on right-click |
| | [Tooltip](/en/manual/plugin/tooltip) | `tooltip` | Displays detailed information about elements on hover |
| | [Legend](/en/manual/plugin/legend) | `legend` | Displays categories and corresponding style descriptions of chart data |
| **Data Exploration** | | | |
| | [Fisheye](/en/manual/plugin/fisheye) | `fisheye` | Provides a focus + context exploration experience |
| | [Edge Filter Lens](/en/manual/plugin/edge-filter-lens) | `edge-filter-lens` | Filters and displays edges within a specified area |
| | [Edge Bundling](/en/manual/plugin/edge-bundling) | `edge-bundling` | Bundles edges with similar paths together to reduce visual clutter |
| **Advanced Features** | | | |
| | [History](/en/manual/plugin/history) | `history` | Supports undo/redo operations |
| | [Camera Setting](/enhttps://github.com/antvis/G6/blob/v5/packages/g6/src/plugins/camera-setting.ts) | `camera-setting` | Configures camera parameters in a 3D scene |
For detailed configuration of each plugin, refer to the [Built-in Plugin Documentation](/en/manual/plugin/grid-line).
## Configuration Methods
### Basic Configuration
Specify the required plugins through the `plugins` array when initializing the graph instance:
```javascript {}5
import { Graph } from '@antv/g6';
const graph = new Graph({
// Other configurations...
plugins: ['grid', 'minimap', 'tooltip'],
});
```
### Configuring Plugin Parameters
For plugins that require custom parameters, you can configure properties using the `object` form:
```javascript {5-9}
const graph = new Graph({
// Other configurations...
plugins: [
'grid',
{
type: 'tooltip',
key: 'my-tooltip', // Specify a key for the plugin for future updates
getContent: (e) => `<div>Node: ${e.target.id}</div>`,
},
],
});
```
### Dynamically Updating Plugins
G6 supports dynamic management of plugins during the runtime of the graph instance to meet complex interaction needs:
Use the [getPlugins](/en/api/plugin#graphgetplugins) method to get the current list of plugins:
```javascript
// Get the list of plugins
const plugins = graph.getPlugins();
// console.log(plugins) 👉 ['minimap', 'grid']
```
You can adjust plugins using the [setPlugins](/en/api/plugin#graphsetpluginsplugins) method:
```javascript
// Add a new plugin
graph.setPlugins((plugins) => [...plugins, 'minimap']);
// Remove a plugin
graph.setPlugins((plugins) => plugins.filter((p) => p !== 'grid'));
```
You can update the configuration of a plugin using the [updatePlugin](/en/api/plugin#graphupdatepluginplugin) method:
```javascript {6,14}
const graph = new Graph({
// Other configurations...
plugins: [
{
type: 'tooltip',
key: 'my-tooltip',
getContent: (e) => `<div>Node: ${e.target.id}</div>`,
},
],
});
// Update a single plugin
graph.updatePlugin({
key: 'my-tooltip',
getContent: (e) => `<div>Updated content: ${e.target.id}</div>`,
});
```
:::warning{title=Note}
When using the `updatePlugin` method, you need to specify a unique `key` for the plugin during initialization.
:::
### Uninstalling Plugins
Use the [setPlugins](/en/api/plugin#graphsetpluginsplugins) method to uninstall plugins by setting the plugin configuration list to empty:
```javascript
// Uninstall all plugins
graph.setPlugins([]);
```
### Calling Plugin Methods
Some plugins provide API methods for users to call, such as the `history` plugin providing `undo` and `redo` methods, allowing users to implement undo and redo operations by calling these methods.
To call these methods, you need to first get the plugin instance, which can be obtained through the [getPluginInstance](/en/api/plugin#graphgetplugininstancekey) method:
```javascript
// Configure the plugin
const graph = new Graph({
plugins: [{ type: 'history', key: 'my-history' }],
});
// Get the plugin instance
const history = graph.getPluginInstance('my-history');
// Call plugin methods
history.undo();
history.redo();
```
:::warning{title=Note}
The `graph.getPluginInstance` method takes the plugin key value as a parameter, so if you need to get the plugin instance, you need to configure the corresponding plugin in the form of an `object` and pass in the `key` value.
:::
For more plugin-related APIs, please refer to the [Plugin API Documentation](/en/api/plugin).
## Custom Plugins
When built-in plugins cannot meet your needs, you can:
- Inherit and extend existing plugins
- Create brand new custom plugins
Custom plugins need to be registered before use. For detailed tutorials, please refer to the [Custom Plugin](/en/manual/plugin/custom-plugin) documentation.
```javascript
import { register, ExtensionCategory } from '@antv/g6';
import { MyCustomPlugin } from './my-custom-plugin';
// Register custom plugin
register(ExtensionCategory.PLUGIN, 'my-custom-plugin', MyCustomPlugin);
// Use custom plugin
const graph = new Graph({
plugins: ['my-custom-plugin'],
});
```
By reasonably combining and configuring plugins, you can build graph visualization applications with rich features and excellent interactive experiences.
Plugin Skill
packages/site/docs/manual/plugin/overview.zh.md anthropic-skill ~1,769 tokens---
title: 插件总览
order: 0
---
## 什么是插件
<image width="200px" src="https://mdn.alipayobjects.com/huamei_qa8qxu/afts/img/A*sa3jRqp83K4AAAAAAAAAAAAADmJ7AQ/original" />
插件(Plugin)是 G6 中最灵活的扩展机制,用户可以通过插件来扩展 G6 的功能,例如在画布中额外挂载图形组件、实现撤销重做等功能。
绝大多数的定制需求都可以通过插件来实现,G6 内置了一些常用的插件,例如:[Tooltip](/manual/plugin/tooltip)、[Grid](/manual/plugin/grid-line)、[History](/manual/plugin/history)。
## 内置插件
G6 提供了丰富的内置插件,涵盖多种常见功能场景:
| 分类 | 插件名称 | 注册类型 | 功能描述 |
| ---------------- | ------------------------------------------------------------------------------------------ | ------------------ | -------------------------------------- |
| **视觉样式增强** | | | |
| | [网格线](/manual/plugin/grid-line) | `grid-line` | 在画布上显示网格参考线 |
| | [背景](/manual/plugin/background) | `background` | 为画布添加背景图片或颜色 |
| | [水印](/manual/plugin/watermark) | `watermark` | 为画布添加水印,保护版权 |
| | [轮廓包围](/manual/plugin/hull) | `hull` | 为指定节点集合创建轮廓 |
| | [气泡集](/manual/plugin/bubble-sets) | `bubble-sets` | 创建平滑气泡状的元素集合轮廓 |
| | [对齐线](/manual/plugin/snapline) | `snapline` | 拖动元素时显示对齐参考线 |
| **导航与概览** | | | |
| | [缩略图](/manual/plugin/minimap) | `minimap` | 显示图的缩略预览,支持导航 |
| | [全屏](/manual/plugin/fullscreen) | `fullscreen` | 支持图表全屏显示和退出 |
| | [时间轴](/manual/plugin/timebar) | `timebar` | 提供时序数据的筛选和播放控制 |
| **交互控件** | | | |
| | [工具栏](/manual/plugin/toolbar) | `toolbar` | 提供常用操作按钮集合 |
| | [上下文菜单](/manual/plugin/contextmenu) | `contextmenu` | 右键点击时显示可选操作菜单 |
| | [提示框](/manual/plugin/tooltip) | `tooltip` | 悬停时显示元素详细信息 |
| | [图例](/manual/plugin/legend) | `legend` | 显示图表数据的类别和对应样式说明 |
| **数据探索** | | | |
| | [鱼眼放大镜](/manual/plugin/fisheye) | `fisheye` | 提供焦点+上下文的探索体验 |
| | [边过滤镜](/manual/plugin/edge-filter-lens) | `edge-filter-lens` | 在指定区域内筛选显示边 |
| | [边绑定](/manual/plugin/edge-bundling) | `edge-bundling` | 将相似路径的边捆绑在一起,减少视觉混乱 |
| **高级功能** | | | |
| | [历史记录](/manual/plugin/history) | `history` | 支持撤销/重做操作 |
| | [相机设置](https://github.com/antvis/G6/blob/v5/packages/g6/src/plugins/camera-setting.ts) | `camera-setting` | 配置3D场景下的相机参数 |
各插件的详细配置可参考 [内置插件文档](/manual/plugin/grid-line)。
## 配置方式
### 基本配置
在图实例初始化时,通过 `plugins` 数组指定需要的插件:
```javascript {}5
import { Graph } from '@antv/g6';
const graph = new Graph({
// 其他配置...
plugins: ['grid', 'minimap', 'tooltip'],
});
```
### 配置插件参数
对于需要自定义参数的插件,可以使用 `object` 形式配置属性:
```javascript {5-9}
const graph = new Graph({
// 其他配置...
plugins: [
'grid',
{
type: 'tooltip',
key: 'my-tooltip', // 为插件指定key,便于后续更新
getContent: (e) => `<div>节点:${e.target.id}</div>`,
},
],
});
```
### 动态更新插件
G6 支持在图实例运行期间动态管理插件,满足复杂交互需求:
通过 [getPlugins](/api/plugin#graphgetplugins) 方法获取当前插件列表:
```javascript
// 获取插件列表
const plugins = graph.getPlugins();
// console.log(plugins) 👉 ['minimap', 'grid']
```
可以通过 [setPlugins](/api/plugin#graphsetpluginsplugins) 方法调整插件:
```javascript
// 添加新插件
graph.setPlugins((plugins) => [...plugins, 'minimap']);
// 移除插件
graph.setPlugins((plugins) => plugins.filter((p) => p !== 'grid'));
```
可以通过 [updatePlugin](/api/plugin#graphupdatepluginplugin) 方法更新插件的配置:
```javascript {6,14}
const graph = new Graph({
// 其他配置...
plugins: [
{
type: 'tooltip',
key: 'my-tooltip',
getContent: (e) => `<div>节点:${e.target.id}</div>`,
},
],
});
// 更新单个插件
graph.updatePlugin({
key: 'my-tooltip',
getContent: (e) => `<div>更新的内容:${e.target.id}</div>`,
});
```
:::warning{title=注意}
使用 `updatePlugin` 方法时,需要在初始化时为插件指定唯一的 `key`。
:::
### 卸载插件
使用 [setPlugins](/api/plugin#graphsetpluginsplugins) 方法同样可以卸载插件,将插件配置列表置为空即可:
```javascript
// 卸载所有插件
graph.setPlugins([]);
```
### 调用插件方法
一些插件提供了可供用户调用的 API 方法,例如 `history` 插件提供了 `undo` 和 `redo` 方法,用户可以通过调用这些方法来实现撤销和重做操作。
要调用这些方法,需要先获取到插件实例,可通过 [getPluginInstance](/api/plugin#graphgetplugininstancekey) 方法获取:
```javascript
// 配置插件
const graph = new Graph({
plugins: [{ type: 'history', key: 'my-history' }],
});
// 获取插件实例
const history = graph.getPluginInstance('my-history');
// 调用插件方法
history.undo();
history.redo();
```
:::warning{title=注意}
`graph.getPluginInstance` 方法接收插件 key 值作为参数,因此如果需要获取插件实例,需要将对应插件配置为 `object` 的形式,并传入 `key` 值。
:::
更多与插件相关的 API 请参考 [插件 API 文档](/api/plugin)。
## 自定义插件
当内置插件无法满足需求时,你可以:
- 继承和扩展现有插件
- 创建全新的自定义插件
自定义插件需要先注册后使用。详细教程请参考 [自定义插件](/manual/plugin/custom-plugin) 文档。
```javascript
import { register, ExtensionCategory } from '@antv/g6';
import { MyCustomPlugin } from './my-custom-plugin';
// 注册自定义插件
register(ExtensionCategory.PLUGIN, 'my-custom-plugin', MyCustomPlugin);
// 使用自定义插件
const graph = new Graph({
plugins: ['my-custom-plugin'],
});
```
通过合理组合和配置插件,你可以构建出功能丰富、交互体验出色的图可视化应用。
Plugin Skill
packages/site/docs/manual/plugin/Snapline.en.md anthropic-skill ~2,139 tokens---
title: Snapline
order: 13
---
## Overview
The Snapline plugin provides intelligent alignment guidelines for the canvas, automatically displaying guide lines when moving nodes and supporting automatic snapping. It helps users achieve precise alignment and is an important tool for improving efficiency and accuracy in graphic editing.
## Use Cases
The Snapline plugin is mainly suitable for the following scenarios:
- When manually adjusting node positions and precise alignment with other nodes is needed
- When dragging multiple nodes while maintaining their alignment relationships
- When creating standardized graphic layouts to ensure consistency in node spacing and positioning
- When improving node layout efficiency through automatic snapping functionality
## Basic Usage
```js
const graph = new Graph({
plugins: [
{
type: 'snapline',
key: 'my-snapline', // Specify unique identifier
tolerance: 5, // Alignment snap threshold
offset: 20, // Guide line extension distance
autoSnap: true, // Enable automatic snapping
},
],
});
```
## Live Demo
<embed src="@/common/api/plugins/snapline.md"></embed>
## Options
| Property | Description | Type | Default | Required |
| ------------------- | ------------------------------------------------------------------------------------------------------------------------------------------------------------------------------------------------------ | ----------------------------------------- | ----------------------- | -------- |
| type | Plugin type | string | `'snapline'` | ✓ |
| key | Plugin unique identifier | string | - | |
| tolerance | The alignment accuracy, that is, when the distance between the moved node and the target position is less than tolerance, the alignment line is displayed | number | 5 | |
| offset | The extension distance of the snapline | number | 20 | |
| autoSnap | Whether to enable automatic snapping | boolean | true | |
| shape | Specifies which shape on the element to use as the reference shape:<br/>- `'key'`: uses the key shape of the element as the reference shape<br/>- `Function`: receives the element and returns a shape | string \| ((node: Node) => DisplayObject) | `'key'` | |
| verticalLineStyle | Vertical snapline style | BaseStyleProps | `{ stroke: '#1783FF' }` | |
| horizontalLineStyle | Horizontal snapline style | BaseStyleProps | `{ stroke: '#1783FF' }` | |
| filter | Filter nodes that do not need to participate in alignment | (node: Node) => boolean | `() => true` | |
### shape
The `shape` property specifies the reference shape for elements and supports the following configurations:
```js
// Use the key shape as reference
{
type: 'snapline',
shape: 'key'
}
// Use custom function to return reference shape
{
type: 'snapline',
shape: (node) => {
return node.getShape('custom-shape');
}
}
```
### Snapline Style Configuration
| Property | Description | Type | Default |
| -------------- | ----------------------- | ---------------------------------------- | ----------- |
| stroke | Line color | string \| Pattern \| null | `'#1783FF'` |
| opacity | Overall opacity | number \| string | 1 |
| strokeOpacity | Stroke opacity | number \| string | 1 |
| lineWidth | Line width | number \| string | 1 |
| lineCap | Line end style | `'butt'` \| `'round'` \| `'square'` | `'butt'` |
| lineJoin | Line join style | `'miter'` \| `'round'` \| `'bevel'` | `'miter'` |
| lineDash | Dash line configuration | number \| string \| (string \| number)[] | - |
| lineDashOffset | Dash line offset | number | 0 |
| shadowBlur | Shadow blur | number | 0 |
| shadowColor | Shadow color | string | - |
| shadowOffsetX | Shadow X offset | number | 0 |
| shadowOffsetY | Shadow Y offset | number | 0 |
| cursor | Mouse cursor style | string | `'default'` |
| zIndex | Rendering level | number | 0 |
Example configuration:
```js
{
type: 'snapline',
horizontalLineStyle: {
stroke: '#F08F56',
strokeOpacity: 0.8,
lineWidth: 2,
lineDash: [4, 4],
lineDashOffset: 0,
opacity: 1,
cursor: 'move',
},
verticalLineStyle: {
stroke: '#17C76F',
strokeOpacity: 0.8,
lineWidth: 2,
lineDash: [4, 4],
lineDashOffset: 0,
opacity: 1,
cursor: 'move',
},
}
```
## Code Examples
### Basic Snapline
The simplest usage:
```js
const graph = new Graph({
plugins: ['snapline'],
});
```
### Custom Configuration
You can customize the snapline behavior according to your needs:
```js
const graph = new Graph({
plugins: [
{
type: 'snapline',
tolerance: 8, // Larger snap range
offset: 30, // Longer extension lines
horizontalLineStyle: {
stroke: '#1890ff',
lineWidth: 2,
},
filter: (node) => node.id !== 'node-0', // Filter nodes by id, exclude from alignment
},
],
});
```
## Live Example
```js | ob { inject: true }
import { Graph } from '@antv/g6';
const data = {
nodes: [{ id: 'node-0' }, { id: 'node-1' }, { id: 'node-2' }, { id: 'node-3' }, { id: 'node-4' }, { id: 'node-5' }],
edges: [
{ source: 'node-0', target: 'node-1' },
{ source: 'node-0', target: 'node-2' },
{ source: 'node-0', target: 'node-3' },
{ source: 'node-0', target: 'node-4' },
{ source: 'node-1', target: 'node-0' },
{ source: 'node-2', target: 'node-0' },
{ source: 'node-3', target: 'node-0' },
{ source: 'node-4', target: 'node-0' },
{ source: 'node-5', target: 'node-0' },
],
};
const graph = new Graph({
container: 'container',
data,
layout: { type: 'grid' },
behaviors: ['drag-canvas', 'drag-element'],
plugins: [
{
type: 'snapline',
key: 'snapline',
verticalLineStyle: { stroke: '#F08F56', lineWidth: 2 },
horizontalLineStyle: { stroke: '#17C76F', lineWidth: 2 },
autoSnap: false,
},
],
});
graph.render();
```
Plugin Skill
packages/site/docs/manual/plugin/Snapline.zh.md anthropic-skill ~1,820 tokens---
title: 对齐线 Snapline
order: 13
---
## 概述
对齐线插件为画布提供智能对齐参考线,在移动节点时自动显示辅助线并支持自动吸附,帮助用户实现精确对齐,是图形编辑中提升效率和精确度的重要工具。
## 使用场景
对齐线插件主要适用于以下场景:
- 手动调整节点位置时,需要与其他节点精确对齐
- 拖拽移动多个节点时,保持它们之间的对齐关系
- 制作规范的图形布局时,确保节点间距和位置的一致性
- 通过自动吸附功能提高节点排版效率
## 基本用法
以下是一个简单的 Snapline 插件初始化示例:
```js
const graph = new Graph({
plugins: [
{
type: 'snapline',
key: 'my-snapline', // 指定唯一标识符
tolerance: 5, // 对齐吸附阈值
offset: 20, // 对齐线延伸距离
autoSnap: true, // 启用自动吸附
},
],
});
```
## 在线体验
<embed src="@/common/api/plugins/snapline.md"></embed>
## 配置项
| 属性 | 描述 | 类型 | 默认值 | 必选 |
| ------------------- | ----------------------------------------------------------------------------------------------------------------------- | ------------------------------------------------------------------------------------------------------------------------------- | ----------------------- | ---- |
| type | 插件类型 | string | `'snapline'` | ✓ |
| key | 插件唯一标识符 | string | - | |
| tolerance | 对齐精度,即触发对齐的距离阈值 | number | 5 | |
| offset | 对齐线头尾的延伸距离 | number | 20 | |
| autoSnap | 是否启用自动吸附 | boolean | true | |
| shape | 指定元素的参照图形:<br/>- `'key'`: 使用元素的主图形作为参照图形<br/>- `Function`: 传入函数时接收元素对象,返回一个图形 | string \| ((node: Node) => DisplayObject) | `'key'` | |
| verticalLineStyle | 垂直对齐线样式 | 支持[BaseStyleProps](/manual/element/shape/properties#baseshapestyle) 下的部分配置,详见[「对齐线样式配置项」](#对齐线样式配置) | `{ stroke: '#1783FF' }` | |
| horizontalLineStyle | 水平对齐线样式 | 支持[BaseStyleProps](/manual/element/shape/properties#baseshapestyle) 下的部分配置,详见[「对齐线样式配置项」](#对齐线样式配置) | `{ stroke: '#1783FF' }` | |
| filter | 过滤不需要参与对齐的节点 | (node: Node) => boolean | `() => true` | |
### shape
`shape` 属性用于指定元素的参照图形,支持以下配置方式:
```js
// 使用主图形作为参照
{
type: 'snapline',
shape: 'key'
}
// 使用自定义函数返回参照图形
{
type: 'snapline',
shape: (node) => {
return node.getShape('custom-shape');
}
}
```
### 对齐线样式配置
| 配置项 | 说明 | 类型 | 默认值 |
| -------------- | --------------- | ---------------------------------------- | ----------- |
| stroke | 线条颜色 | string \| Pattern \| null | `'#1783FF'` |
| opacity | 整体透明度 | number \| string | 1 |
| strokeOpacity | 描边透明度 | number \| string | 1 |
| lineWidth | 线宽度 | number \| string | 1 |
| lineCap | 线段端点样式 | `'butt'` \| `'round'` \| `'square'` | `'butt'` |
| lineJoin | 线段连接处样式 | `'miter'` \| `'round'` \| `'bevel'` | `'miter'` |
| lineDash | 虚线配置 | number \| string \| (string \| number)[] | - |
| lineDashOffset | 虚线偏移量 | number | 0 |
| shadowBlur | 阴影模糊程度 | number | 0 |
| shadowColor | 阴影颜色 | string | - |
| shadowOffsetX | 阴影 X 方向偏移 | number | 0 |
| shadowOffsetY | 阴影 Y 方向偏移 | number | 0 |
| cursor | 鼠标样式 | string | `'default'` |
| zIndex | 渲染层级 | number | 0 |
示例配置
```js
{
type: 'snapline',
horizontalLineStyle: {
stroke: '#F08F56',
strokeOpacity: 0.8,
lineWidth: 2,
lineDash: [4, 4],
lineDashOffset: 0,
opacity: 1,
cursor: 'move',
},
verticalLineStyle: {
stroke: '#17C76F',
strokeOpacity: 0.8,
lineWidth: 2,
lineDash: [4, 4],
lineDashOffset: 0,
opacity: 1,
cursor: 'move',
},
}
```
## 代码示例
### 基础对齐线
最简单的使用方式:
```js
const graph = new Graph({
plugins: ['snapline'],
});
```
### 自定义配置
可以根据需要自定义对齐线的行为:
```js
const graph = new Graph({
plugins: [
{
type: 'snapline',
tolerance: 8, // 更大的吸附范围
offset: 30, // 更长的延伸线
horizontalLineStyle: {
stroke: '#1890ff',
lineWidth: 2,
},
filter: (node) => node.id !== 'node-0', // 根据id过滤节点,不参与对齐
},
],
});
```
## 实际案例
```js | ob { inject: true }
import { Graph } from '@antv/g6';
const data = {
nodes: [{ id: 'node-0' }, { id: 'node-1' }, { id: 'node-2' }, { id: 'node-3' }, { id: 'node-4' }, { id: 'node-5' }],
edges: [
{ source: 'node-0', target: 'node-1' },
{ source: 'node-0', target: 'node-2' },
{ source: 'node-0', target: 'node-3' },
{ source: 'node-0', target: 'node-4' },
{ source: 'node-1', target: 'node-0' },
{ source: 'node-2', target: 'node-0' },
{ source: 'node-3', target: 'node-0' },
{ source: 'node-4', target: 'node-0' },
{ source: 'node-5', target: 'node-0' },
],
};
const graph = new Graph({
container: 'container',
data,
layout: { type: 'grid' },
behaviors: ['drag-canvas', 'drag-element'],
plugins: [
{
type: 'snapline',
key: 'snapline',
verticalLineStyle: { stroke: '#F08F56', lineWidth: 2 },
horizontalLineStyle: { stroke: '#17C76F', lineWidth: 2 },
autoSnap: false,
},
],
});
graph.render();
```
Plugin Skill
packages/site/docs/manual/plugin/Timebar.en.md anthropic-skill ~3,902 tokens---
title: Timebar
order: 14
---
## Overview
The Timebar plugin is an important tool for exploring time-series data. It can display the time distribution of data in the form of a timeline or trend chart, and supports interactions such as time interval filtering and dynamic playback, helping users better understand the changes in data over time.
## Use Cases
- Need to display and analyze the time distribution of time-series data
- Need to filter and explore graph data through the time dimension
- Need to dynamically display the process of data changing over time
## Basic Usage
Below is a simple example of initializing the Timebar plugin:
```js
const graph = new Graph({
plugins: [
{
type: 'timebar',
data: timeData, // Time data
width: 450, // Timebar width
height: 60, // Timebar height
position: 'bottom', // Position
loop: false, // Whether to loop playback
},
],
});
```
## Online Experience
<embed src="@/common/api/plugins/timebar.md"></embed>
## Configuration Options
| Property | Description | Type | Default Value | Required |
| -------------- | ---------------------------------------------------------------------------------------------------------------------------------------------------------------------------------------- | -------------------------------------------------- | ------------- | -------- |
| type | Plugin type | string | `timebar` | ✓ |
| key | Unique identifier for the plugin, can be used to get the plugin instance or update plugin options | string | - | |
| className | Additional class name for the toolbar DOM | string | `g6-timebar` | |
| x | X position (position will be invalid if set) | number | - | |
| y | Y position (position will be invalid if set) | number | - | |
| width | Timebar width | number | 450 | |
| height | Timebar height | number | 60 | |
| position | Timebar position | `bottom` \| `top` | `bottom` | |
| padding | Padding | number \| number[] | 10 | |
| data | Time data | number[] \| { time: number; value: number }[] | - | ✓ |
| timebarType | Timebar display type | `time` \| `chart` | `time` | |
| elementTypes | Filter element types | (`node` \| `edge` \| `combo`)[] | [`node`] | |
| mode | Control element filtering method, supports the following two configurations: <br/>- `modify`: filter by modifying graph data <br/>- `visibility`: filter by modifying element visibility | `modify` \| `visibility` | `modify` | |
| values | Current time value | number \| [number, number] \| Date \| [Date, Date] | - | |
| loop | Whether to loop playback | boolean | false | |
| getTime | Method to get element time | (datum: ElementDatum) => number | - | |
| labelFormatter | Custom time formatting in chart mode | (time: number \| Date) => string | - | |
| onChange | Callback when the time interval changes | (values: number \| [number, number]) => void | - | |
| onReset | Callback when reset | () => void | - | |
| onSpeedChange | Callback when playback speed changes | (speed: number) => void | - | |
| onPlay | Callback when playback starts | () => void | - | |
| onPause | Callback when paused | () => void | - | |
| onBackward | Callback when moving backward | () => void | - | |
| onForward | Callback when moving forward | () => void | - | |
### timebarType
The `timebarType` property is used to control the display type of the timebar, supporting the following two configurations:
- `time`: Displayed as a timeline, refer to [Time Mode Example](/examples/plugin/timebar/#timer)
- `chart`: Displayed as a trend chart, at this time the `data` configuration item under `timebar` needs to pass an additional `value` field as chart data, refer to [Chart Mode Example](/examples/plugin/timebar/#chart)
## Code Examples
### Basic Usage
The simplest configuration method:
```js
const graph = new Graph({
layout: { type: 'grid', cols: 5 },
plugins: [
{
type: 'timebar',
data: [
{
time: new Date('2023-08-01').getTime(),
value: 5,
},
{
time: new Date('2023-08-02').getTime(),
value: 10,
},
{
time: new Date('2023-08-03').getTime(),
value: 15,
},
],
},
],
data: {
nodes: [
{
id: 'node1',
label: 'Node 1',
// By default, elementTypes=['node'], so nodes need to set data.timestamp to display sequentially according to the timeline
data: {
timestamp: new Date('2023-08-01').getTime(),
},
},
{
id: 'node2',
label: 'Node 2',
data: {
timestamp: new Date('2023-08-02').getTime(),
},
},
{
id: 'node3',
label: 'Node 3',
data: {
timestamp: new Date('2023-08-03').getTime(),
},
},
],
edges: [
{
id: 'edge1',
source: 'node1',
target: 'node2',
// Scenario 1: By default, elementTypes = ['node']
// - Edges do not need to set data.timestamp, the display/hide of edges depends entirely on whether the two connected nodes are visible
// Scenario 2: If elementTypes includes 'edge', for example, elementTypes = ['node', 'edge']
// - At this time, edges must set data.timestamp, and the display of edges is controlled by it
// data: {
// timestamp: new Date('2023-08-01').getTime()
// }
},
{
id: 'edge2',
source: 'node2',
target: 'node3',
},
{
id: 'edge3',
source: 'node3',
target: 'node1',
},
],
},
});
```
The effect is as follows:
```js | ob { pin: false, inject: true }
import { Graph } from '@antv/g6';
const graph = new Graph({
container: 'container',
width: 600,
height: 400,
width: 600,
height: 400,
layout: { type: 'grid', cols: 5 },
plugins: [
{
type: 'timebar',
data: [
{
time: new Date('2023-08-01').getTime(),
value: 5,
},
{
time: new Date('2023-08-02').getTime(),
value: 10,
},
{
time: new Date('2023-08-03').getTime(),
value: 15,
},
],
},
],
data: {
nodes: [
{
id: 'node1',
label: 'Node 1',
data: {
timestamp: new Date('2023-08-01').getTime(),
},
},
{
id: 'node2',
label: 'Node 2',
data: {
timestamp: new Date('2023-08-02').getTime(),
},
},
{
id: 'node3',
label: 'Node 3',
data: {
timestamp: new Date('2023-08-03').getTime(),
},
},
],
edges: [
{
id: 'edge1',
source: 'node1',
target: 'node2',
},
{
id: 'edge2',
source: 'node2',
target: 'node3',
},
{
id: 'edge3',
source: 'node3',
target: 'node1',
},
],
},
});
graph.render();
```
### Custom Styles
`width`, `height`, `padding`, `className` can customize the display effect of the timebar, but note that `className` only acts on the outer DOM container and cannot affect the internal Canvas rendering content of the timebar (timeline, chart, play button, etc.).
```js
const graph = new Graph({
plugins: [
{
type: 'timebar',
className: 'custom-timebar', // Note: Since the content is Canvas rendered, CSS styles cannot affect the internal content of the timebar
width: 400, // Set timebar width
height: 80, // Set timebar height
padding: [20, 20, 10, 20], // Set padding [top, right, bottom, left]
position: 'bottom', // Keep position at the bottom
data: timeData,
// labelFormatter: (time) => {
// return new Date(time).toLocaleDateString();
// }
},
],
});
```
CSS can only set the style of the timebar container:
```css
.custom-timebar {
background-color: #f0f0f0;
border: 1px solid #ccc;
border-radius: 5px;
box-shadow: 0 2px 4px rgba(0, 0, 0, 0.1);
}
```
The effect is as follows:
```js | ob { pin: false }
createGraph(
{
data: () => {
return {
nodes: [
{
id: 'node1',
style: { x: 100, y: 100, label: 'Node 1' },
data: {
timestamp: new Date('2023-08-01').getTime(),
},
},
{
id: 'node2',
style: { x: 200, y: 100, label: 'Node 2' },
data: {
timestamp: new Date('2023-08-01').getTime() + 3600 * 24 * 1000,
},
},
{
id: 'node3',
style: { x: 150, y: 200, label: 'Node 3' },
data: {
timestamp: new Date('2023-08-01').getTime() + 3600 * 24 * 1000 * 2,
},
},
],
edges: [
{ id: 'edge1', source: 'node1', target: 'node2' },
{ id: 'edge2', source: 'node2', target: 'node3' },
{ id: 'edge3', source: 'node3', target: 'node1' },
],
};
},
node: {
style: {
size: 20,
label: true,
},
},
edge: {
style: {
stroke: '#91d5ff',
lineWidth: 1,
},
},
plugins: [
{
type: 'timebar',
className: 'custom-timebar',
width: 400,
height: 80,
padding: [20, 20, 10, 20],
position: 'bottom',
data: [
{
time: new Date('2023-08-01').getTime(),
value: 5,
},
{
time: new Date('2023-08-01').getTime() + 3600 * 24 * 1000,
value: 10,
},
{
time: new Date('2023-08-01').getTime() + 3600 * 24 * 1000 * 2,
value: 15,
},
],
labelFormatter: (time) => {
return new Date(time).toLocaleDateString();
},
},
],
},
{ width: 600, height: 400 },
(gui, graph) => {
gui?.hide();
const style = document.createElement('style');
style.innerHTML = `
.custom-timebar {
background-color: #f0f0f0;
border: 1px solid #ccc;
border-radius: 5px;
box-shadow: 0 2px 4px rgba(0, 0, 0, 0.1);
}
`;
document.head.appendChild(style);
},
);
```
## Real Cases
- [Time Mode](/examples/plugin/timebar/#timer)
- [Chart Mode](/examples/plugin/timebar/#chart)
Plugin Skill
packages/site/docs/manual/plugin/Timebar.zh.md anthropic-skill ~3,090 tokens---
title: 时间条 Timebar
order: 14
---
## 概述
时间条插件是一个用于时序数据探索的重要工具,它能够通过时间轴或趋势图的形式展示数据的时间分布,并支持时间区间筛选、动态播放等交互方式,帮助用户更好地理解数据随时间的变化。
## 使用场景
- 需要展示和分析时序数据的时间分布
- 需要通过时间维度筛选和探索图数据
- 需要动态展示数据随时间变化的过程
## 基本用法
以下是一个简单的 Timebar 插件初始化示例:
```js
const graph = new Graph({
plugins: [
{
type: 'timebar',
data: timeData, // 时间数据
width: 450, // 时间条宽度
height: 60, // 时间条高度
position: 'bottom', // 位置
loop: false, // 是否循环播放
},
],
});
```
## 在线体验
<embed src="@/common/api/plugins/timebar.md"></embed>
## 配置项
| 属性 | 描述 | 类型 | 默认值 | 必选 |
| -------------- | ------------------------------------------------------------------------------------------------------------------------------ | -------------------------------------------------- | ------------ | ---- |
| type | 插件类型 | string | `timebar` | ✓ |
| key | 插件的唯一标识,可用于获取插件实例或更新插件选项 | string | - | |
| className | 给工具栏的 DOM 追加的类名 | string | `g6-timebar` | |
| x | X 位置(设置后 position 会失效) | number | - | |
| y | Y 位置(设置后 position 会失效) | number | - | |
| width | 时间条宽度 | number | 450 | |
| height | 时间条高度 | number | 60 | |
| position | 时间条位置 | `bottom` \| `top` | `bottom` | |
| padding | 边距 | number \| number[] | 10 | |
| data | 时间数据 | number[] \| { time: number; value: number }[] | - | ✓ |
| timebarType | 时间条展示类型 | `time` \| `chart` | `time` | |
| elementTypes | 筛选元素类型 | (`node` \| `edge` \| `combo`)[] | [`node`] | |
| mode | 控制元素的筛选方式,支持以下两种配置: <br/>- `modify`:通过修改图数据进行筛选 <br/>- `visibility`:通过修改元素可见性进行筛选 | `modify` \| `visibility` | `modify` | |
| values | 当前时间值 | number \| [number, number] \| Date \| [Date, Date] | - | |
| loop | 是否循环播放 | boolean | false | |
| getTime | 获取元素时间的方法 | (datum: ElementDatum) => number | - | |
| labelFormatter | 图表模式下自定义时间格式化 | (time: number \| Date) => string | - | |
| onChange | 时间区间变化时的回调 | (values: number \| [number, number]) => void | - | |
| onReset | 重置时的回调 | () => void | - | |
| onSpeedChange | 播放速度变化时的回调 | (speed: number) => void | - | |
| onPlay | 开始播放时的回调 | () => void | - | |
| onPause | 暂停时的回调 | () => void | - | |
| onBackward | 后退时的回调 | () => void | - | |
| onForward | 前进时的回调 | () => void | - | |
### timebarType
`timebarType` 属性用于控制时间条的展示类型,支持以下两种配置:
- `time`:显示为时间轴形式,参考 [时间模式示例](/examples/plugin/timebar/#timer)
- `chart`:显示为趋势图形式,此时`timebar`下的`data`配置项,每个数组项需要额外传入 `value` 字段作为图表数据,参考 [图表模式示例](/examples/plugin/timebar/#chart)
## 代码示例
### 基础用法
最简单的配置方式:
```js
const graph = new Graph({
layout: { type: 'grid', cols: 5 },
plugins: [
{
type: 'timebar',
data: [
{
time: new Date('2023-08-01').getTime(),
value: 5,
},
{
time: new Date('2023-08-02').getTime(),
value: 10,
},
{
time: new Date('2023-08-03').getTime(),
value: 15,
},
],
},
],
data: {
nodes: [
{
id: 'node1',
label: '节点1',
// 默认情况下 elementTypes=['node'],所以节点需要设置 data.timestamp,才能按照时间轴内的时间依次展示
data: {
timestamp: new Date('2023-08-01').getTime(),
},
},
{
id: 'node2',
label: '节点2',
data: {
timestamp: new Date('2023-08-02').getTime(),
},
},
{
id: 'node3',
label: '节点3',
data: {
timestamp: new Date('2023-08-03').getTime(),
},
},
],
edges: [
{
id: 'edge1',
source: 'node1',
target: 'node2',
// 场景一:默认情况 elementTypes = ['node']
// - 边不需要设置 data.timestamp,边的显示/隐藏完全取决于其连接的两个节点是否可见
// 场景二:如果elementTypes包含了'edge',比如 elementTypes = ['node', 'edge']
// - 此时必须为边设置 data.timestamp,边的显示受其控制
// data: {
// timestamp: new Date('2023-08-01').getTime()
// }
},
{
id: 'edge2',
source: 'node2',
target: 'node3',
},
{
id: 'edge3',
source: 'node3',
target: 'node1',
},
],
},
});
```
效果如下:
```js | ob { pin: false, inject: true }
import { Graph } from '@antv/g6';
const graph = new Graph({
container: 'container',
width: 600,
height: 400,
width: 600,
height: 400,
layout: { type: 'grid', cols: 5 },
plugins: [
{
type: 'timebar',
data: [
{
time: new Date('2023-08-01').getTime(),
value: 5,
},
{
time: new Date('2023-08-02').getTime(),
value: 10,
},
{
time: new Date('2023-08-03').getTime(),
value: 15,
},
],
},
],
data: {
nodes: [
{
id: 'node1',
label: '节点1',
data: {
timestamp: new Date('2023-08-01').getTime(),
},
},
{
id: 'node2',
label: '节点2',
data: {
timestamp: new Date('2023-08-02').getTime(),
},
},
{
id: 'node3',
label: '节点3',
data: {
timestamp: new Date('2023-08-03').getTime(),
},
},
],
edges: [
{
id: 'edge1',
source: 'node1',
target: 'node2',
},
{
id: 'edge2',
source: 'node2',
target: 'node3',
},
{
id: 'edge3',
source: 'node3',
target: 'node1',
},
],
},
});
graph.render();
```
### 自定义样式
`width`、`height`、`padding`、`className` 可自定义时间条的展示效果,但需要注意 `className` 仅作用于外层 DOM 容器,无法影响时间条内部的 Canvas 渲染内容(时间轴、图表、播放按钮等)。
```js
const graph = new Graph({
plugins: [
{
type: 'timebar',
className: 'custom-timebar', // 注意:由于内容是 Canvas 渲染,CSS 样式无法影响到时间条的内部内容
width: 400, // 设置时间条宽度
height: 80, // 设置时间条高度
padding: [20, 20, 10, 20], // 设置内边距 [上, 右, 下, 左]
position: 'bottom', // 位置保持在底部
data: timeData,
// labelFormatter: (time) => {
// return new Date(time).toLocaleDateString();
// }
},
],
});
```
通过 CSS 只能设置时间条容器的样式:
```css
.custom-timebar {
background-color: #f0f0f0;
border: 1px solid #ccc;
border-radius: 5px;
box-shadow: 0 2px 4px rgba(0, 0, 0, 0.1);
}
```
效果如下:
```js | ob { pin: false }
createGraph(
{
data: () => {
return {
nodes: [
{
id: 'node1',
style: { x: 100, y: 100, label: 'Node 1' },
data: {
timestamp: new Date('2023-08-01').getTime(),
},
},
{
id: 'node2',
style: { x: 200, y: 100, label: 'Node 2' },
data: {
timestamp: new Date('2023-08-01').getTime() + 3600 * 24 * 1000,
},
},
{
id: 'node3',
style: { x: 150, y: 200, label: 'Node 3' },
data: {
timestamp: new Date('2023-08-01').getTime() + 3600 * 24 * 1000 * 2,
},
},
],
edges: [
{ id: 'edge1', source: 'node1', target: 'node2' },
{ id: 'edge2', source: 'node2', target: 'node3' },
{ id: 'edge3', source: 'node3', target: 'node1' },
],
};
},
node: {
style: {
size: 20,
label: true,
},
},
edge: {
style: {
stroke: '#91d5ff',
lineWidth: 1,
},
},
plugins: [
{
type: 'timebar',
className: 'custom-timebar',
width: 400,
height: 80,
padding: [20, 20, 10, 20],
position: 'bottom',
data: [
{
time: new Date('2023-08-01').getTime(),
value: 5,
},
{
time: new Date('2023-08-01').getTime() + 3600 * 24 * 1000,
value: 10,
},
{
time: new Date('2023-08-01').getTime() + 3600 * 24 * 1000 * 2,
value: 15,
},
],
labelFormatter: (time) => {
return new Date(time).toLocaleDateString();
},
},
],
},
{ width: 600, height: 400 },
(gui, graph) => {
gui?.hide();
const style = document.createElement('style');
style.innerHTML = `
.custom-timebar {
background-color: #f0f0f0;
border: 1px solid #ccc;
border-radius: 5px;
box-shadow: 0 2px 4px rgba(0, 0, 0, 0.1);
}
`;
document.head.appendChild(style);
},
);
```
## 实际案例
- [时间模式](/examples/plugin/timebar/#timer)
- [图表模式](/examples/plugin/timebar/#chart)
Plugin Skill
packages/site/docs/manual/plugin/Title.en.md anthropic-skill ~2,676 tokens---
title: Title
order: 15
---
## Overview
Title indicates the name of the image and conveys the brief content of the image.
## Basic Usage
The following is a simple example of initializing the Title plugin:
```js
const graph = new Graph({
plugins: [
{
key: 'title',
type: 'title',
title: 'This is a title',
subTitle: 'This is a subtitle',
},
],
});
```
## Configuration Options
| Option | Description | Type | Default | Required |
| --------- | ------------------------------------------------------------- | ----------------------------- | ------------ | -------- |
| type | Plugin type | string | `title` | ✓ |
| key | Unique identifier for the plugin, used for subsequent updates | string | - | |
| title | title content [style config](#title) | `TitleStyle` | - | ✓ |
| subtitle | subtitle content [style config](#subtitle) | `SubTitleStyle` | - | |
| spacing | Vertical spacing between main title and subtitle | number | 8 | |
| className | Class name of the title canvas | string | - | |
| align | Graph title alignment | `left` \| `center` \| `right` | `left` | |
| size | Height of the title plugin | number | 44 | |
| padding | Padding | number \| number[] | [16,24,0,24] | |
### size
<description> _number_ **optional** </description>
Used to configure the space height of the title plugin. Default is `44`。
### align
<description> _string_ **optional** </description>
Used to configure the horizontal alignment of the title plugin. Default is `left`. You can choose `left`, `center`, or `right`, representing left-aligned, center-aligned, and right-aligned respectively.
```js | ob { pin: false }
createGraph(
{
data: { nodes: Array.from({ length: 12 }).map((_, i) => ({ id: `node${i}` })) },
node: {
palette: 'spectral',
style: { labelText: 'Ciallo' },
},
behaviors: ['drag-canvas', 'zoom-canvas', 'drag-element'],
plugins: [
{
key: 'title',
type: 'title',
title: 'This is a title This is a title',
subtitle: 'This is a sub-',
},
],
layout: { type: 'circular' },
autoFit: 'view',
},
{ width: 600, height: 300 },
(gui, graph) => {
const options = { align: 'left' };
const optionFolder = gui.addFolder('Align Options');
optionFolder.add(options, 'align', ['left', 'center', 'right']);
optionFolder.onChange(({ property, value }) => {
graph.updatePlugin({
key: 'title',
[property]: value,
});
graph.render();
});
},
);
```
### spacing
<description> _number_ **optional** </description>
Used to configure the spacing between the chart main title and subtitle. Default is `8`. Appropriate spacing can make the chart look more harmonious overall.
### title
The title, specifically the main title, can be customized with the following configurations for various title styles.
| Attr | Desc | Type | Default |
| ------------------ | -------------------------------------------------- | ---------- | --------------------- |
| title | Title text content | `string` | - |
| titleFontSize | Title text size | `number` | 16 |
| titleFontFamily | Title text font | `string` | system-ui, sans-serif |
| titleFontWeight | Title font weight | `number` | bold |
| titleLineHeight | Title text line height | `number` | 16 |
| titleTextAlign | Horizontal alignment of content in title text line | `string` | left |
| titleTextBaseline | Vertical baseline of title text | `string` | top |
| titleFill | Fill color of title text | `string` | #1D2129 |
| titleFillOpacity | Fill transparency of title text | `number` | 0.9 |
| titleStroke | Stroke color of title text | `string` | transparent |
| titleStrokeOpacity | Stroke transparency of title text | `number` | 1 |
| titleLineWidth | Stroke width of title text | `number` | 0 |
| titleLineDash | Dash style of title text | `number[]` | [] |
| titleOpacity | Overall transparency of title text | `number` | 1 |
| titleShadowColor | Shadow color of title text | `string` | transparent |
| titleShadowBlur | Gaussian blur coefficient of title text shadow | `number` | 0 |
| titleShadowOffsetX | Horizontal offset of title text shadow | `number` | 0 |
| titleShadowOffsetY | Vertical offset of title text shadow | `number` | 0 |
| titleCursor | Mouse style of title text | `string` | default |
| titleDx | Horizontal offset of title text | `number` | 0 |
| titleDy | Vertical offset of title text | `number` | 0 |
### subtitle
The subtitle, which can be customized with the following configurations for various subtitle styles.
| Attr | Desc | Type | Default |
| --------------------- | ----------------------------------------------- | ---------- | --------------------- |
| subtitle | Subtitle text content | `string` | - |
| subtitleFontSize | Subtitle text size | `number` | 12 |
| subtitleFontFamily | Subtitle text font | `string` | system-ui, sans-serif |
| subtitleFontWeight | Subtitle font weight | `number` | normal |
| subtitleLineHeight | Subtitle text line height | `number` | 12 |
| subtitleTextAlign | Subtitle text line content horizontal alignment | `string` | left |
| subtitleTextBaseline | Subtitle text vertical baseline | `string` | top |
| subtitleFill | Subtitle text fill color | `string` | #1D2129 |
| subtitleFillOpacity | Subtitle text fill transparency | `number` | 0.65 |
| subtitleStroke | Subtitle text stroke color | `string` | transparent |
| subtitleStrokeOpacity | Subtitle text stroke transparency | `number` | 1 |
| subtitleLineWidth | Subtitle text stroke width | `number` | 0 |
| subtitleLineDash | Subtitle text dashed line style | `number[]` | [] |
| subtitleOpacity | Subtitle text overall transparency | `number` | 1 |
| subtitleShadowColor | Subtitle text shadow color | `string` | transparent |
| subtitleShadowBlur | Subtitle text shadow Gaussian blur coefficient | `number` | 0 |
| subtitleShadowOffsetX | Subtitle text shadow horizontal offset | `number` | 0 |
| subtitleShadowOffsetY | Subtitle text shadow vertical offset | `number` | 0 |
| subtitleCursor | Subtitle text mouse style | `string` | default |
| subtitleDx | Subtitle text horizontal offset | `number` | 0 |
| subtitleDy | Subtitle text vertical offset | `number` | 0 |
## Try it
Feel free to modify this example and try different configurations
```js | ob { pin: true, inject: true }
import { Graph } from '@antv/g6';
const graph = new Graph({
container: 'container',
data: { nodes: Array.from({ length: 12 }).map((_, i) => ({ id: `node${i}` })) },
behaviors: ['drag-canvas', 'zoom-canvas', 'drag-element'],
plugins: [
{
key: 'title',
type: 'title',
align: 'center', // Alignment of title
spacing: 4, // Spacing between main title and subtitle
size: 60, // Height of title, default is 44
// title
title: 'This is a title This is a title', // Title text
titleFontSize: 28, // Main title font size
titleFontFamily: 'sans-serif', // Main title font
titleFontWeight: 600, // Main title font weight
titleFill: '#fff', // Main title text color
titleFillOpacity: 1, // Main title text transparency
titleStroke: '#000', // Main title text stroke color
titleLineWidth: 2, // Main title text stroke line width
titleStrokeOpacity: 1, // Main title text stroke transparency
// subtitle
subtitle: 'This is a sub-', // Subtitle text
subtitleFontSize: 16, // Subtitle font size
subtitleFontFamily: 'Arial', // Subtitle font
subtitleFontWeight: 300, // Subtitle font weight
subtitleFill: '#2989FF', // Subtitle text color
subtitleFillOpacity: 1, // Subtitle text transparency
subtitleStroke: '#000', // Subtitle text stroke color
subtitleLineWidth: 1, // Subtitle text stroke line width
subtitleStrokeOpacity: 0.5, // Subtitle text stroke transparency
},
],
node: {
palette: 'spectral',
style: { labelText: 'Ciallo' },
},
layout: {
type: 'circular',
},
autoFit: 'view',
});
graph.render();
```
Plugin Skill
packages/site/docs/manual/plugin/Title.zh.md anthropic-skill ~1,997 tokens---
title: 标题 Title
order: 15
---
## 概述
Title(标题)表明了这张图的名称,传达图的简略内容
## 基本用法
以下是一个简单的 Title 插件初始化示例:
```js
const graph = new Graph({
plugins: [
{
key: 'title',
type: 'title',
title: '这是一个标题',
subTitle: '这是一个副标题',
},
],
});
```
## 配置项
| 属性 | 描述 | 类型 | 默认值 | 必选 |
| --------- | -------------------------------- | ----------------------------- | ------------ | ---- |
| type | 插件类型 | string | `title` | ✓ |
| key | 插件唯一标识符,用于后续更新 | string | - | |
| title | 标题内容 [样式配置](#title) | `TitleStyle` | - | ✓ |
| subtitle | 副标题内容 [样式配置](#subtitle) | `SubTitleStyle` | - | |
| spacing | 主标题、副标题之间的上下间距 | number | 8 | |
| className | 标题画布类名 | string | - | |
| align | 标题相对于画布的位置 | `left` \| `center` \| `right` | `left` | |
| size | 整个标题插件的高度 | number | 44 | |
| padding | 内边距 | number \| number[] | [16,24,0,24] | |
### size
<description> _number_ **optional** </description>
用于配置标题的空间高度大小,默认为 `44`。
### align
<description> _string_ **optional** </description>
用于配置标题的的左右对齐方式,默认为 `left`,可以选择使用 `left`,`center`,`right`,分别代表着居左对齐、居中对齐、居右对齐。
```js | ob { pin: false }
createGraph(
{
data: { nodes: Array.from({ length: 12 }).map((_, i) => ({ id: `node${i}` })) },
node: {
palette: 'spectral',
style: { labelText: '你好' },
},
behaviors: ['drag-canvas', 'zoom-canvas', 'drag-element'],
plugins: [
{
key: 'title',
type: 'title',
title: '这是一个标题这是一个标题',
subtitle: '这是一个副标',
},
],
layout: { type: 'circular' },
autoFit: 'view',
},
{ width: 600, height: 300 },
(gui, graph) => {
const options = { align: 'left' };
const optionFolder = gui.addFolder('Align Options');
optionFolder.add(options, 'align', ['left', 'center', 'right']);
optionFolder.onChange(({ property, value }) => {
graph.updatePlugin({
key: 'title',
[property]: value,
});
graph.render();
});
},
);
```
### spacing
<description> _number_ **optional** </description>
用于配置主标题和副标题之间的间距,默认为 `8`,合适的间距,可以让看起来整体更协调。
### title
的标题,具体来说是主标题,可以用以下的配置来定制标题的各种样式。
| 属性 | 描述 | 类型 | 默认值 |
| ------------------ | ------------------------------ | ---------- | --------------------- |
| title | 标题文字内容 | `string` | - |
| titleFontSize | 标题文字大小 | `number` | 16 |
| titleFontFamily | 标题文字字体 | `string` | system-ui, sans-serif |
| titleFontWeight | 标题字体粗细 | `number` | bold |
| titleLineHeight | 标题文字的行高 | `number` | 16 |
| titleTextAlign | 标题文字行内内容的水平对齐方式 | `string` | left |
| titleTextBaseline | 标题文字垂直方向的基线 | `string` | top |
| titleFill | 标题文字的填充色 | `string` | #1D2129 |
| titleFillOpacity | 标题文字的填充透明度 | `number` | 0.9 |
| titleStroke | 标题文字的描边颜色 | `string` | transparent |
| titleStrokeOpacity | 标题文字的描边透明度 | `number` | 1 |
| titleLineWidth | 标题文字描边宽度 | `number` | 0 |
| titleLineDash | 标题文字虚线样式 | `number[]` | [] |
| titleOpacity | 标题文字整体透明度 | `number` | 1 |
| titleShadowColor | 标题文字阴影颜色 | `string` | transparent |
| titleShadowBlur | 标题文字阴影的高斯模糊系数 | `number` | 0 |
| titleShadowOffsetX | 标题文字阴影水平偏移量 | `number` | 0 |
| titleShadowOffsetY | 标题文字阴影垂直偏移量 | `number` | 0 |
| titleCursor | 标题文字鼠标样式 | `string` | default |
| titleDx | 标题文字在水平方向的偏移量 | `number` | 0 |
| titleDy | 标题文字在垂直方向的偏移量 | `number` | 0 |
### subtitle
的副标题,可以用以下的配置来定制副标题的各种样式。
| 属性 | 描述 | 类型 | 默认值 |
| --------------------- | -------------------------------- | ---------- | --------------------- |
| subtitle | 副标题文字内容 | `string` | - |
| subtitleFontSize | 副标题文字大小 | `number` | 12 |
| subtitleFontFamily | 副标题文字字体 | `string` | system-ui, sans-serif |
| subtitleFontWeight | 副标题字体粗细 | `number` | normal |
| subtitleLineHeight | 副标题文字的行高 | `number` | 12 |
| subtitleTextAlign | 副标题文字行内内容的水平对齐方式 | `string` | left |
| subtitleTextBaseline | 副标题文字垂直方向的基线 | `string` | top |
| subtitleFill | 副标题文字的填充色 | `string` | #1D2129 |
| subtitleFillOpacity | 副标题文字的填充透明度 | `number` | 0.65 |
| subtitleStroke | 副标题文字的描边颜色 | `string` | transparent |
| subtitleStrokeOpacity | 副标题文字的描边透明度 | `number` | 1 |
| subtitleLineWidth | 副标题文字描边宽度 | `number` | 0 |
| subtitleLineDash | 副标题文字虚线样式 | `number[]` | [] |
| subtitleOpacity | 副标题文字整体透明度 | `number` | 1 |
| subtitleShadowColor | 副标题文字阴影颜色 | `string` | transparent |
| subtitleShadowBlur | 副标题文字阴影的高斯模糊系数 | `number` | 0 |
| subtitleShadowOffsetX | 副标题文字阴影水平偏移量 | `number` | 0 |
| subtitleShadowOffsetY | 副标题文字阴影垂直偏移量 | `number` | 0 |
| subtitleCursor | 副标题文字鼠标样式 | `string` | default |
| subtitleDx | 副标题文字在水平方向的偏移量 | `number` | 0 |
| subtitleDy | 副标题文字在垂直方向的偏移量 | `number` | 0 |
## 尝试一下
你可以在这个例子里随意修改并尝试不同的配置
```js | ob { pin: true, inject: true }
import { Graph } from '@antv/g6';
const graph = new Graph({
container: 'container',
data: { nodes: Array.from({ length: 12 }).map((_, i) => ({ id: `node${i}` })) },
behaviors: ['drag-canvas', 'zoom-canvas', 'drag-element'],
plugins: [
{
key: 'title',
type: 'title',
align: 'center', // 标题的对齐方式
spacing: 4, // 主标题和副标题之间的间距
size: 60, // 标题的高度,默认为 44
// 标题
title: '这是一个标题这是一个标题', // 标题的文本
titleFontSize: 28, // 主标题的字体大小
titleFontFamily: 'sans-serif', // 主标题的字体
titleFontWeight: 600, // 主标题的字体粗细
titleFill: '#fff', // 主标题的文字颜色
titleFillOpacity: 1, // 主标题的文字透明度
titleStroke: '#000', // 主标题的文字描边颜色
titleLineWidth: 2, // 主标题的文字描边线宽
titleStrokeOpacity: 1, // 主标题的文字描边透明度
// 副标题
subtitle: '这是一个副标', // 副标题的文本
subtitleFontSize: 16, // 副标题的字体大小
subtitleFontFamily: 'Arial', // 副标题的字体
subtitleFontWeight: 300, // 副标题的字体粗细
subtitleFill: '#2989FF', // 副标题的文字颜色
subtitleFillOpacity: 1, // 副标题的文字透明度
subtitleStroke: '#000', // 副标题的文字描边颜色
subtitleLineWidth: 1, // 副标题的文字描边线宽
subtitleStrokeOpacity: 0.5, // 副标题的文字描边透明度
},
],
node: {
palette: 'spectral',
style: { labelText: '你好' },
},
layout: {
type: 'circular',
},
autoFit: 'view',
});
graph.render();
```
Plugin Skill
packages/site/docs/manual/plugin/Toolbar.en.md anthropic-skill ~2,848 tokens---
title: Toolbar
order: 15
---
## Overview
The Toolbar is a plugin in G6 used to provide a collection of operation buttons, supporting common chart operations such as zoom in, zoom out, auto-fit, and reset. Through the toolbar, users can quickly access common functions of the chart, improving operational efficiency and user experience.
## Use Cases
This plugin is mainly used for:
- Quickly accessing common functions of the chart
## Basic Usage
Below is a simple example of initializing the Toolbar plugin:
```js
const graph = new Graph({
// Other configurations...
plugins: [
{
type: 'toolbar',
getItems: () => [
{ id: 'zoom-in', value: 'zoom-in' },
{ id: 'zoom-out', value: 'zoom-out' },
{ id: 'auto-fit', value: 'auto-fit' },
],
onClick: (value) => {
// Handle button click events
if (value === 'zoom-in') {
graph.zoomTo(1.1);
} else if (value === 'zoom-out') {
graph.zoomTo(0.9);
} else if (value === 'auto-fit') {
graph.fitView();
}
},
},
],
});
```
## Configuration Options
| Property | Description | Type | Default Value | Required |
| --------- | ---------------------------------------------------------------------------- | ------------------------------------------------------------------------------------------- | ------------- | -------- |
| type | Plugin type | string | `toolbar` | ✓ |
| key | Unique identifier for the plugin, used for updates | string | - | |
| className | Additional CSS class name for the toolbar DOM element | string | - | |
| position | Toolbar position relative to the canvas, [optional values](#position) | string | `'top-left'` | |
| style | Custom style for the toolbar DOM element, [common values](#style-attributes) | [CSSStyleDeclaration](https://developer.mozilla.org/en-US/docs/Web/API/CSSStyleDeclaration) | - | |
| getItems | Returns the list of toolbar items | () => [ToolbarItem](#toolbaritem)[] \| Promise<[ToolbarItem](#toolbaritem)[]> | - | ✓ |
| onClick | Callback function after a toolbar item is clicked | (value: string, target: Element) => void | - | |
### position
The `position` parameter supports the following values:
- `'top-left'`: Top left corner
- `'top-right'`: Top right corner
- `'bottom-left'`: Bottom left corner
- `'bottom-right'`: Bottom right corner
- `'left-top'`: Left side, top
- `'left-bottom'`: Left side, bottom
- `'right-top'`: Right side, top
- `'right-bottom'`: Right side, bottom
### style Attributes
| Attribute | Description | Type | Default Value |
| --------------- | ---------------- | ------ | ------------------- |
| backgroundColor | Background color | string | `#fff` |
| border | Border | string | `1px solid #e8e8e8` |
| borderRadius | Border radius | string | `4px` |
| height | Height | string | `auto` |
| margin | Margin | string | `12px` |
| opacity | Opacity | number | 0.9 |
| padding | Padding | string | `8px` |
| width | Width | string | `auto` |
### ToolbarItem
Each toolbar item (ToolbarItem) includes the following attributes:
| Attribute | Description | Type | Required |
| --------- | ---------------------------------------------------------- | -------- | -------- |
| id | Icon ID of the item, see [Built-in Icons](#built-in-icons) | `string` | ✓ |
| value | Value returned when the item is clicked | `string` | ✓ |
### Built-in Icons
The Toolbar provides the following built-in icon IDs:
- `'zoom-in'`: Zoom in
- `'zoom-out'`: Zoom out
- `'redo'`: Redo
- `'undo'`: Undo
- `'edit'`: Edit
- `'delete'`: Delete
- `'auto-fit'`: Auto-fit view
- `'export'`: Export chart
- `'reset'`: Reset view
- `'request-fullscreen'`: Request fullscreen
- `'exit-fullscreen'`: Exit fullscreen
### Custom Icons
In addition to using built-in icons, you can also use custom icons by introducing third-party icon libraries (such as Alibaba iconfont):
```js
// Introduce iconfont script
const iconFont = document.createElement('script');
iconFont.src = '//at.alicdn.com/t/font_8d5l8fzk5b87iudi.js'; // Replace with your iconfont script URL
document.head.appendChild(iconFont);
// Use custom icons in the toolbar
const graph = new Graph({
// Other configurations...
plugins: [
{
type: 'toolbar',
getItems: () => [
{ id: 'icon-xinjian', value: 'new' }, // Use icons from iconfont
{ id: 'icon-fenxiang', value: 'share' },
{ id: 'icon-chexiao', value: 'undo' },
],
onClick: (value) => {
// Handle click events
},
},
],
});
```
> Note: Custom icon IDs usually start with `icon-` and need to correspond to the icon names in the introduced iconfont.
## Code Examples
### Basic Toolbar
```js
const graph = new Graph({
// Other configurations...
plugins: [
{
type: 'toolbar',
position: 'top-right',
getItems: () => [
{ id: 'zoom-in', value: 'zoom-in' },
{ id: 'zoom-out', value: 'zoom-out' },
{ id: 'undo', value: 'undo' },
{ id: 'redo', value: 'redo' },
{ id: 'auto-fit', value: 'fit' },
],
onClick: (value) => {
// redo, undo need to be used with the history plugin
const history = graph.getPluginInstance('history');
switch (value) {
case 'zoom-in':
graph.zoomTo(1.1);
break;
case 'zoom-out':
graph.zoomTo(0.9);
break;
case 'undo':
history?.undo();
break;
case 'redo':
history?.redo();
break;
case 'fit':
graph.fitView();
break;
default:
break;
}
},
},
],
});
```
### Custom Styles
```js
const graph = new Graph({
// Other configurations...
plugins: [
{
type: 'toolbar',
className: 'my-custom-toolbar',
style: {
backgroundColor: '#f5f5f5',
padding: '8px',
boxShadow: '0 2px 8px rgba(0, 0, 0, 0.15)',
borderRadius: '8px',
border: '1px solid #e8e8e8',
opacity: '0.9',
marginTop: '12px',
marginLeft: '12px',
},
getItems: () => [
{ id: 'zoom-in', value: 'zoom-in' },
{ id: 'zoom-out', value: 'zoom-out' },
],
onClick: (value) => {
// Handle click events
},
},
],
});
```
> Common style attributes include:
>
> - `backgroundColor`: Background color
> - `padding`: Padding
> - `margin`/`marginTop`/`marginLeft`, etc.: Margin
> - `border`: Border
> - `borderRadius`: Border radius
> - `boxShadow`: Shadow effect
> - `opacity`: Opacity
> - `width`/`height`: Width and height (default is content adaptive)
> - `zIndex`: Layer (default is 100)
> - `display`: Display mode (default is flex)
The toolbar container is set to `display: flex` by default, and child items use row layout by default (or change according to the direction configured by position). You can customize its appearance and position through `style`.
### Asynchronous Loading of Toolbar Items
```js
const graph = new Graph({
// Other configurations...
plugins: [
{
type: 'toolbar',
getItems: async () => {
// Toolbar configuration can be obtained from the server or other asynchronous sources
const response = await fetch('/api/toolbar-config');
const items = await response.json();
return items;
},
onClick: (value) => {
// Handle click events
},
},
],
});
```
## Common Issues
### 1. Toolbar icons not displaying?
- Check if the correct built-in icon ID is used
- Ensure CSS styles are not overridden or conflicting
### 2. How to use with other plugins?
The toolbar is often used in conjunction with other plugins (such as history):
```js
const graph = new Graph({
plugins: [
{
type: 'history',
key: 'history',
},
{
type: 'toolbar',
getItems: () => [
{ id: 'undo', value: 'undo' },
{ id: 'redo', value: 'redo' },
],
onClick: (value) => {
const history = graph.getPluginInstance('history');
if (value === 'undo') {
history.undo();
} else if (value === 'redo') {
history.redo();
}
},
},
],
});
```
### 3. How to dynamically update the toolbar?
You can use the `updatePlugin` method to dynamically update the toolbar:
```js
const graph = new Graph({
// Other configurations...
plugins: [
{
type: 'toolbar',
key: 'my-toolbar',
},
],
});
// Update toolbar position
graph.updatePlugin({
key: 'my-toolbar',
position: 'bottom-right',
});
```
## Real Cases
```js | ob { inject: true }
import { Graph } from '@antv/g6';
const data = {
nodes: [{ id: 'node-0' }, { id: 'node-1' }, { id: 'node-2' }, { id: 'node-3' }, { id: 'node-4' }, { id: 'node-5' }],
edges: [
{ source: 'node-0', target: 'node-1' },
{ source: 'node-0', target: 'node-2' },
{ source: 'node-0', target: 'node-3' },
{ source: 'node-0', target: 'node-4' },
{ source: 'node-1', target: 'node-0' },
{ source: 'node-2', target: 'node-0' },
{ source: 'node-3', target: 'node-0' },
{ source: 'node-4', target: 'node-0' },
{ source: 'node-5', target: 'node-0' },
],
};
const graph = new Graph({
container: 'container',
data,
layout: {
type: 'grid',
},
behaviors: ['zoom-canvas', 'drag-canvas', 'drag-element'],
plugins: [
{
type: 'toolbar',
position: 'top-left',
onClick: (item) => {
alert('item clicked:' + item);
},
getItems: () => {
// G6 内置了 9 个 icon,分别是 zoom-in、zoom-out、redo、undo、edit、delete、auto-fit、export、reset
return [
{ id: 'zoom-in', value: 'zoom-in' },
{ id: 'zoom-out', value: 'zoom-out' },
{ id: 'redo', value: 'redo' },
{ id: 'undo', value: 'undo' },
{ id: 'edit', value: 'edit' },
{ id: 'delete', value: 'delete' },
{ id: 'auto-fit', value: 'auto-fit' },
{ id: 'export', value: 'export' },
{ id: 'reset', value: 'reset' },
];
},
},
],
});
graph.render();
```
Plugin Skill
packages/site/docs/manual/plugin/Toolbar.zh.md anthropic-skill ~2,268 tokens---
title: 工具栏 Toolbar
order: 15
---
## 概述
Toolbar 是 G6 中用于提供操作按钮集合的插件,支持放大、缩小、自适应、重置等常用图表操作。通过工具栏,用户可以快速访问图表的常用功能,提高操作效率和用户体验。
## 使用场景
这一插件主要用于:
- 快速访问图表的常用功能
## 基本用法
以下是一个简单的 Toolbar 插件初始化示例:
```js
const graph = new Graph({
// 其他配置...
plugins: [
{
type: 'toolbar',
getItems: () => [
{ id: 'zoom-in', value: 'zoom-in' },
{ id: 'zoom-out', value: 'zoom-out' },
{ id: 'auto-fit', value: 'auto-fit' },
],
onClick: (value) => {
// 处理按钮点击事件
if (value === 'zoom-in') {
graph.zoomTo(1.1);
} else if (value === 'zoom-out') {
graph.zoomTo(0.9);
} else if (value === 'auto-fit') {
graph.fitView();
}
},
},
],
});
```
## 配置项
| 属性 | 描述 | 类型 | 默认值 | 必选 |
| --------- | ------------------------------------------------ | ------------------------------------------------------------------------------------------- | ------------ | ---- |
| type | 插件类型 | string | `toolbar` | ✓ |
| key | 插件唯一标识符,用于后续更新 | string | - | |
| className | 工具栏DOM元素的额外CSS类名 | string | - | |
| position | 工具栏位置,相对于画布,[可选值](#position) | string | `'top-left'` | |
| style | 工具栏DOM元素的自定义样式,[常用值](#style-属性) | [CSSStyleDeclaration](https://developer.mozilla.org/zh-CN/docs/Web/API/CSSStyleDeclaration) | - | |
| getItems | 返回工具栏项目列表 | () => [ToolbarItem](#toolbaritem)[] \| Promise<[ToolbarItem](#toolbaritem)[]> | - | ✓ |
| onClick | 工具栏项目点击后的回调函数 | (value: string, target: Element) => void | - | |
### position
`position` 参数支持以下值:
- `'top-left'`:左上角
- `'top-right'`:右上角
- `'bottom-left'`:左下角
- `'bottom-right'`:右下角
- `'left-top'`:左侧靠上
- `'left-bottom'`:左侧靠下
- `'right-top'`:右侧靠上
- `'right-bottom'`:右侧靠下
### style 属性
| 属性 | 描述 | 类型 | 默认值 |
| --------------- | -------- | ------ | ------------------- |
| backgroundColor | 背景颜色 | string | `#fff` |
| border | 边框 | string | `1px solid #e8e8e8` |
| borderRadius | 圆角 | string | `4px` |
| height | 高度 | string | `auto` |
| margin | 外边距 | string | `12px` |
| opacity | 透明度 | number | 0.9 |
| padding | 内边距 | string | `8px` |
| width | 宽度 | string | `auto` |
### ToolbarItem
每个工具栏项目 (ToolbarItem) 包含以下属性:
| 属性 | 描述 | 类型 | 必选 |
| ----- | ----------------------------------------------- | -------- | ---- |
| id | 项目的图标ID,内置图标ID见[内置图标](#内置图标) | `string` | ✓ |
| value | 点击项目时返回的值 | `string` | ✓ |
### 内置图标
Toolbar 提供以下内置图标 ID:
- `'zoom-in'`:放大
- `'zoom-out'`:缩小
- `'redo'`:重做
- `'undo'`:撤销
- `'edit'`:编辑
- `'delete'`:删除
- `'auto-fit'`:自适应视图
- `'export'`:导出图表
- `'reset'`:重置视图
- `'request-fullscreen'`:请求全屏
- `'exit-fullscreen'`:退出全屏
### 自定义图标
除了使用内置图标外,还可以通过引入第三方图标库(如阿里巴巴 iconfont)来使用自定义图标:
```js
// 引入 iconfont 脚本
const iconFont = document.createElement('script');
iconFont.src = '//at.alicdn.com/t/font_8d5l8fzk5b87iudi.js'; // 替换为你的 iconfont 脚本地址
document.head.appendChild(iconFont);
// 在工具栏中使用自定义图标
const graph = new Graph({
// 其他配置...
plugins: [
{
type: 'toolbar',
getItems: () => [
{ id: 'icon-xinjian', value: 'new' }, // 使用 iconfont 中的图标
{ id: 'icon-fenxiang', value: 'share' },
{ id: 'icon-chexiao', value: 'undo' },
],
onClick: (value) => {
// 处理点击事件
},
},
],
});
```
> 注意:自定义图标的 ID 通常以 `icon-` 开头,需要与引入的 iconfont 中的图标名称对应。
## 代码示例
### 基础工具栏
```js
const graph = new Graph({
// 其他配置...
plugins: [
{
type: 'toolbar',
position: 'top-right',
getItems: () => [
{ id: 'zoom-in', value: 'zoom-in' },
{ id: 'zoom-out', value: 'zoom-out' },
{ id: 'undo', value: 'undo' },
{ id: 'redo', value: 'redo' },
{ id: 'auto-fit', value: 'fit' },
],
onClick: (value) => {
// redo、undo 需要配合 history 插件使用
const history = graph.getPluginInstance('history');
switch (value) {
case 'zoom-in':
graph.zoomTo(1.1);
break;
case 'zoom-out':
graph.zoomTo(0.9);
break;
case 'undo':
history?.undo();
break;
case 'redo':
history?.redo();
break;
case 'fit':
graph.fitView();
break;
default:
break;
}
},
},
],
});
```
### 自定义样式
```js
const graph = new Graph({
// 其他配置...
plugins: [
{
type: 'toolbar',
className: 'my-custom-toolbar',
style: {
backgroundColor: '#f5f5f5',
padding: '8px',
boxShadow: '0 2px 8px rgba(0, 0, 0, 0.15)',
borderRadius: '8px',
border: '1px solid #e8e8e8',
opacity: '0.9',
marginTop: '12px',
marginLeft: '12px',
},
getItems: () => [
{ id: 'zoom-in', value: 'zoom-in' },
{ id: 'zoom-out', value: 'zoom-out' },
],
onClick: (value) => {
// 处理点击事件
},
},
],
});
```
> 常用的样式属性包括:
>
> - `backgroundColor`:背景颜色
> - `padding`:内边距
> - `margin`/`marginTop`/`marginLeft` 等:外边距
> - `border`:边框
> - `borderRadius`:圆角
> - `boxShadow`:阴影效果
> - `opacity`:透明度
> - `width`/`height`:宽高(默认自适应内容)
> - `zIndex`:层级(默认为 100)
> - `display`:显示方式(默认为 flex)
工具栏容器默认设置 `display: flex`,子项目默认使用行布局(或根据 position 配置的方向改变)。你可以通过 `style` 自定义其外观和位置。
### 异步加载工具栏项
```js
const graph = new Graph({
// 其他配置...
plugins: [
{
type: 'toolbar',
getItems: async () => {
// 可以从服务器或其他异步源获取工具栏配置
const response = await fetch('/api/toolbar-config');
const items = await response.json();
return items;
},
onClick: (value) => {
// 处理点击事件
},
},
],
});
```
## 常见问题
### 1. 工具栏图标不显示?
- 检查是否使用了正确的内置图标 ID
- 确保 CSS 样式未被覆盖或冲突
### 2. 如何结合其他插件使用?
工具栏常常与其他插件(如历史记录)配合使用:
```js
const graph = new Graph({
plugins: [
{
type: 'history',
key: 'history',
},
{
type: 'toolbar',
getItems: () => [
{ id: 'undo', value: 'undo' },
{ id: 'redo', value: 'redo' },
],
onClick: (value) => {
const history = graph.getPluginInstance('history');
if (value === 'undo') {
history.undo();
} else if (value === 'redo') {
history.redo();
}
},
},
],
});
```
### 3. 如何动态更新工具栏?
可以使用 `updatePlugin` 方法动态更新工具栏:
```js
const graph = new Graph({
// 其他配置...
plugins: [
{
type: 'toolbar',
key: 'my-toolbar',
},
],
});
// 更新工具栏位置
graph.updatePlugin({
key: 'my-toolbar',
position: 'bottom-right',
});
```
## 实际案例
```js | ob { inject: true }
import { Graph } from '@antv/g6';
const data = {
nodes: [{ id: 'node-0' }, { id: 'node-1' }, { id: 'node-2' }, { id: 'node-3' }, { id: 'node-4' }, { id: 'node-5' }],
edges: [
{ source: 'node-0', target: 'node-1' },
{ source: 'node-0', target: 'node-2' },
{ source: 'node-0', target: 'node-3' },
{ source: 'node-0', target: 'node-4' },
{ source: 'node-1', target: 'node-0' },
{ source: 'node-2', target: 'node-0' },
{ source: 'node-3', target: 'node-0' },
{ source: 'node-4', target: 'node-0' },
{ source: 'node-5', target: 'node-0' },
],
};
const graph = new Graph({
container: 'container',
data,
layout: {
type: 'grid',
},
behaviors: ['zoom-canvas', 'drag-canvas', 'drag-element'],
plugins: [
{
type: 'toolbar',
position: 'top-left',
onClick: (item) => {
alert('item clicked:' + item);
},
getItems: () => {
// G6 内置了 9 个 icon,分别是 zoom-in、zoom-out、redo、undo、edit、delete、auto-fit、export、reset
return [
{ id: 'zoom-in', value: 'zoom-in' },
{ id: 'zoom-out', value: 'zoom-out' },
{ id: 'redo', value: 'redo' },
{ id: 'undo', value: 'undo' },
{ id: 'edit', value: 'edit' },
{ id: 'delete', value: 'delete' },
{ id: 'auto-fit', value: 'auto-fit' },
{ id: 'export', value: 'export' },
{ id: 'reset', value: 'reset' },
];
},
},
],
});
graph.render();
```
Plugin Skill
packages/site/docs/manual/plugin/Tooltip.en.md anthropic-skill ~4,033 tokens---
title: Tooltip
order: 16
---
## Overview
The Tooltip plugin is used to display additional information when users hover over or click on elements in the graph. It helps users better understand the data in the graph and improves the interactive experience.
## Use Cases
- **Detailed Information Display**: When users need to understand detailed information about elements, use Tooltip to display this information
- **Data Visualization Assistance**: In data visualization, Tooltip can display detailed information about data points in charts, helping users better understand the data
- **Interactive Feedback**: Provide immediate visual feedback for user mouse operations
## Basic Usage
The simplest Tooltip plugin configuration:
```js
const graph = new Graph({
// Other configurations...
plugins: [
{
type: 'tooltip',
},
],
});
```
## Configuration Options
| Property | Description | Type | Default Value | Required |
| ------------ | ------------------------- | --------------------------------------------------------------------------------------------------------------------------------------------- | ------------------------------------- | -------- |
| type | Plugin type | string | `tooltip` | ✓ |
| key | Identifier | string | - | |
| position | Tooltip position | `top` \| `bottom` \| `left` \| `right` \| `top-left` \| `top-right` \| `bottom-left` \| `bottom-right` | `top-right` | |
| enable | Whether plugin is enabled | boolean \| ((event: [IElementEvent](/en/api/event#event-object-properties), items: NodeData \| EdgeData \| ComboData[]) => boolean) | true | |
| getContent | Custom content | (event: [IElementEvent](/en/api/event#event-object-properties), items: NodeData \| EdgeData \| ComboData[]) => Promise<HTMLElement \| string> | - | |
| onOpenChange | Show/hide callback | (open: boolean) => void | - | |
| trigger | Trigger behavior | `hover` \| `click` | `hover` |
| container | Custom render container | string \| HTMLElement | - | |
| offset | Offset distance | [number,number] | [10,10] | |
| enterable | Whether pointer can enter | boolean | false | |
| title | Title | string | - |
| style | Style object | Record<string,any> | {'.tooltip': { visibility: 'hidden'}} | |
## Detailed Configuration
### enable - Conditional Enable
Controls whether the plugin is enabled, supports passing functions to dynamically adjust enable logic.
**Example: Enable Tooltip only for nodes**
```js | ob { inject: true }
import { Graph } from '@antv/g6';
const data = {
nodes: [
{ id: 'node1', style: { x: 100, y: 100 }, data: { name: 'Server Node' } },
{ id: 'node2', style: { x: 200, y: 100 }, data: { name: 'Database Node' } },
],
edges: [{ source: 'node1', target: 'node2', data: { type: 'Connection' } }],
};
const graph = new Graph({
container: 'container',
width: 400,
height: 200,
data,
plugins: [
{
type: 'tooltip',
// Enable only for nodes, not for edges
enable: (e) => e.targetType === 'node',
getContent: (e, items) => {
return `<div>Node: ${items[0].data.name}</div>`;
},
},
],
});
graph.render();
```
### getContent - Custom Content
Customize Tooltip content rendering, supports returning HTMLElement or string.
**Example: Dynamically render custom HTML content**
```js | ob { inject: true }
import { Graph } from '@antv/g6';
const data = {
nodes: [
{
id: 'node1',
style: { x: 100, y: 100 },
data: { name: 'Server A', type: 'Application Server', status: 'Running', cpu: '45%', memory: '2.1GB' },
},
{
id: 'node2',
style: { x: 250, y: 100 },
data: { name: 'Database B', type: 'MySQL Database', status: 'Normal', connections: 23, size: '500MB' },
},
],
edges: [{ source: 'node1', target: 'node2', data: { bandwidth: '1Gbps', latency: '5ms' } }],
};
const graph = new Graph({
container: 'container',
width: 400,
height: 200,
data,
plugins: [
{
type: 'tooltip',
getContent: (e, items) => {
const item = items[0];
if (e.targetType === 'node') {
return `
<div>
<h4 style="margin: 0 0 8px 0; color: #333; border-bottom: 1px solid #eee; padding-bottom: 4px;">
${item.data.name}
</h4>
<div style="margin: 4px 0; color: #666;">
<strong>Type:</strong> ${item.data.type}
</div>
<div style="margin: 4px 0; color: #666;">
<strong>Status:</strong>
<span style="color: ${item.data.status === 'Running' || item.data.status === 'Normal' ? '#52c41a' : '#ff4d4f'}">
${item.data.status}
</span>
</div>
${item.data.cpu ? `<div style="margin: 4px 0; color: #666;"><strong>CPU:</strong> ${item.data.cpu}</div>` : ''}
${item.data.memory ? `<div style="margin: 4px 0; color: #666;"><strong>Memory:</strong> ${item.data.memory}</div>` : ''}
${item.data.connections ? `<div style="margin: 4px 0; color: #666;"><strong>Connections:</strong> ${item.data.connections}</div>` : ''}
${item.data.size ? `<div style="margin: 4px 0; color: #666;"><strong>Size:</strong> ${item.data.size}</div>` : ''}
</div>
`;
} else if (e.targetType === 'edge') {
return `
<div>
<h4 style="margin: 0 0 8px 0; color: #333;">Connection Info</h4>
<div style="margin: 4px 0; color: #666;"><strong>Bandwidth:</strong> ${item.data.bandwidth}</div>
<div style="margin: 4px 0; color: #666;"><strong>Latency:</strong> ${item.data.latency}</div>
</div>
`;
}
return 'No information available';
},
},
],
});
graph.render();
```
### trigger - Trigger Mode
Controls the trigger behavior of Tooltip.
**Available values:**
- `hover`: Trigger when mouse enters element (default)
- `click`: Trigger when mouse clicks element
**Example: Click-triggered Tooltip**
```js | ob { inject: true }
import { Graph } from '@antv/g6';
const data = {
nodes: [
{ id: 'node1', style: { x: 100, y: 100 }, data: { name: 'Click me' } },
{ id: 'node2', style: { x: 200, y: 100 }, data: { name: 'Click me too' } },
],
edges: [{ source: 'node1', target: 'node2' }],
};
const graph = new Graph({
container: 'container',
width: 350,
height: 200,
data,
node: {
style: {
labelText: (d) => d.data.name,
},
},
plugins: [
{
type: 'tooltip',
trigger: 'click',
getContent: (e, items) => {
return `
<div>
<div style="color: #0369a1; font-weight: bold; margin-bottom: 4px;">
Click Triggered 🖱️
</div>
<div style="color: #0c4a6e;">
Element ID: ${items[0].id}<br/>
Name: ${items[0].data?.name || 'Unnamed'}
</div>
</div>
`;
},
},
],
});
graph.render();
```
### position - Display Position
Controls the display position of Tooltip relative to mouse position.
**Available values:**
- `top`: Top
- `bottom`: Bottom
- `left`: Left
- `right`: Right
- `top-left`: Top left
- `top-right`: Top right (default)
- `bottom-left`: Bottom left
- `bottom-right`: Bottom right
**Example: Tooltips at different positions**
```js | ob { inject: true }
import { Graph } from '@antv/g6';
const data = {
nodes: [
{ id: 'node1', style: { x: 100, y: 100 }, data: { label: 'TOP' } },
{ id: 'node2', style: { x: 250, y: 100 }, data: { label: 'BOTTOM' } },
{ id: 'node3', style: { x: 100, y: 250 }, data: { label: 'LEFT' } },
{ id: 'node4', style: { x: 250, y: 250 }, data: { label: 'RIGHT' } },
],
};
const graph = new Graph({
container: 'container',
width: 800,
height: 400,
data,
node: { style: { labelText: (d) => d.data.label } },
plugins: [
{
key: 'tooltip-top',
type: 'tooltip',
position: 'top',
enable: (e, items) => items[0].id === 'node1',
getContent: () => `Display at top ⬆️`,
style: {
'.tooltip': {
background: ' #fff2e8',
border: '1px solid #ffa940',
borderRadius: 4,
},
},
},
{
key: 'tooltip-bottom',
type: 'tooltip',
position: 'bottom',
enable: (e, items) => items[0].id === 'node2',
getContent: () => `Display at bottom ⬇️`,
style: {
'.tooltip': {
background: '#f6ffed',
border: '1px solid #73d13d',
borderRadius: 4,
},
},
},
{
key: 'tooltip-left',
type: 'tooltip',
position: 'left',
enable: (e, items) => items[0].id === 'node3',
getContent: () => `Display at left ⬅️`,
style: {
'.tooltip': {
background: '#fff1f0',
border: '1px solid #ff7875',
borderRadius: 4,
},
},
},
{
key: 'tooltip-right',
type: 'tooltip',
position: 'right',
enable: (e, items) => items[0].id === 'node4',
getContent: () => `Display at right ➡️`,
style: {
'.tooltip': {
background: '#f0f5ff',
border: '1px solid #597ef7',
borderRadius: 4,
},
},
},
],
});
graph.render();
```
### offset - Offset
Set the offset for Tooltip display position, with mouse position as the base point.
```js | ob { inject: true }
import { Graph } from '@antv/g6';
const data = {
nodes: [
{ id: 'node1', style: { x: 100, y: 100 }, data: { label: 'Default offset' } },
{ id: 'node2', style: { x: 250, y: 100 }, data: { label: 'Custom offset' } },
],
};
const graph = new Graph({
container: 'container',
width: 800,
height: 200,
data,
plugins: [
{
key: 'tooltip-default',
type: 'tooltip',
enable: (e, items) => items[0].id === 'node1',
getContent: () => `Default offset [10,10]`,
},
{
key: 'tooltip-custom',
type: 'tooltip',
offset: [30, -10], // Offset 30px to the right, 10px up
enable: (e, items) => items[0].id === 'node2',
getContent: () => `Custom offset [30,-10]`,
},
],
});
graph.render();
```
### enterable - Mouse Enterable
Controls whether the mouse pointer can enter the tooltip box, commonly used for scenarios requiring interaction within the Tooltip.
```js | ob { inject: true }
import { Graph } from '@antv/g6';
const data = {
nodes: [
{ id: 'node1', style: { x: 100, y: 100 }, data: { name: 'User A', email: '[email protected]' } },
{ id: 'node2', style: { x: 250, y: 100 }, data: { name: 'User B', email: '[email protected]' } },
],
};
const graph = new Graph({
container: 'container',
width: 400,
height: 200,
data,
plugins: [
{
type: 'tooltip',
enterable: true,
position: 'right',
getContent: (e, items) => {
const item = items[0];
return `
<div>
<h4 style="margin: 0 0 12px 0; color: #333;">User Actions</h4>
<div style="margin-bottom: 8px; color: #666;">
<strong>Name:</strong> ${item.data.name}
</div>
<div style="margin-bottom: 12px; color: #666;">
<strong>Email:</strong> ${item.data.email}
</div>
<div style="display: flex; gap: 8px;">
<button onclick="alert('Send message to ${item.data.name}')"
style="padding: 4px 12px; background: #1890ff; color: white; border: none; border-radius: 4px; cursor: pointer; font-size: 12px;">
Message
</button>
<button onclick="alert('View ${item.data.name} details')"
style="padding: 4px 12px; background: #52c41a; color: white; border: none; border-radius: 4px; cursor: pointer; font-size: 12px;">
Details
</button>
</div>
</div>
`;
},
style: {
'.tooltip': {
background: '#fff',
borderRadius: '8px',
boxShadow: '0 4px 20px rgba(0,0,0,0.15)',
minWidth: '200px',
},
},
},
],
});
graph.render();
```
### style - Style Customization
Customize Tooltip styles.
```js | ob { inject: true }
import { Graph } from '@antv/g6';
const data = {
nodes: [
{ id: 'node1', style: { x: 100, y: 100 }, data: { theme: 'dark', name: 'Dark Theme' } },
{ id: 'node2', style: { x: 250, y: 100 }, data: { theme: 'light', name: 'Light Theme' } },
],
};
const graph = new Graph({
container: 'container',
width: 400,
height: 200,
data,
plugins: [
{
key: 'tooltip-dark',
type: 'tooltip',
enable: (e, items) => items[0].data.theme === 'dark',
style: {
'.tooltip': {
background: '#1f1f1f',
color: '#fff',
border: '1px solid #333',
borderRadius: '8px',
fontSize: '14px',
fontFamily: 'Arial, sans-serif',
boxShadow: '0 4px 20px rgba(0,0,0,0.3)',
},
},
getContent: (e, items) => {
return `<div>🌙 ${items[0].data.name}</div>`;
},
},
{
key: 'tooltip-light',
type: 'tooltip',
enable: (e, items) => items[0].data.theme === 'light',
style: {
'.tooltip': {
background: '#ffffff',
color: '#333',
border: '1px solid #d9d9d9',
borderRadius: '8px',
fontSize: '14px',
fontFamily: 'Arial, sans-serif',
boxShadow: '0 2px 8px rgba(0,0,0,0.15)',
},
},
getContent: (e, items) => {
return `<div>☀️ ${items[0].data.name}</div>`;
},
},
],
});
graph.render();
```
## Practical Examples
- [Basic Tooltip](/en/examples/plugin/tooltip/#basic)
- [Click-triggered Tooltip](/en/examples/plugin/tooltip/#click)
- [Different tooltips for hover and click on the same element](/en/examples/plugin/tooltip/#dual)
- [Custom styled Tooltip](/en/examples/plugin/tooltip/#custom-style)
- [Asynchronous content loading Tooltip](/en/examples/plugin/tooltip/#async)
## API
Plugin Skill
packages/site/docs/manual/plugin/Tooltip.zh.md anthropic-skill ~3,549 tokens---
title: 提示框 Tooltip
order: 16
---
## 概述
Tooltip 插件用于在用户将鼠标悬停或点击图中的元素时,显示额外的信息。它可以帮助用户更好地理解图中的数据,提高交互体验。
## 使用场景
- **详细信息展示**:当用户需要了解元素的详细信息时,使用 Tooltip 提示框来展示这些信息
- **数据可视化辅助**:在数据可视化中,Tooltip 可以显示图表中数据点的详细信息,帮助用户更好地理解数据
- **交互反馈**:为用户的鼠标操作提供即时的视觉反馈
## 基本使用
最简单的 Tooltip 插件配置:
```js
const graph = new Graph({
// 其他配置...
plugins: [
{
type: 'tooltip',
},
],
});
```
## 配置项
| 属性 | 描述 | 类型 | 默认值 | 必选 |
| ------------ | ----------------------- | ------------------------------------------------------------------------------------------------------------------------------- | ------------------------------------- | ---- |
| type | 插件类型 | string | `tooltip` | ✓ |
| key | 标识符 | string | - | |
| position | 气泡框位置 | `top` \| `bottom` \| `left` \| `right` \| `top-left` \| `top-right` \| `bottom-left` \| `bottom-right` | `top-right` | |
| enable | 插件是否启用 | boolean \| ((event: [IElementEvent](/api/event#事件对象属性), items: NodeData \| EdgeData \| ComboData[]) => boolean) | true | |
| getContent | 自定义内容 | (event: [IElementEvent](/api/event#事件对象属性), items: NodeData \| EdgeData \| ComboData[]) => Promise<HTMLElement \| string> | - | |
| onOpenChange | 显示隐藏的回调 | (open: boolean) => void | - | |
| trigger | 触发行为 | `hover` \| `click` | `hover` |
| container | tooltip自定义渲染的容器 | string \| HTMLElement | - | |
| offset | 偏移距离 | [number,number] | [10,10] | |
| enterable | 指针是否可以进入 | boolean | false | |
| title | 标题 | string | - |
| style | 样式对象 | Record<string,any> | {'.tooltip': { visibility: 'hidden'}} | |
## 详细配置说明
### enable - 条件启用
控制插件是否启用,支持传入函数动态调整启用逻辑。
**示例:只对节点启用 Tooltip**
```js | ob { inject: true }
import { Graph } from '@antv/g6';
const data = {
nodes: [
{ id: 'node1', style: { x: 100, y: 100 }, data: { name: '服务器节点' } },
{ id: 'node2', style: { x: 200, y: 100 }, data: { name: '数据库节点' } },
],
edges: [{ source: 'node1', target: 'node2', data: { type: '连接线' } }],
};
const graph = new Graph({
container: 'container',
width: 400,
height: 200,
data,
plugins: [
{
type: 'tooltip',
// 只对节点启用,边不显示tooltip
enable: (e) => e.targetType === 'node',
getContent: (e, items) => {
return `<div>节点: ${items[0].data.name}</div>`;
},
},
],
});
graph.render();
```
### getContent - 自定义内容
自定义渲染 Tooltip 内容,支持返回 HTMLElement 或 string。
**示例:动态渲染自定义 HTML 内容**
```js | ob { inject: true }
import { Graph } from '@antv/g6';
const data = {
nodes: [
{
id: 'node1',
style: { x: 100, y: 100 },
data: { name: '服务器A', type: '应用服务器', status: '运行中', cpu: '45%', memory: '2.1GB' },
},
{
id: 'node2',
style: { x: 250, y: 100 },
data: { name: '数据库B', type: 'MySQL数据库', status: '正常', connections: 23, size: '500MB' },
},
],
edges: [{ source: 'node1', target: 'node2', data: { bandwidth: '1Gbps', latency: '5ms' } }],
};
const graph = new Graph({
container: 'container',
width: 400,
height: 200,
data,
plugins: [
{
type: 'tooltip',
getContent: (e, items) => {
const item = items[0];
if (e.targetType === 'node') {
return `
<div>
<h4 style="margin: 0 0 8px 0; color: #333; border-bottom: 1px solid #eee; padding-bottom: 4px;">
${item.data.name}
</h4>
<div style="margin: 4px 0; color: #666;">
<strong>类型:</strong> ${item.data.type}
</div>
<div style="margin: 4px 0; color: #666;">
<strong>状态:</strong>
<span style="color: ${item.data.status === '运行中' || item.data.status === '正常' ? '#52c41a' : '#ff4d4f'}">
${item.data.status}
</span>
</div>
${item.data.cpu ? `<div style="margin: 4px 0; color: #666;"><strong>CPU:</strong> ${item.data.cpu}</div>` : ''}
${item.data.memory ? `<div style="margin: 4px 0; color: #666;"><strong>内存:</strong> ${item.data.memory}</div>` : ''}
${item.data.connections ? `<div style="margin: 4px 0; color: #666;"><strong>连接数:</strong> ${item.data.connections}</div>` : ''}
${item.data.size ? `<div style="margin: 4px 0; color: #666;"><strong>大小:</strong> ${item.data.size}</div>` : ''}
</div>
`;
} else if (e.targetType === 'edge') {
return `
<div>
<h4 style="margin: 0 0 8px 0; color: #333;">连接信息</h4>
<div style="margin: 4px 0; color: #666;"><strong>带宽:</strong> ${item.data.bandwidth}</div>
<div style="margin: 4px 0; color: #666;"><strong>延迟:</strong> ${item.data.latency}</div>
</div>
`;
}
return '暂无信息';
},
},
],
});
graph.render();
```
### trigger - 触发方式
控制 Tooltip 的触发行为。
**可选值:**
- `hover`:鼠标移入元素时触发(默认)
- `click`:鼠标点击元素时触发
**示例:点击触发 Tooltip**
```js | ob { inject: true }
import { Graph } from '@antv/g6';
const data = {
nodes: [
{ id: 'node1', style: { x: 100, y: 100 }, data: { name: '点击我' } },
{ id: 'node2', style: { x: 200, y: 100 }, data: { name: '也点击我' } },
],
edges: [{ source: 'node1', target: 'node2' }],
};
const graph = new Graph({
container: 'container',
width: 350,
height: 200,
data,
node: {
style: {
labelText: (d) => d.data.name,
},
},
plugins: [
{
type: 'tooltip',
trigger: 'click',
getContent: (e, items) => {
return `
<div>
<div style="color: #0369a1; font-weight: bold; margin-bottom: 4px;">
点击触发 🖱️
</div>
<div style="color: #0c4a6e;">
元素ID: ${items[0].id}<br/>
名称: ${items[0].data?.name || '未命名'}
</div>
</div>
`;
},
},
],
});
graph.render();
```
### position - 显示位置
控制 Tooltip 相对于鼠标位置的显示位置。
**可选值:**
- `top`: 顶部
- `bottom`: 底部
- `left`: 左侧
- `right`: 右侧
- `top-left`: 顶部靠左
- `top-right`: 顶部靠右(默认)
- `bottom-left`: 底部靠左
- `bottom-right`: 底部靠右
**示例:不同位置的 Tooltip**
```js | ob { inject: true }
import { Graph } from '@antv/g6';
const data = {
nodes: [
{ id: 'node1', style: { x: 100, y: 100 }, data: { label: 'TOP' } },
{ id: 'node2', style: { x: 250, y: 100 }, data: { label: 'BOTTOM' } },
{ id: 'node3', style: { x: 100, y: 250 }, data: { label: 'LEFT' } },
{ id: 'node4', style: { x: 250, y: 250 }, data: { label: 'RIGHT' } },
],
};
const graph = new Graph({
container: 'container',
width: 800,
height: 400,
data,
node: { style: { labelText: (d) => d.data.label } },
plugins: [
{
key: 'tooltip-top',
type: 'tooltip',
position: 'top',
enable: (e, items) => items[0].id === 'node1',
getContent: () => `顶部显示 ⬆️`,
style: {
'.tooltip': {
background: ' #fff2e8',
border: '1px solid #ffa940',
borderRadius: 4,
},
},
},
{
key: 'tooltip-bottom',
type: 'tooltip',
position: 'bottom',
enable: (e, items) => items[0].id === 'node2',
getContent: () => `底部显示 ⬇️`,
style: {
'.tooltip': {
background: '#f6ffed',
border: '1px solid #73d13d',
borderRadius: 4,
},
},
},
{
key: 'tooltip-left',
type: 'tooltip',
position: 'left',
enable: (e, items) => items[0].id === 'node3',
getContent: () => `左侧显示 ⬅️`,
style: {
'.tooltip': {
background: '#fff1f0',
border: '1px solid #ff7875',
borderRadius: 4,
},
},
},
{
key: 'tooltip-right',
type: 'tooltip',
position: 'right',
enable: (e, items) => items[0].id === 'node4',
getContent: () => `右侧显示 ➡️`,
style: {
'.tooltip': {
background: '#f0f5ff',
border: '1px solid #597ef7',
borderRadius: 4,
},
},
},
],
});
graph.render();
```
### offset - 偏移量
设置 Tooltip 显示位置的偏移量,以鼠标位置为基点。
```js | ob { inject: true }
import { Graph } from '@antv/g6';
const data = {
nodes: [
{ id: 'node1', style: { x: 100, y: 100 }, data: { label: '默认偏移' } },
{ id: 'node2', style: { x: 250, y: 100 }, data: { label: '自定义偏移' } },
],
};
const graph = new Graph({
container: 'container',
width: 800,
height: 200,
data,
plugins: [
{
key: 'tooltip-default',
type: 'tooltip',
enable: (e, items) => items[0].id === 'node1',
getContent: () => `默认偏移 [10,10]`,
},
{
key: 'tooltip-custom',
type: 'tooltip',
offset: [30, -10], // 向右偏移30px,向上偏移10px
enable: (e, items) => items[0].id === 'node2',
getContent: () => `自定义偏移 [30,-10]`,
},
],
});
graph.render();
```
### enterable - 鼠标可进入
控制鼠标指针是否可以进入气泡框,常用于需要在 Tooltip 内进行交互的场景。
```js | ob { inject: true }
import { Graph } from '@antv/g6';
const data = {
nodes: [
{ id: 'node1', style: { x: 100, y: 100 }, data: { name: '用户A', email: '[email protected]' } },
{ id: 'node2', style: { x: 250, y: 100 }, data: { name: '用户B', email: '[email protected]' } },
],
};
const graph = new Graph({
container: 'container',
width: 400,
height: 200,
data,
plugins: [
{
type: 'tooltip',
enterable: true,
position: 'right',
getContent: (e, items) => {
const item = items[0];
return `
<div>
<h4 style="margin: 0 0 12px 0; color: #333;">用户操作</h4>
<div style="margin-bottom: 8px; color: #666;">
<strong>姓名:</strong> ${item.data.name}
</div>
<div style="margin-bottom: 12px; color: #666;">
<strong>邮箱:</strong> ${item.data.email}
</div>
<div style="display: flex; gap: 8px;">
<button onclick="alert('发送消息给 ${item.data.name}')"
style="padding: 4px 12px; background: #1890ff; color: white; border: none; border-radius: 4px; cursor: pointer; font-size: 12px;">
发消息
</button>
<button onclick="alert('查看 ${item.data.name} 的详情')"
style="padding: 4px 12px; background: #52c41a; color: white; border: none; border-radius: 4px; cursor: pointer; font-size: 12px;">
详情
</button>
</div>
</div>
`;
},
style: {
'.tooltip': {
background: '#fff',
borderRadius: '8px',
boxShadow: '0 4px 20px rgba(0,0,0,0.15)',
minWidth: '200px',
},
},
},
],
});
graph.render();
```
### style - 样式自定义
自定义 Tooltip 的样式。
```js | ob { inject: true }
import { Graph } from '@antv/g6';
const data = {
nodes: [
{ id: 'node1', style: { x: 100, y: 100 }, data: { theme: 'dark', name: '深色主题' } },
{ id: 'node2', style: { x: 250, y: 100 }, data: { theme: 'light', name: '浅色主题' } },
],
};
const graph = new Graph({
container: 'container',
width: 400,
height: 200,
data,
plugins: [
{
key: 'tooltip-dark',
type: 'tooltip',
enable: (e, items) => items[0].data.theme === 'dark',
style: {
'.tooltip': {
background: '#1f1f1f',
color: '#fff',
border: '1px solid #333',
borderRadius: '8px',
fontSize: '14px',
fontFamily: 'Arial, sans-serif',
boxShadow: '0 4px 20px rgba(0,0,0,0.3)',
},
},
getContent: (e, items) => {
return `<div>🌙 ${items[0].data.name}</div>`;
},
},
{
key: 'tooltip-light',
type: 'tooltip',
enable: (e, items) => items[0].data.theme === 'light',
style: {
'.tooltip': {
background: '#ffffff',
color: '#333',
border: '1px solid #d9d9d9',
borderRadius: '8px',
fontSize: '14px',
fontFamily: 'Arial, sans-serif',
boxShadow: '0 2px 8px rgba(0,0,0,0.15)',
},
},
getContent: (e, items) => {
return `<div>☀️ ${items[0].data.name}</div>`;
},
},
],
});
graph.render();
```
## 实际案例
- [基础提示框](/examples/plugin/tooltip/#basic)
- [点击触发 Tooltip](/examples/plugin/tooltip/#click)
- [鼠标移入和点击同一元素时显示不同的提示框](/examples/plugin/tooltip/#dual)
- [自定义样式的 Tooltip](/examples/plugin/tooltip/#custom-style)
- [异步加载内容的 Tooltip](/examples/plugin/tooltip/#async)
Plugin Skill
packages/site/docs/manual/plugin/Watermark.en.md anthropic-skill ~2,348 tokens---
title: Watermark
order: 17
---
## Overview
The watermark plugin supports using text and images as watermarks. The principle is to add a `background-image` attribute to the div of the Graph container, and then control the position and style of the watermark through CSS. For text watermarks, a hidden canvas is used to convert the text into an image.
## Use Cases
- Add copyright or ownership marks to charts
- Mark the status of charts during presentations or previews
- Add anti-leakage marks to sensitive data
## Basic Usage
Below is a simple example of initializing the Watermark plugin:
```js
const graph = new Graph({
plugins: [
{
type: 'watermark',
text: 'G6 Graph', // Watermark text
opacity: 0.2, // Opacity
rotate: Math.PI / 12, // Rotation angle
},
],
});
```
## Online Experience
<embed src="@/common/api/plugins/watermark.md"></embed>
## Configuration Options
| Property | Description | Type | Default Value | Required |
| -------------------- | -------------------------------------------------------- | --------------------------------------------------------------------------- | ------------- | -------- |
| type | Plugin type | string | `watermark` | ✓ |
| width | Width of a single watermark | number | 200 | |
| height | Height of a single watermark | number | 100 | |
| opacity | Opacity of the watermark | number | 0.2 | |
| rotate | Rotation angle of the watermark | number | Math.PI / 12 | |
| imageURL | Image watermark URL, higher priority than text watermark | string | - | |
| text | Watermark text content | string | - | |
| textFill | Color of the text watermark | string | `#000` | |
| textFontSize | Font size of the text watermark | number | 16 | |
| textFontFamily | Font of the text watermark | string | - | |
| textFontWeight | Font weight of the text watermark | string | - | |
| textFontVariant | Font variant of the text watermark | string | - | |
| textAlign | Text alignment of the watermark | `center` \| `end` \| `left` \| `right` \| `start` | `center` | |
| textBaseline | Baseline alignment of the text watermark | `alphabetic` \| `bottom` \| `hanging` \| `ideographic` \| `middle` \| `top` | `middle` | |
| backgroundRepeat | Repeat mode of the watermark | string | `repeat` | |
| backgroundAttachment | Background attachment behavior of the watermark | string | - | |
| backgroundBlendMode | Background blend mode of the watermark | string | - | |
| backgroundClip | Background clip of the watermark | string | - | |
| backgroundColor | Background color of the watermark | string | - | |
| backgroundImage | Background image of the watermark | string | - | |
| backgroundOrigin | Background origin of the watermark | string | - | |
| backgroundPosition | Background position of the watermark | string | - | |
| backgroundPositionX | Horizontal position of the watermark background | string | - | |
| backgroundPositionY | Vertical position of the watermark background | string | - | |
| backgroundSize | Background size of the watermark | string | - | |
## Code Examples
### Text Watermark
The simplest text watermark configuration:
```js
const graph = new Graph({
plugins: [
{
type: 'watermark',
text: 'G6 Graph',
},
],
});
```
```js | ob { inject: true }
import { Graph } from '@antv/g6';
const data = {
nodes: [{ id: 'node-0' }, { id: 'node-1' }, { id: 'node-2' }, { id: 'node-3' }, { id: 'node-4' }, { id: 'node-5' }],
edges: [
{ source: 'node-0', target: 'node-1' },
{ source: 'node-0', target: 'node-2' },
{ source: 'node-0', target: 'node-3' },
{ source: 'node-0', target: 'node-4' },
{ source: 'node-1', target: 'node-0' },
{ source: 'node-2', target: 'node-0' },
{ source: 'node-3', target: 'node-0' },
{ source: 'node-4', target: 'node-0' },
{ source: 'node-5', target: 'node-0' },
],
};
const graph = new Graph({
container: 'container',
data,
layout: { type: 'grid' },
behaviors: ['zoom-canvas', 'drag-canvas', 'drag-element'],
plugins: [
{
type: 'watermark',
text: 'G6: Graph Visualization',
textFontSize: 14,
textFontFamily: 'Microsoft YaHei',
fill: 'rgba(0, 0, 0, 0.1)',
rotate: Math.PI / 12,
},
],
});
graph.render();
```
### Image Watermark
Use an image as a watermark:
```js
const graph = new Graph({
plugins: [
{
type: 'watermark',
imageURL: 'https://example.com/logo.png',
width: 100,
height: 50,
opacity: 0.1,
},
],
});
```
```js | ob { inject: true }
import { Graph } from '@antv/g6';
const data = {
nodes: [{ id: 'node-0' }, { id: 'node-1' }, { id: 'node-2' }, { id: 'node-3' }, { id: 'node-4' }, { id: 'node-5' }],
edges: [
{ source: 'node-0', target: 'node-1' },
{ source: 'node-0', target: 'node-2' },
{ source: 'node-0', target: 'node-3' },
{ source: 'node-0', target: 'node-4' },
{ source: 'node-1', target: 'node-0' },
{ source: 'node-2', target: 'node-0' },
{ source: 'node-3', target: 'node-0' },
{ source: 'node-4', target: 'node-0' },
{ source: 'node-5', target: 'node-0' },
],
};
const graph = new Graph({
container: 'container',
data,
layout: {
type: 'grid',
},
behaviors: ['zoom-canvas', 'drag-canvas', 'drag-element'],
plugins: [
{
type: 'watermark',
width: 200,
height: 100,
rotate: Math.PI / 12,
imageURL: 'https://gw.alipayobjects.com/os/s/prod/antv/assets/image/logo-with-text-73b8a.svg',
},
],
});
graph.render();
```
### Custom Styles
You can customize the style and position of the watermark:
```js
const graph = new Graph({
plugins: [
{
type: 'watermark',
text: 'G6 Graph',
textFontSize: 20, // Set font size
textFontFamily: 'Arial', // Set font
textFontWeight: 'bold', // Set font weight
textFill: '#1890ff', // Set text color
rotate: Math.PI / 6, // Set rotation angle
opacity: 0.15, // Set opacity
width: 180, // Set watermark width
height: 100, // Set watermark height
backgroundRepeat: 'space', // Set repeat mode
backgroundPosition: 'center', // Set position
textAlign: 'center', // Set text alignment
textBaseline: 'middle', // Set baseline alignment
},
],
});
```
## Real Cases
- [Text Watermark](/examples/plugin/watermark/#text)
- [Image Watermark](/examples/plugin/watermark/#repeat)
Plugin Skill
packages/site/docs/manual/plugin/Watermark.zh.md anthropic-skill ~1,945 tokens---
title: 水印 Watermark
order: 17
---
## 概述
水印插件支持使用文本和图片作为水印,实现原理是在 Graph 容器的 div 上加上 `background-image` 属性,然后通过 CSS 来控制水印的位置和样式。对于文本水印,会使用隐藏 canvas 将文本转换为图片的方式来实现。
## 使用场景
- 为图表添加版权或所有权标识
- 在演示或预览时标记图表的状态
- 为敏感数据添加防泄露标记
## 基本用法
以下是一个简单的 Watermark 插件初始化示例:
```js
const graph = new Graph({
plugins: [
{
type: 'watermark',
text: 'G6 Graph', // 水印文本
opacity: 0.2, // 透明度
rotate: Math.PI / 12, // 旋转角度
},
],
});
```
## 在线体验
<embed src="@/common/api/plugins/watermark.md"></embed>
## 配置项
| 属性 | 描述 | 类型 | 默认值 | 必选 |
| -------------------- | ---------------------------------- | --------------------------------------------------------------------------- | ------------ | ---- |
| type | 插件类型 | string | `watermark` | ✓ |
| width | 单个水印的宽度 | number | 200 | |
| height | 单个水印的高度 | number | 100 | |
| opacity | 水印的透明度 | number | 0.2 | |
| rotate | 水印的旋转角度 | number | Math.PI / 12 | |
| imageURL | 图片水印的地址,优先级高于文本水印 | string | - | |
| text | 水印文本内容 | string | - | |
| textFill | 文本水印的颜色 | string | `#000` | |
| textFontSize | 文本水印的字体大小 | number | 16 | |
| textFontFamily | 文本水印的字体 | string | - | |
| textFontWeight | 文本水印的字体粗细 | string | - | |
| textFontVariant | 文本水印的字体变体 | string | - | |
| textAlign | 文本水印的对齐方式 | `center` \| `end` \| `left` \| `right` \| `start` | `center` | |
| textBaseline | 文本水印的基线对齐方式 | `alphabetic` \| `bottom` \| `hanging` \| `ideographic` \| `middle` \| `top` | `middle` | |
| backgroundRepeat | 水印的重复方式 | string | `repeat` | |
| backgroundAttachment | 水印的背景定位行为 | string | - | |
| backgroundBlendMode | 水印的背景混合模式 | string | - | |
| backgroundClip | 水印的背景裁剪 | string | - | |
| backgroundColor | 水印的背景颜色 | string | - | |
| backgroundImage | 水印的背景图片 | string | - | |
| backgroundOrigin | 水印的背景原点 | string | - | |
| backgroundPosition | 水印的背景位置 | string | - | |
| backgroundPositionX | 水印的背景水平位置 | string | - | |
| backgroundPositionY | 水印的背景垂直位置 | string | - | |
| backgroundSize | 水印的背景大小 | string | - | |
## 代码示例
### 文本水印
最简单的文本水印配置:
```js
const graph = new Graph({
plugins: [
{
type: 'watermark',
text: 'G6 Graph',
},
],
});
```
```js | ob { inject: true }
import { Graph } from '@antv/g6';
const data = {
nodes: [{ id: 'node-0' }, { id: 'node-1' }, { id: 'node-2' }, { id: 'node-3' }, { id: 'node-4' }, { id: 'node-5' }],
edges: [
{ source: 'node-0', target: 'node-1' },
{ source: 'node-0', target: 'node-2' },
{ source: 'node-0', target: 'node-3' },
{ source: 'node-0', target: 'node-4' },
{ source: 'node-1', target: 'node-0' },
{ source: 'node-2', target: 'node-0' },
{ source: 'node-3', target: 'node-0' },
{ source: 'node-4', target: 'node-0' },
{ source: 'node-5', target: 'node-0' },
],
};
const graph = new Graph({
container: 'container',
data,
layout: { type: 'grid' },
behaviors: ['zoom-canvas', 'drag-canvas', 'drag-element'],
plugins: [
{
type: 'watermark',
text: 'G6: Graph Visualization',
textFontSize: 14,
textFontFamily: 'Microsoft YaHei',
fill: 'rgba(0, 0, 0, 0.1)',
rotate: Math.PI / 12,
},
],
});
graph.render();
```
### 图片水印
使用图片作为水印:
```js
const graph = new Graph({
plugins: [
{
type: 'watermark',
imageURL: 'https://example.com/logo.png',
width: 100,
height: 50,
opacity: 0.1,
},
],
});
```
```js | ob { inject: true }
import { Graph } from '@antv/g6';
const data = {
nodes: [{ id: 'node-0' }, { id: 'node-1' }, { id: 'node-2' }, { id: 'node-3' }, { id: 'node-4' }, { id: 'node-5' }],
edges: [
{ source: 'node-0', target: 'node-1' },
{ source: 'node-0', target: 'node-2' },
{ source: 'node-0', target: 'node-3' },
{ source: 'node-0', target: 'node-4' },
{ source: 'node-1', target: 'node-0' },
{ source: 'node-2', target: 'node-0' },
{ source: 'node-3', target: 'node-0' },
{ source: 'node-4', target: 'node-0' },
{ source: 'node-5', target: 'node-0' },
],
};
const graph = new Graph({
container: 'container',
data,
layout: {
type: 'grid',
},
behaviors: ['zoom-canvas', 'drag-canvas', 'drag-element'],
plugins: [
{
type: 'watermark',
width: 200,
height: 100,
rotate: Math.PI / 12,
imageURL: 'https://gw.alipayobjects.com/os/s/prod/antv/assets/image/logo-with-text-73b8a.svg',
},
],
});
graph.render();
```
### 自定义样式
可以自定义水印的样式和位置:
```js
const graph = new Graph({
plugins: [
{
type: 'watermark',
text: 'G6 Graph',
textFontSize: 20, // 设置字体大小
textFontFamily: 'Arial', // 设置字体
textFontWeight: 'bold', // 设置字体粗细
textFill: '#1890ff', // 设置文字颜色
rotate: Math.PI / 6, // 设置旋转角度
opacity: 0.15, // 设置透明度
width: 180, // 设置水印宽度
height: 100, // 设置水印高度
backgroundRepeat: 'space', // 设置重复方式
backgroundPosition: 'center', // 设置位置
textAlign: 'center', // 设置文本对齐
textBaseline: 'middle', // 设置基线对齐
},
],
});
```
## 实际案例
- [文本水印](/examples/plugin/watermark/#text)
- [图片水印](/examples/plugin/watermark/#repeat)
Theme Skill
packages/site/docs/manual/theme/custom-palette.en.md anthropic-skill ~485 tokens---
title: Custom Palette
order: 4
---
## Overview
[Core Concepts - Palette](/en/manual/core-concept/palette) mentions that G6 supports discrete palettes and continuous palettes. A discrete palette is essentially an array of colors, while a continuous palette is a color interpolator.
Therefore, customizing a palette also adopts these two methods, and the following sections will introduce how to customize discrete and continuous palettes, respectively.
## Implement Palette
### Discrete Palette
You can simply define a string array that contains color values. Supported color values include: RGB color values, hexadecimal color values, and color names. Below is an example of a discrete palette:
```typescript
const hex = ['#FF0000', '#00FF00', '#0000FF'];
const color = ['red', 'green', 'blue'];
const rgb = ['rgb(255, 0, 0)', 'rgb(0, 255, 0)', 'rgb(0, 0, 255)'];
```
### Continuous Palette
A continuous palette requires the definition of a color interpolator. The interpolator is a function that accepts a numerical value as a parameter and returns a color value. Below is an example of a continuous palette:
```typescript
const color = (value: number) => `rgb(${value * 255}, 0, 0)`;
```
## Register Palette
You can register a palette using the `register` method provided by G6. For more details, please refer to [Register Palette](/en/manual/core-concept/palette#register-palette)
## Use Without Registration
In addition to registration, you can also bypass the registration mechanism and directly pass the palette value at the location where the palette is needed, for example:
```typescript
{
node: {
palette: {
type: 'group',
field: 'category',
color: ['#5B8FF9', '#61DDAA', '#F6BD16'], // Pass in a color array.
}
},
edge: {
palette: {
type: 'value',
field: 'value',
color: (value) => `rgb(${value * 255}, 0, 0)`, // Pass in an interpolator
}
}
}
```
Theme Skill
packages/site/docs/manual/theme/custom-palette.zh.md anthropic-skill ~246 tokens---
title: 自定义色板
order: 4
---
## 概述
[色板](/manual/theme/palette) 中提到,G6 支持离散色板和连续色板,其中离散色板本质上是一个颜色数组,而连续色板是一个颜色插值器。
因此自定义色板也采用这两种方式,下面分别介绍如何自定义离散色板和连续色板。
## 实现色板
### 离散色板
直接定义一个包含颜色值的字符串数组即可,颜值值支持:RGB 色值、16 进制、颜色名,下面是一组离散色板示例:
```typescript
const hex = ['#FF0000', '#00FF00', '#0000FF'];
const color = ['red', 'green', 'blue'];
const rgb = ['rgb(255, 0, 0)', 'rgb(0, 255, 0)', 'rgb(0, 0, 255)'];
```
### 连续色板
连续色板需要定义一个颜色插值器,插值器是一个函数,接受一个数值参数,返回一个颜色值,下面是一个连续色板示例:
```typescript
const color = (value: number) => `rgb(${value * 255}, 0, 0)`;
```
## 注册色板
通过 G6 提供的 register 方法注册即可,详见[注册色板](/manual/theme/palette#注册色板)
## 非注册方式使用
除此之外,你也可以在需要使用色板的位置跳过注册机制直接传入色板值,例如:
```typescript
{
node: {
palette: {
type: 'group',
field: 'category',
color: ['#5B8FF9', '#61DDAA', '#F6BD16'], // 传入颜色数组
}
},
edge: {
palette: {
type: 'value',
field: 'value',
color: (value) => `rgb(${value * 255}, 0, 0)`, // 传入插值器
}
}
}
```
Theme Skill
packages/site/docs/manual/theme/custom-theme.en.md anthropic-skill ~550 tokens---
title: Custom Theme
order: 2
---
## Overview
In G6, the theme is a subset of Graph Options and includes configurations related to the canvas and element styles. A theme can help you quickly switch between different graph styles.
## Custom Theme
For element styles, the configurations within a theme are static and do not support the use of callback functions to dynamically calculate styles. Additionally, `type` is also not supported for configuration within a theme. A theme includes the following configurations:
- `background`: Canvas background color
- `node`: Node style
- `edge`: Edge style
- `combo`: Combo style
Below is a simple example of a theme configuration:
```typescript
const theme = {
background: '#fff',
node: {
style: {
fill: '#e1f3fe',
lineWidth: 0,
},
selected: {
style: {
fill: '#3b71d6',
lineWidth: 1,
},
},
},
edge: {
// ...
},
combo: {
// ...
},
};
```
❌ Incorrect Example
```typescript
const theme = {
node: {
// ❌ The theme does not support configuring element types
type: 'rect',
style: {
// ❌ The theme does not support callback functions
fill: (d) => d.style.color,
},
},
};
```
:::warning{title=Note}
For element state styles, please ensure that every property in the state style has a corresponding default style in the default style, otherwise it may result in the inability to clear the state style.
:::
## Register Theme
You can register a theme using the `register` method provided by G6. Here is an example:
```typescript
import { register, ExtensionCategory } from '@antv/g6';
register(ExtensionCategory.THEME, 'custom-theme', theme);
```
## Configure Theme
To enable and configure a theme, you need to pass the `theme` option when instantiating the `Graph`:
```typescript
{
theme: 'custom-theme',
}
```
### Switch Theme
After the `Graph` instance is created, you can switch themes by using the [setTheme](/en/api/theme#graphsetthemetheme) method:
```typescript
graph.setTheme('dark');
```
Additionally, you can also obtain the current theme by using the `getTheme` method:
```typescript
graph.getTheme();
// => 'dark'
```
Theme Skill
packages/site/docs/manual/theme/custom-theme.zh.md anthropic-skill ~469 tokens---
title: 自定义主题
order: 2
---
除了使用内置主题外,G6 还支持创建自定义主题来满足特定的视觉需求。本文将介绍如何创建和使用自定义主题。
## 创建自定义主题
一个自定义主题需要遵循主题的基本结构,包含画布背景色和元素样式配置:
```javascript
const customTheme = {
// 1. 画布背景色
background: '#f0f0f0',
// 2. 节点配置
node: {
// 调色板配置
palette: {
type: 'group',
color: ['#1783FF', '#00C9C9' /* 自定义颜色... */],
},
// 基础样式
style: {
fill: '#fff',
stroke: '#d9d9d9',
lineWidth: 1,
// ... 其他节点样式
},
// 状态样式
state: {
selected: {
fill: '#e8f3ff',
stroke: '#1783FF',
},
// ... 其他状态样式
},
},
// 3. 边配置
edge: {
style: {
stroke: '#d9d9d9',
lineWidth: 1,
// ... 其他边样式
},
state: {
// ... 状态样式
},
},
// 4. Combo 配置
combo: {
style: {
fill: '#f7f7f7',
stroke: '#d9d9d9',
// ... 其他 Combo 样式
},
state: {
// ... 状态样式
},
},
};
```
## 使用限制
在创建自定义主题时,需要注意以下限制:
1. **仅支持静态值**
```javascript
// ❌ 错误示例:不支持回调函数
const theme = {
node: {
style: {
fill: (d) => d.style.color,
},
},
};
```
2. **不支持配置元素类型**
```javascript
// ❌ 错误示例:不支持在主题中配置元素类型
const theme = {
node: {
type: 'rect',
style: {
fill: '#fff',
},
},
};
```
3. **状态样式需要对应默认样式**
```javascript
// ✅ 正确示例:状态样式的属性在默认样式中都有定义
const theme = {
node: {
style: {
fill: '#fff',
stroke: '#000',
},
state: {
selected: {
fill: '#e8f3ff',
stroke: '#1783FF',
},
},
},
};
```
## 应用自定义主题
先注册主题,然后通过名称引用:
```javascript
// 1. 注册主题
import { register, ExtensionCategory } from '@antv/g6';
register(ExtensionCategory.THEME, 'custom-theme', customTheme);
// 2. 使用主题
const graph = new Graph({
theme: 'custom-theme',
// ... 其他配置
});
```
Theme Skill
packages/site/docs/manual/theme/overview.en.md anthropic-skill ~13 tokens---
title: Theme Overview
order: 1
---
## Overview
Theme Skill
packages/site/docs/manual/theme/overview.zh.md anthropic-skill ~3,498 tokens---
title: 主题总览
order: 1
---
## 概述
G6 中的主题是 Graph Options 的子集,它包含了关于画布和元素样式的配置。多主题可以帮助你快速地切换不同的图样式。
<image width="350" src="https://mdn.alipayobjects.com/huamei_qa8qxu/afts/img/A*gASzQbsbAaIAAAAAAAAAAAAADmJ7AQ/original"></image>
## 主题结构
一个主题由以下四个部分组成:
1. **画布背景色 (background)**
- 控制整个画布的背景颜色
2. **节点配置 (node)**
- 基础样式:填充色、描边、标签等静态视觉属性
- [调色板](/manual/theme/palette):用于节点分组的颜色配置
- 状态样式:不同状态下的样式配置(选中、激活、禁用等)
- 动画配置:节点的动画效果配置
3. **边配置 (edge)**
- 基础样式:线条样式、箭头、标签等静态视觉属性
- [调色板](/manual/theme/palette):用于边分组的颜色配置
- 状态样式:不同状态下的样式配置
- 动画配置:边的动画效果配置
4. **Combo 配置 (combo)**
- 基础样式:填充、描边、折叠按钮等静态视觉属性
- 状态样式:不同状态下的样式配置
- 动画配置:Combo 的动画效果配置
> 注意:主题中的样式配置仅支持静态值,不支持回调函数形式的动态配置。如需动态样式,请使用图的配置项。
## 内置主题
G6 默认提供两种内置主题:
### 亮色主题(默认)
<img width="300" src="https://mdn.alipayobjects.com/huamei_qa8qxu/afts/img/A*SPCES62UzzAAAAAAAAAAAAAAemJ7AQ/original" alt="亮色主题" />
<details><summary>查看亮色主题完整配置项</summary>
```js
const lightTheme = {
background: '#ffffff',
node: {
palette: {
type: 'group',
color: [
'#1783FF',
'#00C9C9',
'#F08F56',
'#D580FF',
'#7863FF',
'#DB9D0D',
'#60C42D',
'#FF80CA',
'#2491B3',
'#17C76F',
],
},
style: {
donutOpacity: 1,
badgeBackgroundOpacity: 1,
badgeFill: '#fff',
badgeFontSize: 8,
badgePadding: [0, 4],
badgePalette: ['#7E92B5', '#F4664A', '#FFBE3A'],
fill: '#1783ff',
fillOpacity: 1,
halo: false,
iconFill: '#fff',
iconOpacity: 1,
labelBackground: false,
labelBackgroundFill: '#ffffff',
labelBackgroundLineWidth: 0,
labelBackgroundOpacity: 0.75,
labelFill: '#000000',
labelFillOpacity: 0.85,
labelLineHeight: 16,
labelPadding: [0, 2],
labelFontSize: 12,
labelFontWeight: 400,
labelOpacity: 1,
labelOffsetY: 2,
lineWidth: 0,
portFill: '#1783ff',
portLineWidth: 1,
portStroke: '#000000',
portStrokeOpacity: 0.65,
size: 32,
stroke: '#000000',
strokeOpacity: 1,
zIndex: 2,
},
state: {
selected: {
halo: true,
haloLineWidth: 24,
haloStrokeOpacity: 0.25,
labelFontSize: 12,
labelFontWeight: 'bold',
lineWidth: 4,
stroke: '#000000',
},
active: {
halo: true,
haloLineWidth: 12,
haloStrokeOpacity: 0.15,
},
highlight: {
labelFontWeight: 'bold',
lineWidth: 4,
stroke: '#000000',
strokeOpacity: 0.85,
},
inactive: {
badgeBackgroundOpacity: 0.25,
donutOpacity: 0.25,
fillOpacity: 0.25,
iconOpacity: 0.85,
labelFill: '#000000',
labelFillOpacity: 0.25,
strokeOpacity: 0.25,
},
disabled: {
badgeBackgroundOpacity: 0.25,
donutOpacity: 0.06,
fill: '#1B324F',
fillOpacity: 0.06,
iconFill: '#1B324F',
iconOpacity: 0.25,
labelFill: '#000000',
labelFillOpacity: 0.25,
strokeOpacity: 0.06,
},
},
animation: {
enter: 'fade',
exit: 'fade',
show: 'fade',
hide: 'fade',
expand: 'node-expand',
collapse: 'node-collapse',
update: [{ fields: ['x', 'y', 'fill', 'stroke'] }],
translate: [{ fields: ['x', 'y'] }],
},
},
edge: {
palette: {
type: 'group',
color: [
'#99ADD1',
'#1783FF',
'#00C9C9',
'#F08F56',
'#D580FF',
'#7863FF',
'#DB9D0D',
'#60C42D',
'#FF80CA',
'#2491B3',
'#17C76F',
],
},
style: {
badgeBackgroundFill: '#99ADD1',
badgeFill: '#fff',
badgeFontSize: 8,
badgeOffsetX: 10,
fillOpacity: 1,
halo: false,
haloLineWidth: 12,
haloStrokeOpacity: 1,
increasedLineWidthForHitTesting: 2,
labelBackground: false,
labelBackgroundFill: '#ffffff',
labelBackgroundLineWidth: 0,
labelBackgroundOpacity: 0.75,
labelBackgroundPadding: [4, 4, 4, 4],
labelFill: '#000000',
labelFontSize: 12,
labelFontWeight: 400,
labelOpacity: 1,
labelPlacement: 'center',
labelTextBaseline: 'middle',
lineWidth: 1,
stroke: '#99ADD1',
strokeOpacity: 1,
zIndex: 1,
},
state: {
selected: {
halo: true,
haloStrokeOpacity: 0.25,
labelFontSize: 14,
labelFontWeight: 'bold',
lineWidth: 3,
},
active: {
halo: true,
haloStrokeOpacity: 0.15,
},
highlight: {
labelFontWeight: 'bold',
lineWidth: 3,
},
inactive: {
stroke: '#1B324F',
fillOpacity: 0.08,
labelOpacity: 0.25,
strokeOpacity: 0.08,
badgeBackgroundOpacity: 0.25,
},
disabled: {
stroke: '#d9d9d9',
fillOpacity: 0.45,
strokeOpacity: 0.45,
labelOpacity: 0.25,
badgeBackgroundOpacity: 0.45,
},
},
animation: {
enter: 'fade',
exit: 'fade',
expand: 'path-in',
collapse: 'path-out',
show: 'fade',
hide: 'fade',
update: [{ fields: ['sourceNode', 'targetNode'] }, { fields: ['stroke'], shape: 'key' }],
translate: [{ fields: ['sourceNode', 'targetNode'] }],
},
},
combo: {
style: {
collapsedMarkerFill: '#ffffff',
collapsedMarkerFontSize: 12,
collapsedMarkerFillOpacity: 1,
collapsedSize: 32,
collapsedFillOpacity: 1,
fill: '#99ADD1',
halo: false,
haloLineWidth: 12,
haloStroke: '#99ADD1',
haloStrokeOpacity: 0.25,
labelBackground: false,
labelBackgroundFill: '#ffffff',
labelBackgroundLineWidth: 0,
labelBackgroundOpacity: 0.75,
labelBackgroundPadding: [2, 4, 2, 4],
labelFill: '#000000',
labelFontSize: 12,
labelFontWeight: 400,
labelOpacity: 1,
lineDash: 0,
lineWidth: 1,
fillOpacity: 0.04,
strokeOpacity: 1,
padding: 10,
stroke: '#99ADD1',
},
state: {
selected: {
halo: true,
labelFontSize: 14,
labelFontWeight: 700,
lineWidth: 4,
},
active: {
halo: true,
},
highlight: {
labelFontWeight: 700,
lineWidth: 4,
},
inactive: {
fillOpacity: 0.65,
labelOpacity: 0.25,
strokeOpacity: 0.65,
},
disabled: {
fill: '#d9d9d9',
fillOpacity: 0.25,
labelOpacity: 0.25,
stroke: '#d9d9d9',
strokeOpacity: 0.25,
},
},
animation: {
enter: 'fade',
exit: 'fade',
show: 'fade',
hide: 'fade',
expand: 'combo-expand',
collapse: 'combo-collapse',
update: [{ fields: ['x', 'y'] }, { fields: ['fill', 'stroke', 'lineWidth'], shape: 'key' }],
translate: [{ fields: ['x', 'y'] }],
},
},
};
```
</details>
### 暗色主题
<img width="300" src="https://mdn.alipayobjects.com/huamei_qa8qxu/afts/img/A*qTlLSoAbaXYAAAAAAAAAAAAAemJ7AQ/original" alt="暗色主题" />
<details><summary>查看暗色主题完整配置项</summary>
```js
const darkTheme = {
background: '#000000',
node: {
palette: {
type: 'group',
color: [
'#1783FF',
'#00C9C9',
'#F08F56',
'#D580FF',
'#7863FF',
'#DB9D0D',
'#60C42D',
'#FF80CA',
'#2491B3',
'#17C76F',
],
},
style: {
donutOpacity: 1,
badgeBackgroundOpacity: 1,
badgeFill: '#fff',
badgeFontSize: 8,
badgePadding: [0, 4],
badgePalette: ['#7E92B5', '#F4664A', '#FFBE3A'],
fill: '#1783ff',
fillOpacity: 1,
halo: false,
iconFill: '#fff',
iconOpacity: 1,
labelBackground: false,
labelBackgroundFill: '#000000',
labelBackgroundLineWidth: 0,
labelBackgroundOpacity: 0.75,
labelFill: '#ffffff',
labelFillOpacity: 0.85,
labelLineHeight: 16,
labelPadding: [0, 2],
labelFontSize: 12,
labelFontWeight: 400,
labelOpacity: 1,
labelOffsetY: 2,
lineWidth: 0,
portFill: '#1783ff',
portLineWidth: 1,
portStroke: '#d0e4ff',
portStrokeOpacity: 0.65,
size: 32,
stroke: '#d0e4ff',
strokeOpacity: 1,
zIndex: 2,
},
state: {
selected: {
halo: true,
haloLineWidth: 24,
haloStrokeOpacity: 0.45,
labelFontSize: 12,
labelFontWeight: 'bold',
lineWidth: 4,
stroke: '#d0e4ff',
},
active: {
halo: true,
haloLineWidth: 12,
haloStrokeOpacity: 0.25,
},
highlight: {
labelFontWeight: 'bold',
lineWidth: 4,
stroke: '#d0e4ff',
strokeOpacity: 0.85,
},
inactive: {
badgeBackgroundOpacity: 0.45,
donutOpacity: 0.45,
fillOpacity: 0.45,
iconOpacity: 0.45,
labelFill: '#ffffff',
labelFillOpacity: 0.45,
strokeOpacity: 0.45,
},
disabled: {
badgeBackgroundOpacity: 0.25,
donutOpacity: 0.25,
fill: '#D0E4FF',
fillOpacity: 0.25,
iconFill: '#D0E4FF',
iconOpacity: 0.25,
labelFill: '#ffffff',
labelFillOpacity: 0.25,
strokeOpacity: 0.25,
},
},
animation: {
enter: 'fade',
exit: 'fade',
show: 'fade',
hide: 'fade',
expand: 'node-expand',
collapse: 'node-collapse',
update: [{ fields: ['x', 'y', 'fill', 'stroke'] }],
translate: [{ fields: ['x', 'y'] }],
},
},
edge: {
palette: {
type: 'group',
color: [
'#637088',
'#0F55A6',
'#008383',
'#9C5D38',
'#8B53A6',
'#4E40A6',
'#8F6608',
'#3E801D',
'#A65383',
'#175E75',
'#0F8248',
],
},
style: {
badgeBackgroundFill: '#637088',
badgeFill: '#fff',
badgeFontSize: 8,
badgeOffsetX: 10,
fillOpacity: 1,
halo: false,
haloLineWidth: 12,
haloStrokeOpacity: 1,
increasedLineWidthForHitTesting: 2,
labelBackground: false,
labelBackgroundFill: '#000000',
labelBackgroundLineWidth: 0,
labelBackgroundOpacity: 0.75,
labelBackgroundPadding: [4, 4, 4, 4],
labelFill: '#ffffff',
labelFontSize: 12,
labelFontWeight: 400,
labelOpacity: 1,
labelPlacement: 'center',
labelTextBaseline: 'middle',
lineWidth: 1,
stroke: '#637088',
strokeOpacity: 1,
zIndex: 1,
},
state: {
selected: {
halo: true,
haloStrokeOpacity: 0.25,
labelFontSize: 14,
labelFontWeight: 'bold',
lineWidth: 3,
},
active: {
halo: true,
haloStrokeOpacity: 0.15,
},
highlight: {
labelFontWeight: 'bold',
lineWidth: 3,
},
inactive: {
stroke: '#D0E4FF',
fillOpacity: 0.08,
labelOpacity: 0.25,
strokeOpacity: 0.08,
badgeBackgroundOpacity: 0.25,
},
disabled: {
stroke: '#637088',
fillOpacity: 0.45,
strokeOpacity: 0.45,
labelOpacity: 0.25,
badgeBackgroundOpacity: 0.45,
},
},
animation: {
enter: 'fade',
exit: 'fade',
expand: 'path-in',
collapse: 'path-out',
show: 'fade',
hide: 'fade',
update: [{ fields: ['sourceNode', 'targetNode'] }, { fields: ['stroke'], shape: 'key' }],
translate: [{ fields: ['sourceNode', 'targetNode'] }],
},
},
combo: {
style: {
collapsedMarkerFill: '#000000',
collapsedMarkerFontSize: 12,
collapsedMarkerFillOpacity: 1,
collapsedSize: 32,
collapsedFillOpacity: 1,
fill: '#fdfdfd',
halo: false,
haloLineWidth: 12,
haloStroke: '#99add1',
haloStrokeOpacity: 0.25,
labelBackground: false,
labelBackgroundFill: '#000000',
labelBackgroundLineWidth: 0,
labelBackgroundOpacity: 0.75,
labelBackgroundPadding: [2, 4, 2, 4],
labelFill: '#ffffff',
labelFontSize: 12,
labelFontWeight: 400,
labelOpacity: 1,
lineDash: 0,
lineWidth: 1,
fillOpacity: 0.04,
strokeOpacity: 1,
padding: 10,
stroke: '#99add1',
},
state: {
selected: {
halo: true,
labelFontSize: 14,
labelFontWeight: 700,
lineWidth: 4,
},
active: {
halo: true,
},
highlight: {
labelFontWeight: 700,
lineWidth: 4,
},
inactive: {
fillOpacity: 0.65,
labelOpacity: 0.25,
strokeOpacity: 0.65,
},
disabled: {
fill: '#d0e4ff',
fillOpacity: 0.25,
labelOpacity: 0.25,
stroke: '#969696',
strokeOpacity: 0.25,
},
},
animation: {
enter: 'fade',
exit: 'fade',
show: 'fade',
hide: 'fade',
expand: 'combo-expand',
collapse: 'combo-collapse',
update: [{ fields: ['x', 'y'] }, { fields: ['fill', 'stroke', 'lineWidth'], shape: 'key' }],
translate: [{ fields: ['x', 'y'] }],
},
},
};
```
</details>
## 使用主题
### 配置主题
在创建图时通过 `theme` 选项指定要使用的主题:
```javascript
const graph = new Graph({
theme: 'light', // 或 'dark'
// ... 其他配置
});
```
### 切换主题
创建图后,可以通过 `setTheme` 方法动态切换主题:
```javascript
// 切换到暗色主题
graph.setTheme('dark');
// 获取当前主题
const currentTheme = graph.getTheme(); // 'dark'
```
## 样式优先级
在 G6 中,元素的最终样式由多个层级的样式合并而成,按优先级从低到高排序:
**⭐️ 主题默认样式** < 调色板样式 < 数据样式 < 图的默认样式 < **⭐️ 主题状态样式** < 图的状态样式
详细说明:
1. **主题默认样式**:主题系统提供的基础样式
2. **调色板样式**:基于主题调色板配置的自动着色样式
3. **数据样式**:在数据中定义的样式
4. **图的默认样式**:通过图的配置项设置的样式
5. **主题状态样式**:主题中定义的状态样式
6. **图的状态样式**:通过图的配置项设置的状态样式
更多关于自定义主题的内容,请参考[自定义主题](/manual/theme/custom-theme)。
Theme Skill
packages/site/docs/manual/theme/palette.en.md anthropic-skill ~2,182 tokens---
title: Palette
order: 3
---
## Overview
A palette refers to a set of predefined color collections that help users more conveniently select colors. In G6, a palette is a common option that allows users to configure the colors of elements such as nodes, edges, and links through the palette.
Palettes are divided into two types: `discrete palette` and `continuous palette`.
A discrete palette is an array of colors used to map discrete values within elements to different colors, such as the type of nodes, the relationship of edges, etc. Below is a simple example of a discrete palette:
```typescript
['#5B8FF9', '#61DDAA', '#F6BD16', '#F6903D', '#F08BB4'];
```
A continuous palette is an interpolator that takes a value between 0 and 1 and returns the corresponding color. It is used to map continuous values within elements to different colors, such as the degree of nodes, the weight of edges, etc. Below is a simple example of a continuous palette:
```typescript
(value: number) => `rgb(${value * 255}, 0, 0)`;
```
## Register Palette
You can directly use the built-in palettes, but if you want to use other palettes, you need to register them first:
```typescript
import { register, ExtensionCategory } from '@antv/g6';
import { CustomPalette } from 'package-name/or/path-to-your-custom-palette';
register(ExtensionCategory.PALETTE, 'custom-palette', CustomPalette);
```
:::warning{title=note}
During the process of registering a palette, there is no distinction made between discrete and continuous palettes. It is necessary to ensure the consistency between the palette type and the data type when using the palette.
:::
### Built-in Palettes
Currently, G6 has 5 sets of commonly used discrete palettes that users can directly utilize:
- spectral
<div style="display: flex; width: 600px; height: 20px;"><style>div{flex-grow:1}</style><div style="background: rgb(158, 1, 66);"></div><div style="background: rgb(213, 62, 79);"></div><div style="background: rgb(244, 109, 67);"></div><div style="background: rgb(253, 174, 97);"></div><div style="background: rgb(254, 224, 139);"></div><div style="background: rgb(255, 255, 191);"></div><div style="background: rgb(230, 245, 152);"></div><div style="background: rgb(171, 221, 164);"></div><div style="background: rgb(102, 194, 165);"></div><div style="background: rgb(50, 136, 189);"></div><div style="background: rgb(94, 79, 162);"></div></div>
- tableau
<div style="display: flex; width: 600px; height: 20px;"><style>div{flex-grow:1}</style><div style="background: rgb(78, 121, 167);"></div><div style="background: rgb(242, 142, 44);"></div><div style="background: rgb(225, 87, 89);"></div><div style="background: rgb(118, 183, 178);"></div><div style="background: rgb(89, 161, 79);"></div><div style="background: rgb(237, 201, 73);"></div><div style="background: rgb(175, 122, 161);"></div><div style="background: rgb(255, 157, 167);"></div><div style="background: rgb(156, 117, 95);"></div><div style="background: rgb(186, 176, 171);"></div></div>
- oranges
<div style="display: flex; width: 600px; height: 20px;"><style>div{flex-grow:1}</style><div style="background: rgb(255, 245, 235);"></div><div style="background: rgb(254, 230, 206);"></div><div style="background: rgb(253, 208, 162);"></div><div style="background: rgb(253, 174, 107);"></div><div style="background: rgb(253, 141, 60);"></div><div style="background: rgb(241, 105, 19);"></div><div style="background: rgb(217, 72, 1);"></div><div style="background: rgb(166, 54, 3);"></div><div style="background: rgb(127, 39, 4);"></div></div>
- greens
<div style="display: flex; width: 600px; height: 20px;"><style>div{flex-grow:1}</style><div style="background: rgb(247, 252, 245);"></div><div style="background: rgb(229, 245, 224);"></div><div style="background: rgb(199, 233, 192);"></div><div style="background: rgb(161, 217, 155);"></div><div style="background: rgb(116, 196, 118);"></div><div style="background: rgb(65, 171, 93);"></div><div style="background: rgb(35, 139, 69);"></div><div style="background: rgb(0, 109, 44);"></div><div style="background: rgb(0, 68, 27);"></div></div>
- blues
<div style="display: flex; width: 600px; height: 20px;"><style>div{flex-grow:1}</style><div style="background: rgb(247, 251, 255);"></div><div style="background: rgb(222, 235, 247);"></div><div style="background: rgb(198, 219, 239);"></div><div style="background: rgb(158, 202, 225);"></div><div style="background: rgb(107, 174, 214);"></div><div style="background: rgb(66, 146, 198);"></div><div style="background: rgb(33, 113, 181);"></div><div style="background: rgb(8, 81, 156);"></div><div style="background: rgb(8, 48, 107);"></div></div>
## Configure Palette
Currently, the configuration of palettes is mainly focused on elements, taking nodes as an example:
### Discrete Palette
1. Default Configuration: By directly setting the value of `palette` to the name of the palette, each node will be assigned a different color by default
```typescript
{
node: {
palette: 'spectral', // spectral is the Palette Name
}
}
```
<embed src="@/common/manual/core-concept/palette/default-config.md"></embed>
> When the number of elements exceeds the number of colors in the palette, the colors in the palette will be reused in a cyclic manner.
2. Standard Configuration: The attributes for configuring a discrete palette include: `type: 'group'`, `field`, `color`, `invert`.
Among them, `type: 'group'` explicitly specifies that the current palette type is a discrete palette; `field` designates the field for grouping in the element data; `color` is the name of the palette; `invert` indicates whether to invert the palette.
Given a set of example data:
```json
{
"nodes": [
{ "id": "node-1", "data": { "category": "A" } },
{ "id": "node-2", "data": { "category": "B" } },
{ "id": "node-3", "data": { "category": "C" } },
{ "id": "node-4", "data": { "category": "A" } },
{ "id": "node-5", "data": { "category": "B" } },
{ "id": "node-6", "data": { "category": "C" } }
]
}
```
In the data, `node-1` and `node-4` belong to category A, `node-2` and `node-5` belong to category B, `node-3` and `node-6` belong to category C.
Configure the color of the nodes in such a way that nodes of the same category have the same color:
```typescript
{
node: {
palette: {
type: 'group', // Specify the palette type as a categorical palette.
field: 'category', // Specify the grouping field in the data.
color: 'tableau', // Use a Tableau-like palette.
}
}
}
```
<embed src="@/common/manual/core-concept/palette/standard-config.md"></embed>
### Continuous Palette
A continuous palette only supports standard configuration methods, with configuration properties including: `type: 'value'`, `field`, `color`, `invert`.
Given a set of example data:
```json
{
"nodes": [
{ "id": "node-1", "data": { "value": 0 } },
{ "id": "node-2", "data": { "value": 20 } },
{ "id": "node-3", "data": { "value": 40 } },
{ "id": "node-4", "data": { "value": 60 } },
{ "id": "node-5", "data": { "value": 80 } },
{ "id": "node-6", "data": { "value": 100 } }
]
}
```
Now, create an interpolator that maps the maximum value to red (`rgb(255, 0, 0)`) and the minimum value to black (`rgb(0, 0, 0)`):
```typescript
(value) => `rgb(${value * 255}, 0, 0)`;
```
Configure the following so that the color of the nodes is mapped to different colors based on the value of the `value` field in the data:
```typescript
{
node: {
palette: {
type: 'value', // Specify the palette type as a continuous palette
field: 'value', // Specify the numerical field in the data
color: (value) => `rgb(${value * 255}, 0, 0)`, // Use an interpolator
}
}
}
```
<embed src="@/common/manual/core-concept/palette/continuous-palette.md"></embed>
:::warning{title=note}
The built-in continuous palette does not support specifying a value range. If there is a need for more complex color mapping, it can be customized within the style mapping.
:::
## Custom Palette
If the built-in palette does not meet your requirements, you can customize the palette. For details, please refer to [Custom Palette](/en/manual/custom-extension/palette).
## Priority
The palette generates styles based on the type of element. For nodes and combos, the color is mapped to the `fill` attribute; for edges, the color is mapped to the `stroke` attribute.
If both a palette and a style mapping are configured, the style mapping will override the palette colors. In the following example, the color of the nodes is always red:
```typescript
{
node: {
style: {
fill: 'red',
},
palette: 'spectral',
}
}
```
Theme Skill
packages/site/docs/manual/theme/palette.zh.md anthropic-skill ~1,530 tokens---
title: 色板
order: 3
---
## 概述
色板(Palette)是指一组预定义的颜色集合,用于帮助用户更方便的选择颜色。在 G6 中,色板是一种常见的配置项,用户可以通过色板来配置节点、边、连线等元素的颜色。
色板分为`离散色板`和`连续色板`两种类型。
离散色板是一组颜色数组,用于将元素中的离散值映射到不同的颜色上,例如节点的类型、边的关系等。下面是一个简单的离散色板示例:
```typescript
['#5B8FF9', '#61DDAA', '#F6BD16', '#F6903D', '#F08BB4'];
```
连续色板是一个插值器,输入 0~1 的值,返回对应的颜色,用于将元素中的连续值映射到不同的颜色上,例如节点的度数、边的权重等。下面是一个简单的连续色板示例:
```typescript
(value: number) => `rgb(${value * 255}, 0, 0)`;
```
## 注册色板
你可以直接使用内置色板,如果想使用其他色板,需要先进行注册:
```typescript
import { register, ExtensionCategory } from '@antv/g6';
import { CustomPalette } from 'package-name/or/path-to-your-custom-palette';
register(ExtensionCategory.PALETTE, 'custom-palette', CustomPalette);
```
:::warning{title=注意}
在注册色板过程中并不会区分离散色板和连续色板,使用色板过程中需要自行保证色板类型和数据类型的一致性。
:::
### 内置色板
目前 G6 内置了 5 套常用的离散色板,用户可以直接使用:
- spectral
<div style="display: flex; width: 600px; height: 20px;"><style>div{flex-grow:1}</style><div style="background: rgb(158, 1, 66);"></div><div style="background: rgb(213, 62, 79);"></div><div style="background: rgb(244, 109, 67);"></div><div style="background: rgb(253, 174, 97);"></div><div style="background: rgb(254, 224, 139);"></div><div style="background: rgb(255, 255, 191);"></div><div style="background: rgb(230, 245, 152);"></div><div style="background: rgb(171, 221, 164);"></div><div style="background: rgb(102, 194, 165);"></div><div style="background: rgb(50, 136, 189);"></div><div style="background: rgb(94, 79, 162);"></div></div>
- tableau
<div style="display: flex; width: 600px; height: 20px;"><style>div{flex-grow:1}</style><div style="background: rgb(78, 121, 167);"></div><div style="background: rgb(242, 142, 44);"></div><div style="background: rgb(225, 87, 89);"></div><div style="background: rgb(118, 183, 178);"></div><div style="background: rgb(89, 161, 79);"></div><div style="background: rgb(237, 201, 73);"></div><div style="background: rgb(175, 122, 161);"></div><div style="background: rgb(255, 157, 167);"></div><div style="background: rgb(156, 117, 95);"></div><div style="background: rgb(186, 176, 171);"></div></div>
- oranges
<div style="display: flex; width: 600px; height: 20px;"><style>div{flex-grow:1}</style><div style="background: rgb(255, 245, 235);"></div><div style="background: rgb(254, 230, 206);"></div><div style="background: rgb(253, 208, 162);"></div><div style="background: rgb(253, 174, 107);"></div><div style="background: rgb(253, 141, 60);"></div><div style="background: rgb(241, 105, 19);"></div><div style="background: rgb(217, 72, 1);"></div><div style="background: rgb(166, 54, 3);"></div><div style="background: rgb(127, 39, 4);"></div></div>
- greens
<div style="display: flex; width: 600px; height: 20px;"><style>div{flex-grow:1}</style><div style="background: rgb(247, 252, 245);"></div><div style="background: rgb(229, 245, 224);"></div><div style="background: rgb(199, 233, 192);"></div><div style="background: rgb(161, 217, 155);"></div><div style="background: rgb(116, 196, 118);"></div><div style="background: rgb(65, 171, 93);"></div><div style="background: rgb(35, 139, 69);"></div><div style="background: rgb(0, 109, 44);"></div><div style="background: rgb(0, 68, 27);"></div></div>
- blues
<div style="display: flex; width: 600px; height: 20px;"><style>div{flex-grow:1}</style><div style="background: rgb(247, 251, 255);"></div><div style="background: rgb(222, 235, 247);"></div><div style="background: rgb(198, 219, 239);"></div><div style="background: rgb(158, 202, 225);"></div><div style="background: rgb(107, 174, 214);"></div><div style="background: rgb(66, 146, 198);"></div><div style="background: rgb(33, 113, 181);"></div><div style="background: rgb(8, 81, 156);"></div><div style="background: rgb(8, 48, 107);"></div></div>
## 配置色板
目前开放色板配置的地方主要以元素为主,以节点为例:
### 离散色板
1. 默认配置,直接配置 `palette` 的值为色板名,会默认为每个节点分配不同的颜色
```typescript
{
node: {
palette: 'spectral', // spectral 为色板名
}
}
```
<embed src="@/common/manual/core-concept/palette/default-config.md"></embed>
> 当元素数量超过色板颜色数量时,会循环使用色板中的颜色
2. 标准配置,离散色板配置属性包括:`type: 'group'`,`field`,`color`,`invert`
其中 `type: 'group'` 显式指定了当前色板类型为离散色板;`field` 指定元素数据中的分组字段;`color` 为色板名;`invert` 为是否反转色板。
给定一组示例数据:
```json
{
"nodes": [
{ "id": "node-1", "data": { "category": "A" } },
{ "id": "node-2", "data": { "category": "B" } },
{ "id": "node-3", "data": { "category": "C" } },
{ "id": "node-4", "data": { "category": "A" } },
{ "id": "node-5", "data": { "category": "B" } },
{ "id": "node-6", "data": { "category": "C" } }
]
}
```
数据中 `node-1`,`node-4` 属于 A 类别,`node-2`,`node-5` 属于 B 类别,`node-3`,`node-6` 属于 C 类别。
通过以下方式配置节点的颜色,使得同类别的节点颜色相同:
```typescript
{
node: {
palette: {
type: 'group', // 指定色板类型为分类色板
field: 'category', // 指定数据中的分组字段
color: 'tableau', // 使用 tableau 色板
}
}
}
```
<embed src="@/common/manual/core-concept/palette/standard-config.md"></embed>
### 连续色板
连续色板只支持标准方式配置,配置属性包括:`type: 'value'`,`field`,`color`,`invert`。
给定一组示例数据:
```json
{
"nodes": [
{ "id": "node-1", "data": { "value": 0 } },
{ "id": "node-2", "data": { "value": 20 } },
{ "id": "node-3", "data": { "value": 40 } },
{ "id": "node-4", "data": { "value": 60 } },
{ "id": "node-5", "data": { "value": 80 } },
{ "id": "node-6", "data": { "value": 100 } }
]
}
```
现在创建一个插值器,将最大值映射为红色(`rgb(255, 0, 0)`),最小值映射为黑色(`rgb(0, 0, 0)`):
```typescript
(value) => `rgb(${value * 255}, 0, 0)`;
```
通过以下配置使得节点的颜色根据数据中的 `value` 字段的值映射到不同的颜色:
```typescript
{
node: {
palette: {
type: 'value', // 指定色板类型为连续色板
field: 'value', // 指定数据中的数值字段
color: (value) => `rgb(${value * 255}, 0, 0)`, // 使用插值器
}
}
}
```
<embed src="@/common/manual/core-concept/palette/continuous-palette.md"></embed>
:::warning{title=注意}
内置连续色板不支持指定值域范围,如果有更复杂的颜色映射需求,可以在样式映射中自定义
:::
## 自定义色板
如果内置色板无法满足需求,可以自定义色板,具体请参考[自定义色板](/manual/theme/custom-palette)。
## 优先级
色板会基于元素类型生成样式,对于节点和组合,会将颜色映射到 `fill` 属性;对于边,会将颜色映射到 `stroke` 属性。
如果同时配置了色板和样式映射,样式映射会覆盖色板颜色。下面的例子中,节点的颜色始终为红色:
```typescript
{
node: {
style: {
fill: 'red',
},
palette: 'spectral',
}
}
```
Transform Skill
packages/site/docs/manual/transform/custom-transform.en.md anthropic-skill ~11 tokens---
title: Custom Transform
order: 4
---
Transform Skill
packages/site/docs/manual/transform/custom-transform.zh.md anthropic-skill ~1,046 tokens---
title: 自定义数据处理
order: 4
---
## 概述
自定义数据处理允许用户在业务实现过程中,把额外的数据处理封装起来,在渲染前或者布局后对数据进行进一步处理。用户通过自定义数据处理,实现部分数据处理解耦,更好地进行管理、编排代码以及提高代码可维护性。
## 开始前
用户在进行自定义数据处理前,需要仔细阅读并掌握数据处理器的 [实现原理和执行时机](/manual/transform/overview#实现原理) 。
## 代码示例
接下来将讲述两个可能的业务场景,并通过自定义数据处理来实现:
### 不展示游离节点
- **需求**
游离节点,即没有连线的节点,画布渲染时不展示游离节点
- **实现**
```typescript
import type { DrawData, DrawContext } from '@antv/g6';
import { Graph, BaseTransform, register, ExtensionCategory } from '@antv/g6';
class HideFreeNode extends BaseTransform {
public beforeDraw(input: DrawData, context: DrawContext): DrawData {
const { model } = this.context;
const { add, update, remove } = input;
add.nodes.forEach((nodeData, nodeId) => {
// 获取节点的相关连线
const edges = model.getRelatedEdgesData(nodeId);
// 没有任何连线的的节点则从add里面移除,添加到remove里面
if (!edges.length) {
add.nodes.delete(nodeId);
remove.nodes.set(nodeId, nodeData);
}
});
return input;
}
}
```
<embed src="@/common/manual/custom-extension/transform/hide-free-node.md"></embed>
- **说明**
示例中总共有6个节点,id为1-6,id为4的节点没有连线,因此被移除了。
通过 `getRelatedEdgesData` 获取节点的相关连线,没有则把该节点放到 `remove.nodes` 里面去,并从 `add.nodes` 里面移除。
### 环形布局径向label
- **需求**
使用 [环形布局](/manual/layout/circular-layout) 时,节点 label 的也需要像内置数据处理器 [PlaceRadialLabels](/manual/transform/place-radial-labels) 一样实现径向展示(但 PlaceRadialLabels 只支持径向布局,环形布局不是径向布局)
- **实现**
```typescript
import type { RuntimeContext, DrawContext, Point, TransformArray, Vector2, Vector3 } from '@antv/g6';
import { Graph, BaseTransform, register, ExtensionCategory, BaseTransformOptions } from '@antv/g6';
// 目前circular布局没有暴露方法可以获取布局中心,这里简单处理先固定一个,配置circular布局时center与这里保持一致即可
const circularCenter = [300, 300];
// 下面的函数 G6 没有暴露出来,先自行声明
function subtract(a: Vector2 | Vector3, b: Vector2 | Vector3): Vector2 | Vector3 {
return a.map((v, i) => v - b[i]) as Vector2 | Vector3;
}
function rad(a: Vector2 | Vector3): number {
const [x, y] = a;
if (!x && !y) return 0;
return Math.atan2(y, x);
}
function rad2deg(rad: number): number {
return rad * (180 / Math.PI);
}
interface CircularRadialLabelsOptions extends BaseTransformOptions {
offset?: number; // 偏移量
}
class CircularRadialLabels extends BaseTransform<CircularRadialLabelsOptions> {
static defaultOptions = {
offset: 5,
};
constructor(context: RuntimeContext, options: CircularRadialLabelsOptions) {
super(context, Object.assign({}, CircularRadialLabels.defaultOptions, options));
}
get center(): Point {
return circularCenter;
}
public afterLayout() {
const { graph, model } = this.context;
const data = model.getData();
data.nodes?.forEach((datum) => {
const radian = rad(subtract([datum.style.x, datum.style.y], this.center));
const isLeft = Math.abs(radian) > Math.PI / 2;
const isLeaf = !datum.children || datum.children.length === 0;
const nodeId = datum.id;
const node = this.context.element?.getElement(nodeId);
if (!node || !node.isVisible()) return;
const nodeHalfWidth = graph.getElementRenderStyle(nodeId).size / 2;
const offset = (isLeaf ? 1 : -1) * (nodeHalfWidth + this.options.offset);
const labelTransform: TransformArray = [
['translate', offset * Math.cos(radian), offset * Math.sin(radian)],
['rotate', isLeft ? rad2deg(radian) + 180 : rad2deg(radian)],
];
model.updateNodeData([
{
id: datum.id,
style: {
labelTextAlign: isLeft === isLeaf ? 'right' : 'left',
labelTextBaseline: 'middle',
labelTransform,
},
},
]);
});
graph.draw();
}
}
```
<embed src="@/common/manual/custom-extension/transform/circular-radial-labels.md"></embed>
- **说明**
上面的实现基本是参考内置数据处理器 [PlaceRadialLabels](/manual/transform/place-radial-labels) 来实现的,区别是这里的实现是通过拿到布局中心来计算偏移和旋转,具体可参考 PlaceRadialLabels 的 [源码](https://github.com/antvis/G6/blob/v5/packages/g6/src/transforms/place-radial-labels.ts)
Transform Skill
packages/site/docs/manual/transform/MapNodeSize.en.md anthropic-skill ~954 tokens---
title: MapNodeSize
order: 1
---
In graph visualization, the size of a node is usually used to convey the importance or influence of the node. By adjusting the size of the node based on the centrality of the node, we can more intuitively show the importance of each node in the network, helping users better understand and analyze complex network structures.
## Options
### centrality
> [NodeCentralityOptions](#nodecentralityoptions) _\| ((graphData:_ [GraphData](/manual/core-concept/data#图数据graphdata)_) =>_ _Map**<**string, number>)_ **Default:** `type: 'eigenvector'`
The method of measuring the node centrality
- `'degree'`: Degree centrality, measures centrality by the degree (number of connected edges) of a node. Nodes with high degree centrality usually have more direct connections and may play important roles in the network
- `'betweenness'`: Betweenness centrality, measures centrality by the number of times a node appears in all shortest paths. Nodes with high betweenness centrality usually act as bridges in the network, controlling the flow of information
- `'closeness'`: Closeness centrality, measures centrality by the reciprocal of the average shortest path length from a node to all other nodes. Nodes with high closeness centrality usually can reach other nodes in the network more quickly
- `'eigenvector'`: Eigenvector centrality, measures centrality by the degree of connection between a node and other central nodes. Nodes with high eigenvector centrality usually connect to other important nodes
- `'pagerank'`: PageRank centrality, measures centrality by the number of times a node is referenced by other nodes, commonly used in directed graphs. Nodes with high PageRank centrality usually have high influence in the network, similar to the page ranking algorithm
- Custom centrality calculation method: `(graphData: GraphData) => Map<ID, number>`, where `graphData` is the graph data, and `Map<ID, number>` is the mapping from node ID to centrality value
#### NodeCentralityOptions
```typescript
type NodeCentralityOptions =
| { type: 'degree'; direction?: 'in' | 'out' | 'both' }
| { type: 'betweenness'; directed?: boolean; weightPropertyName?: string }
| { type: 'closeness'; directed?: boolean; weightPropertyName?: string }
| { type: 'eigenvector'; directed?: boolean }
| { type: 'pagerank'; epsilon?: number; linkProb?: number };
```
### mapLabelSize
> _boolean \| [number, number]_ **Default:** `false`
Whether to map label size synchronously
### maxSize
> _number \| [number, number] \| Float32Array \| [number, number, number]_ **Default:** `80`
The maximum size of the node
### minSize
> _number \| [number, number] \| Float32Array \| [number, number, number]_ **Default:** `20`
The minimum size of the node
### scale
> _'linear' \| 'log' \| 'pow' \| 'sqrt' \| ((value: number, domain: [number, number], range: [number, number]) => number)_ **Default:** `'log'`
Scale type
- `'linear'`: Linear scale, maps a value from one range to another range linearly, commonly used for cases where the difference in centrality values is small
- `'log'`: Logarithmic scale, maps a value from one range to another range logarithmically, commonly used for cases where the difference in centrality values is large
- `'pow'`: Power-law scale, maps a value from one range to another range using power law, commonly used for cases where the difference in centrality values is large
- `'sqrt'`: Square root scale, maps a value from one range to another range using square root, commonly used for cases where the difference in centrality values is large
- Custom scale: `(value: number, domain: [number, number], range: [number, number]) => number`,where `value` is the value to be mapped, `domain` is the input range, and `range` is the output range
Transform Skill
packages/site/docs/manual/transform/MapNodeSize.zh.md anthropic-skill ~1,130 tokens---
title: 动态调整节点大小 MapNodeSize
order: 1
---
## 概述
在图可视化中,节点的大小通常用于传达节点的重要性或影响力。通过根据节点中心性调整节点的大小,我们可以更直观地展示网络中各个节点的重要性,从而帮助用户更好地理解和分析复杂的网络结构。
## 使用场景
需要通过节点大小来突出节点的重要性和影响力时,可使用此数据处理。
以下为常见的场景:
- **社交网络分析**:比如分析社交媒体平台中用户的活跃度与影响力,通过节点大小突出高互动用户。
- **金融风险传导网络**:比如识别金融系统中承担关键资金流转职能的机构,预防系统性风险。
- **交通枢纽规划**:比如优化城市地铁网络设计,识别换乘压力点。
## 配置项
| 属性 | 描述 | 类型 | 默认值 | 必选 |
| ------------ | ---------------------------------------------------------- | ---------------------------------------------------------------------------------------------------------------------------------- | -------------------- | ---- |
| type | 数据处理类型 | map-node-size | - | ✓ |
| centrality | 节点中心性的度量方法,[配置项](#centrality) | [NodeCentralityOptions](#nodecentralityoptions) \| ((graphData: [GraphData](/manual/data#图数据graphdata)) => Map<string, number>) | `{ type: 'degree' }` | |
| mapLabelSize | 是否同步调整标签大小 | boolean \| [number, number] | false | |
| maxSize | 节点最大尺寸 | number \| [number, number] \| [number, number, number] | 80 | |
| minSize | 节点最小尺寸 | number \| [number, number] \| [number, number, number] | 20 | |
| scale | 插值函数,用于将节点中心性映射到节点大小,[配置项](#scale) | `linear` \| `log` \| `pow` \| `sqrt` \| ((value: number, domain: [number, number], range: [number, number]) => number) | `log` | |
### centrality
节点中心性的度量方法
- `'degree'`:度中心性,通过节点的度数(连接的边的数量)来衡量其重要性。度中心性高的节点通常具有较多的直接连接,在网络中可能扮演着重要的角色
- `'betweenness'`:介数中心性,通过节点在所有最短路径中出现的次数来衡量其重要性。介数中心性高的节点通常在网络中起到桥梁作用,控制着信息的流动
- `'closeness'`:接近中心性,通过节点到其他所有节点的最短路径长度总和的倒数来衡量其重要性。接近中心性高的节点通常能够更快地到达网络中的其他节点
- `'eigenvector'`:特征向量中心性,通过节点与其他中心节点的连接程度来衡量其重要性。特征向量中心性高的节点通常连接着其他重要节点
- `'pagerank'`:PageRank 中心性,通过节点被其他节点引用的次数来衡量其重要性,常用于有向图。PageRank 中心性高的节点通常在网络中具有较高的影响力,类似于网页排名算法
- 自定义中心性计算方法:`(graphData: GraphData) => Map<ID, number>`,其中 `graphData` 为图数据,`Map<ID, number>` 为节点 ID 到中心性值的映射
**示例:**
```typescript {6-9}
const graph = new Graph({
// 其他配置...
transforms: [
{
type: 'map-node-size',
centrality: {
type: 'degree',
direction: 'both',
},
},
],
});
```
效果如下(可切换度量方法查看不同效果,示例中节点 label 为`${节点 id } - ${节点大小}`):
<embed src="@/common/api/transforms/map-node-size-centrality.md"></embed>
#### NodeCentralityOptions
```typescript
type NodeCentralityOptions =
| { type: 'degree'; direction?: 'in' | 'out' | 'both' }
| { type: 'betweenness'; directed?: boolean; weightPropertyName?: string }
| { type: 'closeness'; directed?: boolean; weightPropertyName?: string }
| { type: 'eigenvector'; directed?: boolean }
| { type: 'pagerank'; epsilon?: number; linkProb?: number };
```
`direction`:表示统计哪些方向的边,`in` -入边、 `out` -出边、 `both` -入边和出边都考虑进去
`directed`:是否为有向图
`weightPropertyName`:边的权重属性名
`epsilon`:PageRank 算法的收敛容差
`linkProb`:PageRank 算法的阻尼系数,指任意时刻,用户访问到某节点后继续访问该节点链接的下一个节点的概率,经验值 0.85
### scale
- `'linear'`:线性插值函数,将一个值从一个范围线性映射到另一个范围,常用于处理中心性值的差异较小的情况
- `'log'`:对数插值函数,将一个值从一个范围对数映射到另一个范围,常用于处理中心性值的差异较大的情况
- `'pow'`:幂律插值函数,将一个值从一个范围幂律映射到另一个范围,常用于处理中心性值的差异较大的情况
- `'sqrt'`:平方根插值函数,将一个值从一个范围平方根映射到另一个范围,常用于处理中心性值的差异较大的情况
- 自定义插值函数:`(value: number, domain: [number, number], range: [number, number]) => number`,其中 `value` 为需要映射的值,`domain` 为输入值的范围,`range` 为输出值的范围
**示例:**
```typescript {9}
const graph = new Graph({
// 其他配置...
transforms: [
{
type: 'map-node-size',
centrality: {
type: 'degree',
},
scale: 'linear',
},
],
});
```
效果如下(该示例为基于度中心性 `degree` ,可切换插值函数查看不同效果,示例中节点 label 为`${节点 id } - ${节点大小}`):
<embed src="@/common/api/transforms/map-node-size-scale.md"></embed>
## 实际案例
- [场景案例:独角兽和他们的投资者](/examples/feature/default/#unicorns-investors)
Transform Skill
packages/site/docs/manual/transform/overview.en.md anthropic-skill ~17 tokens---
title: Data Transformation Overview
order: 0
---
## Overview
Transform Skill
packages/site/docs/manual/transform/overview.zh.md anthropic-skill ~1,704 tokens---
title: 数据处理总览
order: 0
---
## 什么是数据处理
数据处理( `transform` ),也叫数据转换器,是 G6 提供的支持在 **渲染前( `beforeDraw` )** 或者 **布局后( `afterLayout` )** 对绘制数据进行转化处理的机制,用户可以通过数据处理很方便地对数据处理逻辑进行封装解耦。
## 实现原理
### 基类
所有的数据处理器都是基于 [BaseTransform](https://github.com/antvis/G6/blob/v5/packages/g6/src/transforms/base-transform.ts) 这个基类进行实现,里面定义了两个基类方法 `beforeDraw` 和 `afterLayout` :
```typescript
export abstract class BaseTransform<T extends BaseTransformOptions = BaseTransformOptions> extends BaseExtension<T> {
public beforeDraw(data: DrawData, context: DrawContext): DrawData {
return data;
}
public afterLayout(type: 'pre', data: DrawData): void;
public afterLayout(type: 'post', data?: undefined): void;
public afterLayout(type: 'pre' | 'post', data?: DrawData) {}
}
```
以下是这两个方法里核心的参数类型说明:
- **DrawData**
```typescript
type ProcedureData = {
nodes: Map<ID, NodeData>;
edges: Map<ID, EdgeData>;
combos: Map<ID, ComboData>;
};
type DrawData = {
add: ProcedureData; // 本次渲染需要新增的元素
update: ProcedureData; // 本次渲染需要更新的元素
remove: ProcedureData; // 本次渲染需要移除的元素
};
```
- **pre | post**
pre:绘制前进行的布局(只会在首次布局触发)
post:完成绘制后进行的布局
### 执行时机
- **beforeDraw**
下面是每次渲染时数据处理的执行流程/时机:
<img width="300px" src="https://mdn.alipayobjects.com/huamei_qa8qxu/afts/img/A*Pb3kRI2yHo8AAAAAAAAAAAAAemJ7AQ/original"/>
**详细说明:**
1. G6 在每次渲染前计算出 `add`、`update`、`remove`,分别对应为需要新增、更新、移除的元素,以下简称为 `DrawData`
2. 此时数据处理介入,按配置顺序执行每个数据处理的 `beforeDraw` 方法,参数则为 `DrawData`
3. 数据处理器中,对 `DrawData` 里面的元素数据进行改动,即可以按需对 `add`、`update`、`remove` 里面的元素数据进行修改、移除或者插入元素数据等,最终把改动后的 `DrawData` 返回给渲染主体逻辑
4. 在执行数据处理后,执行对应的新增、更新、移除元素的操作,完成渲染
:::info{title=提示}
触发渲染的场景分为主动和被动,列举如下:
- **主动:** 用户主动调用 `graph.render()` 、 `graph.draw()` 或者在自定义插件、交互等实例里面通过上下文拿到元素控制器( [ElementController](https://github.com/antvis/G6/blob/v5/packages/g6/src/runtime/element.ts) )实例调用 `this.context.element.draw()`,等( `graph.render()` 和 `graph.draw()` 也是调用元素控制器的 `draw` 方法)
- **被动:** 部分内置交互和插件有触发渲染,布局执行后也有触发渲染更新元素位置,等
:::
- **afterLayout**:在执行完布局计算并开始更新节点位置后,执行数据处理
## 内置数据处理
- **G6 提供给用户的内置数据处理如下:**
各数据处理详细配置可参考 [内置数据处理文档](/manual/transform/map-node-size)。
| 数据处理名称 | 注册类型 | 功能描述 | 执行时机 |
| --------------------------------------------------- | ------------------------ | ---------------------------------------------------- | ---------- |
| [动态调整节点大小](/manual/transform/map-node-size) | `map-node-size` | 根据节点中心性调整节点的大小 | beforeDraw |
| [径向标签](/manual/transform/place-radial-labels) | `place-radial-labels` | 根据径向布局自动调整节点标签样式,包括位置和旋转角度 | afterDraw |
| [平行边](/manual/transform/process-parallel-edges) | `process-parallel-edges` | 处理平行边,即多条边共享同一源节点和目标节点 | beforeDraw |
- **G6 内嵌的数据处理如下:**
除了提供给用户选用的数据处理外, G6 也封装并使用了以下数据处理机制来实现基础功能。以下数据处理不开放给用户配置使用,默认必带(列举出来供用户有需要时点击查看并参考源码):
| 数据处理名称 | 注册类型 | 功能描述 | 执行时机 |
| ----------------------------------------------------------------------------------------------------------------------- | ----------------------- | ------------------------------------------------------------------------------------------------------------------------------------------------------------- | ---------- |
| [调整combo绘制顺序](https://github.com/antvis/G6/blob/v5/packages/g6/src/transforms/arrange-draw-order.ts) | `arrange-draw-order` | combo 嵌套时,优先绘制子 combo | beforeDraw |
| [处理组合的展开收起](https://github.com/antvis/G6/blob/v5/packages/g6/src/transforms/collapse-expand-combo.ts) | `collapse-expand-combo` | 收起时,移除 combo 内部元素、销毁内部边,外部边则连到收起的 combo 上;<br />展开时,反之; | beforeDraw |
| [处理(树图)节点的收起和展开](https://github.com/antvis/G6/blob/v5/packages/g6/src/transforms/collapse-expand-node.ts) | `collapse-expand-node` | 绘制前,处理(树图)节点的收起和展开 | beforeDraw |
| [获取边的实际端点](https://github.com/antvis/G6/blob/v5/packages/g6/src/transforms/get-edge-actual-ends.ts) | `get-edge-actual-ends` | 配合`collapse-expand-combo`实现收起时,combo 外部连到内部节点的边改为连到收起的 combo 上(`collapse-expand-combo`只是在收起时判断并标记了这些边需要更新端点) | beforeDraw |
| [更新节点、combo相关边](https://github.com/antvis/G6/blob/v5/packages/g6/src/transforms/update-related-edge.ts) | `update-related-edges` | 如果更新了节点/combo,则把连接的边也一起更新了 | beforeDraw |
:::warning{title=注意}
上面 G6 为实现自身基础功能使用的数据处理仅供参考,不可改动。如有需要在这些数据处理基础上做特殊处理,可通过 [自定义数据处理](#自定义数据处理) 实现。
:::
## 配置方式
### 基本配置
在图实例初始化时,通过 `transforms` 数组指定需要的数据处理:
```javascript
import { Graph } from '@antv/g6';
const graph = new Graph({
// 其他配置...
transforms: ['process-parallel-edges'],
});
```
### 配置数据处理参数
对于需要自定义参数的数据处理,可以使用 `object` 形式配置属性:
```javascript
const graph = new Graph({
// 其他配置...
transforms: [
'place-radial-labels',
{
type: 'process-parallel-edges',
key: 'process-parallel-edges-1',
mode: 'bundle',
distance: 30,
},
],
});
```
### 动态更新数据处理
G6 支持在图实例运行期间动态管理数据处理:
- 可以通过 [setTransforms](/api/transform#graphsettransformstransforms) 方法调整数据处理器:
```javascript
// 添加新的数据处理器
graph.setTransforms((transforms) => [...transforms, 'place-radial-labels']);
// 移除数据处理器
graph.setTransforms((transforms) => transforms.filter((t) => t !== 'place-radial-labels'));
```
- 可以通过 [updateTransform](/api/transform#graphupdatetransformtransform) 方法更新数据处理的配置:
```javascript
// 更新单个数据处理器
graph.updateTransform({
key: 'process-parallel-edges-1',
distance: 100,
});
```
:::warning{title=注意}
使用`updateTransform`方法时,需要在初始化时为数据处理指定唯一的`key`。
:::
### 卸载数据处理
使用 [setTransforms](/api/transform#graphsettransformstransforms) 方法同样可以卸载数据处理,将数据处理配置列表置为空即可:
```javascript
// 卸载所有数据处理器
graph.setTransforms([]);
```
## 自定义数据处理
当内置数据处理器无法满足需求时,你可以:
- 继承和扩展现有数据处理
- 创建全新的自定义数据处理
自定义数据处理需要先注册后使用。详细教程请参考 [自定义数据处理](/manual/transform/custom-transform) 文档。
```javascript
import { register, ExtensionCategory } from '@antv/g6';
import { MyCustomTransform } from './my-custom-transform';
// 注册自定义数据处理器
register(ExtensionCategory.TRANSFORM, 'my-custom-transform', MyCustomTransform);
// 使用自定义数据处理
const graph = new Graph({
transforms: ['my-custom-transform'],
});
```
Transform Skill
packages/site/docs/manual/transform/PlaceRadialLabels.en.md anthropic-skill ~22 tokens---
title: PlaceRadialLabels
order: 3
---
## Options
### offset
> _number_
Offset
Transform Skill
packages/site/docs/manual/transform/PlaceRadialLabels.zh.md anthropic-skill ~81 tokens---
title: 径向标签 PlaceRadialLabels
order: 2
---
**参考示例**:
- [径向生态树](/examples/scene-case/tree-graph/#radial-dendrogram)
- [径向紧凑树](/examples/scene-case/tree-graph/#radial-compact-tree)
## 配置项
### type
> _`place-radial-labels` \| string_
此数据处理已内置,你可以通过 `type: 'place-radial-labels'` 来使用它。
### offset
> _number_
偏移量
Transform Skill
packages/site/docs/manual/transform/ProcessParallelEdges.en.md anthropic-skill ~340 tokens---
title: ProcessParallelEdges
order: 3
---
Parallel Edges refer to multiple edges existing between two nodes in a graph structure. These edges share the same source and target nodes but may represent different relationships or attributes. To avoid edge overlap and confusion, two methods are provided for handling parallel edges: (1) Bundle Mode: Bundles parallel edges together and separates them from other edges by altering their curvature; (2) Merge Mode: Merges parallel edges into a single aggregated edge.
## Options
### distance
> _number_
The distance between edges, only valid for bundling mode
### edges
> _string[]_
The edges to be handled, all edges by default
### <Badge type="success">Required</Badge> mode
> _'bundle' \| 'merge'_ **Default:** `'bundle'`
Processing mode
- '`merge`': Merge parallel edges into one edge which is suitable for cases where parallel edges do not need to be distinguished
- '`bundle`': Each edge will be bundled with all other parallel edges and separated from them by varying the curvature. If the number of parallel edges in a group is odd, the central edge will be drawn as a straight line, and the others will be drawn as curves
### style
> _PathStyleProps_ _\| ((prev:_ [EdgeData](/api/graph/option#edgedata)_[]) =>_ _PathStyleProps)_
The style of the merged edge, only valid for merging mode
Transform Skill
packages/site/docs/manual/transform/ProcessParallelEdges.zh.md anthropic-skill ~1,626 tokens---
title: 平行边 ProcessParallelEdges
order: 3
---
## 概述
平行边(Parallel Edges)是指在图结构中,两个节点之间存在多条边。这些边共享相同的源节点和目标节点,但可能代表不同的关系或属性。为了避免边的重叠和混淆,提供了两种处理平行边的方式:
- 捆绑模式(bundle):将平行边捆绑在一起,通过改变曲率与其他边分开
- 合并模式(merge):将平行边合并为一条聚合
## 使用场景
下面为常见使用场景举例:
- 双向数据流,比如客户端发送请求,服务端返回响应
- 多依赖关系,即一个节点通过多种方式依赖另一个节点,比如微服务架构中,服务 A 调用服务 B的两个不同 API
- 多链路,比如高可用架构中,主链路(实线,状态正常)与备份链路(灰色虚线,状态待机)同时展示
## 基本用法
**1. 快速配置(静态)**
使用字符串形式直接声明,这种方式简洁但仅支持默认配置,且配置后不可动态修改:
```javascript
const graph = new Graph({
// 其他配置...
transforms: ['process-parallel-edges'],
});
```
**2. 对象配置(推荐)**
使用对象形式进行配置,支持自定义参数,且可以在运行时动态更新配置:
```javascript
const graph = new Graph({
// 其他配置...
transforms: [
{
type: 'process-parallel-edges',
key: 'process-parallel-edges',
mode: 'bundle', // 默认就是捆绑模式了
distance: 30, // 配置捆绑模式下边之间的距离为30
},
],
});
```
## 配置项
| 属性 | 描述 | 类型 | 默认值 | 必选 |
| -------- | -------------------------------------------------- | --------------------------------------------------------------------------------------- | ----------------------- | ---- |
| type | 数据处理类型 | process-parallel-edges | - | ✓ |
| distance | 边之间的距离,仅在捆绑模式下有效 | number | 15 | |
| edges | 考虑要处理的边,默认为全部边 | string[] | - | |
| mode | 处理模式,[配置项](#mode) | `'bundle'` | `'merge'` \| `'bundle'` | |
| style | 合并边的样式,仅在合并模式下有效,[配置项](#style) | PathStyleProps \| ((prev: [EdgeData](/manual/data#边数据edgedata)[]) => PathStyleProps) | - | |
### mode
提供了两种处理模式:
- `'merge'`: 将平行边合并为一条边,适用于不需要区分平行边的情况,[示例](#合并模式)
`merge` 使用的是内置的直线( [`line`](/manual/element/edge/Line) )来展示合并边。
- `'bundle'`: 每条边都会与其他所有平行边捆绑在一起,并通过改变曲率与其他边分开。如果一组平行边的数量是奇数,那么中心的边将被绘制为直线,其他的边将被绘制为曲线,[示例](#捆绑模式)
`bundle` 使用的是内置的二次贝塞尔曲线( [`quadratic`](/manual/element/edge/Quadratic) )来实现,数据处理过程会强制把每个 `edgeDatum.type` 改为 `quadratic`,并计算每条线的曲率。
:::warning{title=注意}
禁止在创建 Graph 实例时配置 `edge.type` 即默认的边类型,因为它的优先级比 `edgeDatum.type` 要高,会导致 `bundle` 模式的处理无法生效。
:::
### style
合并边的样式,仅在合并模式下有效
#### PathStyleProps
下表列出了常用的属性,更多属性请参考 [PathStyleProps](https://g.antv.antgroup.com/api/basic/path#pathstyleprops)。
| 属性 | 描述 | 类型 | 默认值 | 必选 |
| -------------- | ------------------------- | ----------------------------- | --------- | ---- |
| fill | 填充色 | string | `#1783FF` |
| fillOpacity | 填充色透明度 | number \| string | 1 |
| lineCap | 描边端点样式 | `round` \| `square` \| `butt` | `butt` |
| lineDash | 描边虚线样式 | number[] | - |
| lineDashOffset | 描边虚线偏移量 | number | - |
| lineJoin | 描边连接处样式 | `round` \| `bevel` \| `miter` | `miter` |
| lineWidth | 描边宽度 | number | 1 |
| opacity | 透明度 | number \| string | 1 |
| shadowBlur | 阴影模糊度 | number | - |
| shadowColor | 阴影颜色 | string | - |
| shadowOffsetX | 阴影在 x 轴方向上的偏移量 | number \| string | - |
| shadowOffsetY | 阴影在 y 轴方向上的偏移量 | number \| string | - |
| shadowType | 阴影类型 | `inner` \| `outer` | `outer` |
| stroke | 描边色 | string | `#000` |
| strokeOpacity | 描边色透明度 | number \| string | 1 |
| visibility | 图形是否可见 | `visible` \| `hidden` | `visible` |
## 代码示例
### 捆绑模式
```js | ob { inject: true }
import { Graph } from '@antv/g6';
const data = {
nodes: [
{ id: 'A', style: { x: 50, y: 350 } },
{ id: 'B', style: { x: 250, y: 150 } },
{ id: 'C', style: { x: 450, y: 350 } },
],
edges: [
{ source: 'A', target: 'C' },
{ source: 'C', target: 'A' },
...Array.from({ length: 10 }).map((_, i) => ({
id: `edge:A-B${i}`,
source: 'A',
target: 'B',
data: {
label: `A->B:${i}`,
},
})),
...Array.from({ length: 5 }).map((_, i) => ({
id: `edge:B-C${i}`,
source: 'B',
target: 'C',
data: {
label: `B->C:${i}`,
},
})),
],
};
const graph = new Graph({
container: 'container',
autoFit: 'center',
data,
node: {
style: {
ports: [{ placement: 'center' }],
labelText: (d) => d.id,
},
},
edge: {
style: {
labelText: (d) => d?.data?.label || `${d.source}->${d.target}`,
},
},
behaviors: ['drag-element'],
transforms: ['process-parallel-edges'],
});
graph.render();
```
### 合并模式
下面是一个简单的合并模式的例子,需要注意:
- 不需要合并(即两个节点间只有一条边)的边,合并样式不会在这条边上生效,比如例子中的 **A->C**
- 合并样式实际上是赋值给 `datum.style` ,也就是优先级会比实例化 Graph 时配置的默认样式低( `edge.style` ),所以例子中合并样式的 `startArrow` 没有生效
```js | ob { inject: true }
import { Graph } from '@antv/g6';
const data = {
nodes: [
{ id: 'A', style: { x: 50, y: 350 } },
{ id: 'B', style: { x: 250, y: 150 } },
{ id: 'C', style: { x: 450, y: 350 } },
],
edges: [
{ source: 'A', target: 'B' },
{ source: 'B', target: 'A' },
{ id: 'B-C:1', source: 'B', target: 'C' },
{ id: 'B-C:2', source: 'B', target: 'C' },
{ source: 'A', target: 'C' },
],
};
const graph = new Graph({
container: 'container',
autoFit: 'center',
data,
node: {
style: {
labelText: (d) => d.id,
},
},
edge: {
style: {
labelText: (d) => d?.data?.label || `${d.source}->${d.target}`,
startArrow: false,
},
},
transforms: [
{
type: 'process-parallel-edges',
mode: 'merge',
style: {
halo: true,
haloOpacity: 0.2,
haloStroke: 'red',
startArrow: true,
},
},
],
});
graph.render();
```
Whats-new Skill
packages/site/docs/manual/whats-new/feature.en.md anthropic-skill ~1,128 tokens---
title: Feature
order: 1
---
## 🏖️ Brand New Design Specification for Graphs
G6 version 5.0 has redesigned the Options specification. While ensuring comprehensive capabilities, it optimizes the options structure to be more intuitive and easier to understand.
You only need to quickly grasp the basic [core concepts](/en/manual/graph/graph) to get started with G6 quickly and achieve graph visualization without delay.
**😰 The 4.0 Options** had a complex nested structure and was less semantically capable
```typescript
{
defaultNode: {
size: 30,
style: {
fill: 'steelblue',
stroke: '#666',
lineWidth: 1
},
labelCfg: {
style: {
fill: '#fff',
}
}
},
nodeStateStyles: {
hover: {
fill: 'lightsteelblue'
}
},
modes: {
default: ['zoom-canvas', 'drag-canvas', 'drag-node'],
},
}
```
**😄 The 5.0 Options** has a clear structure and is easy to understand
```typescript
{
node: {
style: {
size: 30,
fill: 'steelblue',
stroke: '#666',
lineWidth: 1
labelFill: '#fff',
},
state: {
hover: {
fill: 'lightsteelblue'
}
}
},
behaviors: ['zoom-canvas', 'drag-canvas', 'drag-element'],
}
```
## 🔨 Brand New API Design
G6 5.0 features a cleaner, easy-to-use API design that is more in line with modern front-end frameworks.
## 🌲 Merging Graphs with Tree Graphs
Tree graphs are essentially a type of directed acyclic graph. G6 5.0 has integrated the design of graphs and tree graphs, reducing the cost of understanding and usage.
Now, you can directly use `Graph` to instantiate and draw tree graphs in G6, without the need to use `TreeGraph`. You simply need to specify the layout as a tree graph layout.
Additionally, G6 provides the `treeToGraphData` utility method to help you quickly convert tree graph data into graph data.
<embed src="@/common/manual/feature/treeToGraphData.md"></embed>
## 🌆 Multi-Renderer Support
G6 5.0 employs the next-generation @antv/g rendering engine, which has been newly designed. It offers support for multiple renderers such as `Canvas`, `SVG`, and `WebGL`. Additionally, it supports the mixed use of different renderers on layered canvases.
```typescript
import { Renderer } from '@antv/g-webgl';
import { Graph } from '@antv/g6';
const graph = new Graph({
// ... other configurations
// Use the WebGL renderer
renderer: () => new Renderer(),
});
```
## 🚀 High-Performance Layouts
G6 5.0 has adopted a brand-new layout engine, with some layouts implemented in Rust, providing higher performance for layout calculations. Additionally, there is support for WebGPU acceleration in certain layouts.
> 🚀 To utilize high-performance layouts, you will need to install the `@antv/layout-wasm` package
```typescript
import { FruchtermanLayout } from '@antv/layout-gpu';
import { Graph, register, ExtensionCategory } from '@antv/g6';
register(ExtensionCategory.LAYOUT, 'fruchterman-gpu', FruchtermanLayout);
const graph = new Graph({
// ... other configurations
layout: {
type: 'fruchterman-gpu',
// ... Other Layout Configurations
},
});
```
## 🎨 Multiple Themes Mechanism
G6 5.0 comes with two built-in themes: light and dark, and allows for flexible customization based on the use case. For details, please refer to [Custom Theme](/en/manual/custom-extension/theme).
<image width="300" src="https://mdn.alipayobjects.com/huamei_qa8qxu/afts/img/A*gASzQbsbAaIAAAAAAAAAAAAADmJ7AQ/original"></image>
## 🌍 3D Large Graphs
G6 5.0 provides 3D rendering, layout, interaction capabilities, and can be used by import 3d elements, renderer, and behaviors from `@antv/g6-extension-3D` registration, see: [Using 3D](/manual/further-reading/3d).
<image width="300" src="https://mdn.alipayobjects.com/huamei_qa8qxu/afts/img/A*ZQoEQLKazPIAAAAAAAAAAAAADmJ7AQ/original"></image>
## 💪 Plugin Optimization and Enhancement
G6 5.0 has optimized and enhanced existing plugins, decoupling Graph from plugins, and providing richer capabilities while optimizing configurations.
Please visit [Plugin](/en/api/plugins/bubble-sets) to experience the capabilities of more plugins.
## 💼 Optimized Package Size
Thanks to the well-modularized design and extension registration mechanism of G6 5.0, modules that are not used will not be packaged into the final build file, reducing the package size.
Compared to 4.0, the UMD package size has been reduced from 1.8 MB to 0.96 MB, a reduction of nearly 50%.
Whats-new Skill
packages/site/docs/manual/whats-new/feature.zh.md anthropic-skill ~781 tokens---
title: 新版本特性
order: 1
---
## 🏖️ 全新设计图配置范式
G6 5.0 重新设计了图配置范式,在保证能力完善的基础上,优化配置项结构,更加直观、易于理解。
仅需快速了解基本[核心概念](/manual/graph/graph),即可快速上手 G6,快速实现图可视化。
**😰 4.0 配置项** 嵌套结构复杂,语义化能力较弱
```typescript
{
defaultNode: {
size: 30,
style: {
fill: 'steelblue',
stroke: '#666',
lineWidth: 1
},
labelCfg: {
style: {
fill: '#fff',
}
}
},
nodeStateStyles: {
hover: {
fill: 'lightsteelblue'
}
},
modes: {
default: ['zoom-canvas', 'drag-canvas', 'drag-node'],
},
}
```
**😄 5.0 配置项** 结构清晰,易于理解
```typescript
{
node: {
style: {
size: 30,
fill: 'steelblue',
stroke: '#666',
lineWidth: 1
labelFill: '#fff',
},
state: {
hover: {
fill: 'lightsteelblue'
}
}
},
behaviors: ['zoom-canvas', 'drag-canvas', 'drag-element'],
}
```
## 🔨 全新 API 设计
G6 5.0 采用了更加简洁、易用的 API 设计,更加符合现代前端框架的设计风格。
## 🌲 合并图与树图
树图本质上是一种单向无环图,G6 5.0 融合了图与树图的设计,降低了理解和使用成本。
现在,你可以在 G6 中直接使用 `Graph` 来实例化绘制树图,而不需要再使用 `TreeGraph`,仅需指定布局为树图布局即可。
此外,G6 提供了 `treeToGraphData` 工具方法,帮助你快速将树图数据转换为图数据。
<embed src="@/common/manual/feature/treeToGraphData.md"></embed>
## 🌆 多渲染器支持
G6 5.0 采用了新一代设计的 @antv/g 渲染引擎,提供了 `Canvas` `SVG` `WebGL` 多种渲染器支持,并且分层画布支持不同渲染器的混合使用。
```typescript
import { Renderer } from '@antv/g-webgl';
import { Graph } from '@antv/g6';
const graph = new Graph({
// ... 其他配置
// 使用 WebGL 渲染器
renderer: () => new Renderer(),
});
```
## 🚀 高性能布局
G6 5.0 采用了全新布局引擎,部分布局提供 Rust 实现,提供了更高性能的布局计算。另有布局支持 WebGPU 加速。
> 🚀 高性能布局需要安装 `@antv/layout-wasm` 包
```typescript
import { ForceAtlas2Layout, initThreads, supportsThreads } from '@antv/layout-wasm';
import { Graph, register, ExtensionCategory } from '@antv/g6';
register(ExtensionCategory.LAYOUT, 'forceatlas2-wasm', ForceAtlas2Layout);
const supported = await supportsThreads();
const threads = await initThreads(supported);
const graph = new Graph({
// ... 其他配置
layout: {
type: 'forceatlas2-wasm',
threads,
// ... 其他布局配置
},
});
```
> GPU 加速布局需要安装 `@antv/layout-gpu` 包
```typescript
import { FruchtermanLayout } from '@antv/layout-gpu';
import { Graph, register, ExtensionCategory } from '@antv/g6';
register(ExtensionCategory.LAYOUT, 'fruchterman-gpu', FruchtermanLayout);
const graph = new Graph({
// ... 其他配置
layout: {
type: 'fruchterman-gpu',
// ... 其他布局配置
},
});
```
## 🎨 多主题机制
G6 5.0 内置了亮色、暗色两套主题,并可基于使用场景进行灵活定制,具体可参考[自定义主题](/manual/theme/custom-theme)。
<image width="300" src="https://mdn.alipayobjects.com/huamei_qa8qxu/afts/img/A*gASzQbsbAaIAAAAAAAAAAAAADmJ7AQ/original"></image>
## 🌍 3D 大图
G6 5.0 提供了 3D 大图渲染、布局、交互能力,从 `@antv/g6-extension-3d` 中引入 3D 元素、渲染器、交互等注册即可使用,详见:[使用 3D](/manual/further-reading/3d)。
<image width="300" src="https://mdn.alipayobjects.com/huamei_qa8qxu/afts/img/A*ZQoEQLKazPIAAAAAAAAAAAAADmJ7AQ/original"></image>
## 💪 插件优化增强
G6 5.0 对现有插件进行了优化增强,解除了 Graph 与插件之间的耦合,并优化配置的同时提供了更加丰富了能力。
敬请前往[插件](/manual/plugin/overview)体验更多插件的能力。
## 💼 优化包体积
得益于 G6 5.0 良好的模块化的设计以及扩展注册机制,对于未使用的模块,不会被打包到最终的构建文件中,减小了包体积。
与 4.0 相比,UMD 包体积从 1.8 MB 减小到 0.96 MB,减小了近 50%。
Whats-new Skill
packages/site/docs/manual/whats-new/upgrade-to-5-1.en.md anthropic-skill ~648 tokens---
title: Upgrade from 5.0 to 5.1 (Layout)
order: 7
---
This page focuses on layout documentation changes introduced in G6 `5.1`. Starting from `5.1`, layout pages prioritize the field naming aligned with `@antv/layout`; common `5.0` layout writeups are collected here for migration reference.
## What Changed
- Since `5.1`, layout docs prioritize shared `@antv/layout` fields such as `width`, `height`, `center`, `enableWorker`, `node`, and `edge`
- Individual layout pages mainly keep the recommended `5.1` writeup
- If you are migrating an existing `5.0` project, use this page to map old field names to the new documentation style
## D3Force: center force to shortcut fields
In `5.0` documentation, the center force was commonly written inside `center`:
```typescript
{
layout: {
type: 'd3-force',
center: {
x: 250,
y: 150,
strength: 0.8,
},
},
}
```
In `5.1` documentation, the recommended form is the shortcut fields:
```typescript
{
layout: {
type: 'd3-force',
centerX: 250,
centerY: 150,
centerStrength: 0.8,
},
}
```
- `center.x` maps to `centerX`
- `center.y` maps to `centerY`
- `center.strength` maps to `centerStrength`
For the full field description, see [D3Force Layout](/en/manual/layout/d3-force-layout).
## ComboCombined: innerLayout / outerLayout to layout
In `5.0` documentation, the inner combo layout and the outer layout were commonly configured separately:
```typescript
import { ConcentricLayout, ForceLayout } from '@antv/layout';
{
layout: {
type: 'combo-combined',
innerLayout: new ConcentricLayout({
sortBy: 'id',
}),
outerLayout: new ForceLayout({
gravity: 1,
}),
},
}
```
In `5.1` documentation, the recommended form is a single `layout` entry that returns different configurations for different levels based on `comboId`:
```typescript
{
layout: {
type: 'combo-combined',
layout: (comboId) =>
comboId
? { type: 'concentric', sortBy: 'id' }
: { type: 'force', gravity: 1 },
},
}
```
- When `comboId` has a value, it refers to the layout inside a combo
- When `comboId` is empty, it refers to the outermost layout
- Multiple layout choices are unified under the `layout` entry
For the `5.1` recommended form, see [ComboCombined Layout](/en/manual/layout/combo-combined-layout).
## Migration Suggestion
1. Identify the matching layout type from your existing `5.0` project
2. Map the old fields to the recommended `5.1` documentation style
3. Return to the specific layout page to verify shared fields and defaults
Whats-new Skill
packages/site/docs/manual/whats-new/upgrade-to-5-1.zh.md anthropic-skill ~425 tokens---
title: 从 5.0 升级到 5.1(布局)
order: 7
---
本文档聚焦 G6 `5.1` 中布局文档的写法调整。`5.1` 的布局页面会优先展示与 `@antv/layout` 对齐后的字段;`5.0` 中常见的布局写法统一收敛到本文档中,便于迁移时对照。
## 总体变化
- `5.1` 起,布局文档会优先展示 `@antv/layout` 的公共字段,例如 `width` `height` `center` `enableWorker` `node` `edge`
- 各布局页主要保留 `5.1` 推荐写法,`5.0` 中常见写法请以本文档为准
- 迁移时,建议先按旧项目中的字段定位,再映射到 `5.1` 文档里的推荐配置
## D3Force:center force 改为快捷字段
`5.0` 文档中,常见把中心力写在 `center` 中:
```typescript
{
layout: {
type: 'd3-force',
center: {
x: 250,
y: 150,
strength: 0.8,
},
},
}
```
`5.1` 文档中推荐写成更直接的快捷字段:
```typescript
{
layout: {
type: 'd3-force',
centerX: 250,
centerY: 150,
centerStrength: 0.8,
},
}
```
- `center.x` 对应 `centerX`
- `center.y` 对应 `centerY`
- `center.strength` 对应 `centerStrength`
如果你需要继续对照完整字段说明,可查看 [D3Force 布局](/manual/layout/d3-force-layout)。
## ComboCombined:innerLayout / outerLayout 收敛为 layout
`5.0` 文档中,常见分别配置 Combo 内部布局和最外层布局:
```typescript
import { ConcentricLayout, ForceLayout } from '@antv/layout';
{
layout: {
type: 'combo-combined',
innerLayout: new ConcentricLayout({
sortBy: 'id',
}),
outerLayout: new ForceLayout({
gravity: 1,
}),
},
}
```
`5.1` 文档中推荐使用单个 `layout` 字段,根据 `comboId` 为不同层级返回布局配置:
```typescript
{
layout: {
type: 'combo-combined',
layout: (comboId) =>
comboId
? { type: 'concentric', sortBy: 'id' }
: { type: 'force', gravity: 1 },
},
}
```
- `comboId` 有值时,表示当前为 Combo 内部层级
- `comboId` 为空时,表示当前为最外层布局
- 多层布局选择统一收敛到 `layout` 入口
如果你需要查看 `5.1` 推荐写法,可查看 [ComboCombined 布局](/manual/layout/combo-combined-layout)。
## 迁移建议
1. 先按旧项目中的布局类型定位到本文档对应条目
2. 再把 `5.0` 字段映射成 `5.1` 文档里的推荐写法
3. 最后回到具体布局页,核对公共字段和默认值
Whats-new Skill
packages/site/docs/manual/whats-new/upgrade.en.md anthropic-skill ~3,491 tokens---
title: Upgrade To 5.0
order: 6
---
This document will guide you through the process of upgrading from G6 version `4.x` to `5.x`. If you are using version `3.x`, please upgrade to version `4.x` first.
## Preparation Before Upgrade
1. Please ensure that your current git branch is clean and there is no uncommitted code.
2. Refer to the [Installation](./getting-started/installation) document to install version `5.x` and remove the dependencies for version `4.x`.
## Start Upgrade
### Data
The data format in the new version has changed as follows:
1. All style attributes in `nodes`, `edges`, and `combos` need to be placed within `style`, and data attributes should be stored in `data`:
```typescript
// 4.x
const data = {
nodes: [
{ id: 'node1', label: 'node1', size: 20 },
{ id: 'node2', label: 'node2', size: 20 },
],
edges: [{ source: 'node1', target: 'node2' }],
};
// 5.x
const data = {
nodes: [
// The label is a non-stylistic attribute, placed in the data, and can be accessed in the style mapping function
// The `size` is a stylistic attribute, placed within the `style`
{ id: 'node1', data: { label: 'node1' }, style: { size: 20 } },
{ id: 'node2', data: { label: 'node2' }, style: { size: 20 } },
],
edges: [{ source: 'node1', target: 'node2' }],
};
```
Since we have redesigned and implemented the elements, please refer to the corresponding documentation to modify the new element options:
- [Node](/en/api/elements/nodes/base-node)
- [Edge](/en/api/elements/edges/base-edge)
- [Combo](/en/api/elements/combos/base-combo)
2. If you need to specify the element type in the data, you can use the `type` attribute:
```typescript
{
nodes: [
// Specify the node type as rect
{ id: 'node1', type: 'rect' },
];
}
```
### Options
<Badge type="warning">Change</Badge> **fitView / fitCenter / fitViewPadding**
- The `fitView` and `fitCenter` options have been merged into `autoFit`.
- To use `fitView`, you can configure it as `autoFit: 'view'`
- To use `fitCenter`, you can configure it as `autoFit: 'center'`
- You can also pass an object for full configuration:
```js
autoFit: {
type: 'view',
options: {
// ...
}
}
```
- The `fitViewPadding` has been changed to `padding`.
<Badge type="error">Removed</Badge> **linkCenter**
In version 5.x, the edge connection mechanism will attempt to connect to nodes/Combos in the following order:
1. Connect Port
2. Outline
3. Center
<Badge type="error">Removed</Badge> **groupByTypes**
<Badge type="error">Removed</Badge> **autoPaint**
Please manually call the `render` or `draw` method to perform rendering.
<Badge type="warning">Changed</Badge> **modes**
In version 5.x, interaction modes have been removed. You can switch the currently enabled behaviors by setting `behaviors`.
```typescript
// 4.x
{
modes: {
default: ['drag-canvas', 'zoom-canvas'],
preview: ['drag-canvas'],
},
}
graph.setMode('preview');
```
```typescript
// 5.x
{
behaviors: ['drag-canvas', 'zoom-canvas'],
}
graph.setBehaviors(['drag-canvas']);
```
<Badge type="warning">Change</Badge> **defaultNode / defaultEdge / defaultCombo**
The element styles have been moved to `[element].style`, for example, `defaultNode` has been changed to `node.style`:
```typescript
// 4.x
{
defaultNode: {
size: 20,
fill: 'red',
}
}
// 5.x
{
node: {
style: {
size: 20,
fill: 'red',
}
}
}
```
<Badge type="warning">Change</Badge> **nodeStateStyles / edgeStateStyles / comboStateStyle**
Element state styles have been moved to `[element].state`, for example, `nodeStateStyles` has been changed to `node.stateStyles`:
```typescript
// 4.x
{
nodeStateStyles: {
selected: {
fill: 'red',
}
}
}
// 5.x
{
node: {
state: {
selected: {
fill: 'red',
}
}
}
}
```
<Badge type="warning">Change</Badge> **animate / animateCfg**
- The `animate` options has been changed to `animation`
- `animate` and `animateCfg` have been merged into `animation`
```typescript
// 4.x
{
animate: true,
}
// 5.x
{
animation: true,
}
{
animation: {
duration: 500,
easing: 'easeLinear',
}
}
```
<Badge type="warning">Change</Badge> **minZoom / maxZoom**
- The `minZoom` and `maxZoom` options have been merged into `zoomRange`
```typescript
// 4.x
{
minZoom: 0.5,
maxZoom: 2,
}
// 5.x
{
zoomRange: [0.5, 2],
}
```
<Badge type="warning">Change</Badge> **renderer**
G6 5.x supports multi-layer canvases and defaults to using the `canvas` renderer.
The `renderer` no longer supports the string type and has been changed to a callback function:
```typescript
// 4.x
var options = {
renderer: 'svg',
};
// 5.x
import { Renderer } from '@antv/g-svg';
{
renderer: () => new Renderer(),
}
```
<Badge type="error">Removed</Badge> **enabledStack / maxStep**
The built-in undo and redo functionality has been removed in version 5.x. For related capabilities, please use a plugin to implement.
### API
<Badge type="warning">Change</Badge> **data / save / read / changeData**
Version 5.x offers a completely new data API. For details, see [Data API](/en/api/data).
- The `data` and `changeData` methods from 4.x are replaced by `setData` in 5.x.
- The `save` method from 4.x is replaced by `getData` in 5.x.
- The `read` method from 4.x is replaced by `setData` + `render` in 5.x.
<Badge type="warning">Change</Badge> **get / set**
To access Graph options, please use `getOptions` or the `getXxx` API, such as `getZoomRange`, `getBehaviors`, etc. The `set` method is analogous.
<Badge type="warning">Change</Badge> **getContainer**
Direct API to obtain the container is not currently supported, but you can obtain it through `graph.getCanvas().getContainer()`.
> In most cases, you do not need to directly manipulate the container.
<Badge type="error">Removed</Badge> **getGroup**
<Badge type="warning">Change</Badge> **getMinZoom / getMaxZoom**
Use `getZoomRange` to obtain the values.
<Badge type="warning">Change</Badge> **setMinZoom / setMaxZoom**
Use the `setZoomRange` method to set the values.
<Badge type="warning">Change</Badge> **getWidth / getHeight**
Use `getSize` to get the dimensions.
<Badge type="warning">Change</Badge> **changeSize**
Use `setSize` to set the dimensions.
<Badge type="warning">Change</Badge> **zoom**
Changed to `zoomBy`.
<Badge type="warning">Change</Badge> **translate**
Changed to `translateBy`.
<Badge type="warning">Change</Badge> **moveTo**
Changed to `translateTo`.
<Badge type="warning">Change</Badge> **focusItem**
Changed to `focusElement`.
<Badge type="error">Removed</Badge> **addItem / updateItem / removeItem**
To add or remove elements, use the methods `addData` / `updateData` / `removeData` to manipulate data.
<Badge type="error">Removed</Badge> **refreshItem**
<Badge type="error">Removed</Badge> **refreshPositions**
<Badge type="error">Removed</Badge> **updateCombo**
<Badge type="error">Removed</Badge> **updateCombos**
<Badge type="error">Removed</Badge> **updateComboTree**
<Badge type="warning">Change</Badge> **node / edge / combo**
Use the `setNode` / `setEdge` / `setCombo` methods as alternatives.
<Badge type="warning">Change</Badge> **showItem / hideItem**
Use the `setElementVisibility` method as an alternative.
<Badge type="error">Removed</Badge> **getNodes / getEdges / getCombos / getComboChildren / getNeighbors / find / findById / findAll / findAllByState**
In version 5.x, direct retrieval of element instances is not supported.
- To obtain element data, use the methods `getData`, `getNodeData`, `getEdgeData`, `getComboData`, which support searching by element ID.
- To obtain child node data, use the `getChildrenData` method.
- To obtain neighbor node data, use the `getNeighborNodesData` method.
- To find element data based on state, use the `getElementDataByState` method.
<Badge type="warning">Change</Badge> **collapseCombo / expandCombo**
Use the `collapseElement` / `expandElement` methods as alternatives.
<Badge type="error">Removed</Badge> **collapseExpandCombo**
<Badge type="error">Removed</Badge> **createCombo**
Combos can now be added using the `addData` / `addComboData` methods.
<Badge type="error">Removed</Badge> **uncombo**
Combos can now be removed using the `removeData` / `removeComboData` methods.
<Badge type="warning">Change</Badge> **setItemState**
Use the `setElementState` method as an alternative.
<Badge type="error">Removed</Badge> **clearItemStates**
- To clear all states of a single element: `graph.setElementState(id, [])`
- To clear all states of multiple elements: `graph.setElementState({ id1: [], id2: [] })`
<Badge type="error">Removed</Badge> **priorityState**
When using `setElementState`, the state that appears later in the array has a higher priority.
<Badge type="error">Removed</Badge> **setMode**
Use `setBehaviors` to set the current behaviors.
<Badge type="error">Removed</Badge> **setCurrentMode**
<Badge type="warning">Change</Badge> **layout**
Does not support parameters. To configure the layout, please use `setLayout`.
<Badge type="warning">Change</Badge> **updateLayout**
Changed to `setLayout`.
<Badge type="error">Removed</Badge> **destroyLayout**
<Badge type="warning">Change</Badge> **addBehaviors / removeBehaviors**
Replaced with `setBehaviors`.
<Badge type="error">Removed</Badge> **createHull / getHulls / removeHull / removeHulls**
- For multiple `Hull` instances, you need to configure multiple `hull` plugins in `plugins`, such as:
```typescript
{
plugins: ['hull', 'hull'],
};
```
- Operations to retrieve, update, and remove `Hull` are implemented through `setPlugins`, `updatePlugin`.
<Badge>Not yet available</Badge> **getNodeDegree**
<Badge>Not yet available</Badge> **getShortestPathMatrix**
<Badge>Not yet available</Badge> **getAdjMatrix**
<Badge type="error">Removed</Badge> **pushStack / getUndoStack / getRedoStack / getStackData / clearStack**
All undo and redo related APIs should be called after obtaining the corresponding plugin, for example:
```typescript
// 'history' is the key configured for use with the plugin
const history = graph.getPluginInstance('history');
history.redo();
```
<Badge type="error">Removed</Badge> **positionsAnimate / stopAnimate / isAnimating**
Animation-related information is now emitted through events:
- Animation start event: `beforeanimate`
- Animation end event: `afteranimate`
- To stop an animation:
```typescript
graph.on('beforeanimate', (event) => {
event.animation.stop();
});
```
<Badge type="warning">Change</Badge> **getPointByClient / getClientByPoint / getPointByCanvas / getCanvasByPoint / getGraphCenterPoint / getViewPortCenterPoint**
G6 5.x uses a different coordinate system than 4.x. For details, see [Coordinate](/en/manual/further-reading/coordinate).
<Badge type="error">Removed</Badge> **setTextWaterMarker / setImageWaterMarker**
For watermark functionality, please refer to the [Watermark](/en/api/plugins/watermark)plugin.
<Badge type="warning">Change</Badge> **toFullDataURL**
Replaced with `toDataURL`, specify the parameter as: `mode: 'overall'`
```typescript
graph.toDataURL({ mode: 'overall' });
```
<Badge type="error">Removed</Badge> **downloadFullImage / downloadImage**
Only the capability to export as a `DataURL` is provided. If you need to download an image, please refer to the following example code:
```typescript
async function downloadImage() {
const dataURL = await graph.toDataURL();
const [head, content] = dataURL.split(',');
const contentType = head.match(/:(.*?);/)![1];
const bstr = atob(content);
let length = bstr.length;
const u8arr = new Uint8Array(length);
while (length--) {
u8arr[length] = bstr.charCodeAt(length);
}
const blob = new Blob([u8arr], { type: contentType });
const url = URL.createObjectURL(blob);
const a = document.createElement('a');
a.href = url;
a.download = 'graph.png';
a.click();
}
```
<Badge type="error">Removed</Badge> **clear**
Use `setData` + `draw` to clear data and the canvas.
### Extension Registration
Unlike G6 4.x, G6 5.x uses a unified extension registration function (register). You can refer to the [Extension Register](/en/manual/core-concept/extension#register-extension) to register G6 extensions.
The following G6 4.x registration functions have been deprecated:
- registerNode
- registerEdge
- registerCombo
- registerLayout
- registerBehavior
### Events
Compared to G6 4.x, G6 5.x has the following differences in events:
- The `mouse` and `touch` events have been removed and are unified under the `pointer` event.
- The naming convention for lifecycle events is usually in the format of: `before/after` + `object/property` + `action`, for example: `beforeelementcreate` is triggered before an element is created.
- The following events have been removed:
- afteractivaterelations
- afteradditem
- aftercreateedge
- aftergraphrefresh
- aftergraphrefreshposition
- afteritemrefresh
- aftermodechange
- afterremoveitem
- afterupdateitem
- beforeadditem
- beforecreateedge
- beforegraphrefresh
- beforegraphrefreshposition
- beforeitemrefresh
- beforemodechange
- beforeremoveitem
- beforeupdateitem
- dragnodeend
- nodeselectchange
- stackchange
- tooltipchange
- The following element change events have been removed, but you can still access them through `beforeelementupdate` and `afterelementupdate`:
- afteritemstatechange
- afteritemstatesclear
- afteritemvisibilitychange
- beforeitemstatechange
- beforeitemstatesclear
- beforeitemvisibilitychange
- The following events have been changed:
- The `graphstatechange` event has been changed to `beforeelementstatechange` / `afterelementstatechange`.
- The `viewportchange` event has been changed to `beforetransform` / `aftertransform`.
For a complete list of events, please refer to [Event](/en/api/reference/g6#event).
Whats-new Skill
packages/site/docs/manual/whats-new/upgrade.zh.md anthropic-skill ~2,513 tokens---
title: 升级到 5.0
order: 6
---
本文档将引导你从 G6 `4.x` 版本升级到 `5.x` 版本。如果你使用的是 `3.x` 版本,请先升级到 `4.x` 版本。
## 升级前准备
1. 请确保当前 git 分支是干净的,没有未提交的代码。
2. 参考 [安装](/manual/getting-started/installation) 文档安装 `5.x` 版本,并移除 `4.x` 版本依赖。
## 开始升级
### 数据
新版本的数据格式有所变化,具体如下:
1. `nodes` `edges` `combos` 中所有样式属性都需要放在 `style` 中,`data` 中存放数据属性:
```typescript
// 4.x
const data = {
nodes: [
{ id: 'node1', label: 'node1', size: 20 },
{ id: 'node2', label: 'node2', size: 20 },
],
edges: [{ source: 'node1', target: 'node2' }],
};
// 5.x
const data = {
nodes: [
// label 为非样式属性,放在 data 中,可在样式映射函数中访问
// size 为样式属性,放在 style 中
{ id: 'node1', data: { label: 'node1' }, style: { size: 20 } },
{ id: 'node2', data: { label: 'node2' }, style: { size: 20 } },
],
edges: [{ source: 'node1', target: 'node2' }],
};
```
由于我们重新设计实现了元素,新的元素配置项请参考相应文档进行修改:
- [Node](/manual/element/node/overview)
- [Edge](/manual/element/edge/overview)
- [Combo](/manual/element/combo/overview)
2. 如果要在数据中指定元素类型,可以使用 `type` 属性:
```typescript
{
nodes: [
// 指定节点类型为 rect
{ id: 'node1', type: 'rect' },
];
}
```
### 配置项
<Badge type="warning">变更</Badge> **fitView / fitCenter / fitViewPadding**
- `fitView` 和 `fitCenter` 配置项已经合并为 `autoFit`
- 若要使用 `fitView`,可以配置为 `autoFit: 'view'`
- 若要使用 `fitCenter`,可以配置为 `autoFit: 'center'`
- 也可以传入对象进行完整配置:
```js
autoFit: {
type: 'view',
options: {
// ...
}
}
```
- `fitViewPadding` 已变更为 `padding`
<Badge type="error">移除</Badge> **linkCenter**
5.x 的边连接机制会按照如下顺序依次尝试连接到节点/Combo:
1. 连接桩
2. 轮廓
3. 中心
<Badge type="error">移除</Badge> **groupByTypes**
<Badge type="error">移除</Badge> **autoPaint**
请手动调用 `render` 或 `draw` 方法进行绘制。
<Badge type="warning">变更</Badge> **modes**
5.x 已经移除交互模式,你可以通过设置 `behaviors` 来切换当前启用的交互行为。
```typescript
// 4.x
{
modes: {
default: ['drag-canvas', 'zoom-canvas'],
preview: ['drag-canvas'],
},
}
graph.setMode('preview');
```
```typescript
// 5.x
{
behaviors: ['drag-canvas', 'zoom-canvas'],
}
graph.setBehaviors(['drag-canvas']);
```
<Badge type="warning">变更</Badge> **defaultNode / defaultEdge / defaultCombo**
元素样式已移至 `[element].style` 中,如 `defaultNode` 变更为 `node.style`:
```typescript
// 4.x
{
defaultNode: {
size: 20,
fill: 'red',
}
}
// 5.x
{
node: {
style: {
size: 20,
fill: 'red',
}
}
}
```
<Badge type="warning">变更</Badge> **nodeStateStyles / edgeStateStyles / comboStateStyle**
元素状态样式已移至 `[element].state` 中,如 `nodeStateStyles` 变更为 `node.stateStyles`:
```typescript
// 4.x
{
nodeStateStyles: {
selected: {
fill: 'red',
}
}
}
// 5.x
{
node: {
state: {
selected: {
fill: 'red',
}
}
}
}
```
<Badge type="warning">变更</Badge> **animate / animateCfg**
- `animate` 配置项已变更为 `animation`
- `animate` 和 `animateCfg` 已合并为 `animation`
```typescript
// 4.x
{
animate: true,
}
// 5.x
{
animation: true,
}
{
animation: {
duration: 500,
easing: 'easeLinear',
}
}
```
<Badge type="warning">变更</Badge> **minZoom / maxZoom**
`minZoom` 和 `maxZoom` 已合并为 `zoomRange`
```typescript
// 4.x
{
minZoom: 0.5,
maxZoom: 2,
}
// 5.x
{
zoomRange: [0.5, 2],
}
```
<Badge type="warning">变更</Badge> **renderer**
G6 5.x 支持多层画布,默认使用 `canvas` 渲染。
renderer 不再支持字符串类型,变更为回调函数:
```typescript
// 4.x
var options = {
renderer: 'svg',
};
// 5.x
import { Renderer } from '@antv/g-svg';
{
renderer: () => new Renderer(),
}
```
<Badge type="error">移除</Badge> **enabledStack / maxStep**
5.x 已移除内置撤销重做功能,相关能力请使用插件实现。
### API
<Badge type="warning">变更</Badge> **data / save / read / changeData**
5.x 提供了全新的数据 API,详见 [数据 API](/api/data)。
- 4.x `data` `changeData` 方法使用 5.x `setData` 替代
- 4.x `save` 方法使用 5.x `getData` 替代
- 4.x `read` 方法使用 5.x `setData` + `render` 替代
<Badge type="warning">变更</Badge> **get / set**
若要访问 Graph options,请使用 `getOptions` 或者 `getXxx` API,例如 `getZoomRange` `getBehaviors` 等。 `set` 同理。
<Badge type="warning">变更</Badge> **getContainer**
暂不支持直接获取容器的 API,但可以通过 `graph.getCanvas().getContainer()` 获取。
> 绝大部分情况下,你都不需要直接操作容器。
<Badge type="error">移除</Badge> **getGroup**
<Badge type="warning">变更</Badge> **getMinZoom / getMaxZoom**
使用 `getZoomRange` 获取。
<Badge type="warning">变更</Badge> **setMinZoom / setMaxZoom**
使用 `setZoomRange` 方法设置。
<Badge type="warning">变更</Badge> **getWidth / getHeight**
使用 `getSize` 获取。
<Badge type="warning">变更</Badge> **changeSize**
使用 `setSize` 设置。
<Badge type="warning">变更</Badge> **zoom**
变更为 `zoomBy`。
<Badge type="warning">变更</Badge> **translate**
变更为 `translateBy`。
<Badge type="warning">变更</Badge> **moveTo**
变更为 `translateTo`。
<Badge type="warning">变更</Badge> **focusItem**
变更为 `focusElement`。
<Badge type="error">移除</Badge> **addItem / updateItem / removeItem**
通过 `addData` / `updateData` / `removeData` 方法操作数据来添加或删除元素。
<Badge type="error">移除</Badge> **refreshItem**
<Badge type="error">移除</Badge> **refreshPositions**
<Badge type="error">移除</Badge> **updateCombo**
<Badge type="error">移除</Badge> **updateCombos**
<Badge type="error">移除</Badge> **updateComboTree**
<Badge type="warning">变更</Badge> **node / edge / combo**
使用 `setNode` / `setEdge` / `setCombo` 方法替代。
<Badge type="warning">变更</Badge> **showItem / hideItem**
使用 `setElementVisibility` 方法替代。
<Badge type="error">移除</Badge> **getNodes / getEdges / getCombos / getComboChildren /getNeighbors /find /findById / findAll /findAllByState**
5.x 不支持直接获取元素实例。
- 若要获取元素数据,使用 `getData` `getNodeData` `getEdgeData` `getComboData` 方法,支持传入元素 id 进行查找。
- 获取子节点数据,使用 `getChildrenData` 方法。
- 获取邻居节点数据,使用 `getNeighborNodesData` 方法。
- 基于状态查找元素数据,使用 `getElementDataByState`。
<Badge type="warning">变更</Badge> **collapseCombo / expandCombo**
使用 `collapseElement` / `expandElement` 方法替代。
<Badge type="error">移除</Badge> **collapseExpandCombo**
<Badge type="error">移除</Badge> **createCombo**
通过 `addData` / `addComboData` 方法添加 Combo。
<Badge type="error">移除</Badge> **uncombo**
通过 `removeData` / `removeComboData` 方法移除 Combo。
<Badge type="warning">变更</Badge> **setItemState**
使用 `setElementState` 方法替代。
<Badge type="error">移除</Badge> **clearItemStates**
- 清除单个元素所有状态:`graph.setElementState(id, [])`
- 清除多个元素所有状态:`graph.setElementState({ id1: [], id2: [] })`
<Badge type="error">移除</Badge> **priorityState**
`setElementState` 时状态数组中靠后的状态优先级更高。
<Badge type="error">移除</Badge> **setMode**
使用 `setBehaviors` 来设置当前交互。
<Badge type="error">移除</Badge> **setCurrentMode**
<Badge type="warning">变更</Badge> **layout**
不支持参数,如需配置布局,请使用 `setLayout`。
<Badge type="warning">变更</Badge> **updateLayout**
变更为 `setLayout`。
<Badge type="error">移除</Badge> **destroyLayout**
<Badge type="warning">变更</Badge> **addBehaviors / removeBehaviors**
使用 `setBehaviors` 替代。
<Badge type="error">移除</Badge> **createHull / getHulls / removeHull / removeHulls**
- 多个 `Hull` 需在 `plugins` 中配置多个 `hull` 插件,如:
```typescript
{
plugins: ['hull', 'hull'],
};
```
- `Hull` 的获取、更新、移除操作通过 `setPlugins`, `updatePlugin` 实现。
<Badge>暂未提供</Badge> **getNodeDegree**
<Badge>暂未提供</Badge> **getShortestPathMatrix**
<Badge>暂未提供</Badge> **getAdjMatrix**
<Badge type="error">移除</Badge> **pushStack / getUndoStack / getRedoStack / getStackData / clearStack**
所有撤销重做相关 API 请获取到对应插件后调用 API,例:
```typescript
// 'history' 为使用插件时配置的 key
const history = graph.getPluginInstance('history');
history.redo();
```
<Badge type="error">移除</Badge> **positionsAnimate / stopAnimate / isAnimating**
动画相关信息通过事件抛出:
- 动画开始事件:`beforeanimate`
- 动画结束事件:`afteranimate`
- 停止动画:
```typescript
graph.on('beforeanimate', (event) => {
event.animation.stop();
});
```
<Badge type="warning">变更</Badge> **getPointByClient / getClientByPoint / getPointByCanvas / getCanvasByPoint / getGraphCenterPoint / getViewPortCenterPoint**
G6 5.x 采用了与 4.x 不同的坐标系,详见 [坐标系](/manual/further-reading/coordinate)。
<Badge type="error">移除</Badge> **setTextWaterMarker / setImageWaterMarker**
要使用水印功能,请参考 [水印](/manual/plugin/watermark)插件。
<Badge type="warning">变更</Badge> **toFullDataURL**
使用 `toDataURL` 替代,指定参数为:`mode: 'overall'`
```typescript
graph.toDataURL({ mode: 'overall' });
```
<Badge type="error">移除</Badge> **downloadFullImage / downloadImage**
仅提供导出为 `DataURL` 的能力,如需下载图片,请参考如下实例代码:
```typescript
async function downloadImage() {
const dataURL = await graph.toDataURL();
const [head, content] = dataURL.split(',');
const contentType = head.match(/:(.*?);/)![1];
const bstr = atob(content);
let length = bstr.length;
const u8arr = new Uint8Array(length);
while (length--) {
u8arr[length] = bstr.charCodeAt(length);
}
const blob = new Blob([u8arr], { type: contentType });
const url = URL.createObjectURL(blob);
const a = document.createElement('a');
a.href = url;
a.download = 'graph.png';
a.click();
}
```
<Badge type="error">移除</Badge> **clear**
使用 `setData` + `draw` 清空数据和画布。
### 扩展注册
与 G6 4.x 不同,G6 5.x 使用的统一的扩展注册函数(register),你可以参考 [注册扩展](/manual/graph/extension#注册扩展) 来注册 G6 扩展。
下列 G6 4.x 的注册函数已经废除:
- registerNode
- registerEdge
- registerCombo
- registerLayout
- registerBehavior
### 事件
与 G6 4.x 相比,G6 5.x 的事件但存下如下差异:
- 移除了 `mouse` 和 `touch` 事件,统一使用 `pointer` 事件
- 生命周期事件名命名格式通常为: `before/after` + `对象/属性` + `操作`,例如:`beforeelementcreate` 表示在创建元素前触发
- 下列事件已被移除:
- afteractivaterelations
- afteradditem
- aftercreateedge
- aftergraphrefresh
- aftergraphrefreshposition
- afteritemrefresh
- aftermodechange
- afterremoveitem
- afterupdateitem
- beforeadditem
- beforecreateedge
- beforegraphrefresh
- beforegraphrefreshposition
- beforeitemrefresh
- beforemodechange
- beforeremoveitem
- beforeupdateitem
- dragnodeend
- nodeselectchange
- stackchange
- tooltipchange
- 下列元素变更事件被移除,但你仍可通过 `beforeelementupdate` 和 `afterelementupdate` 获取:
- afteritemstatechange
- afteritemstatesclear
- afteritemvisibilitychange
- beforeitemstatechange
- beforeitemstatesclear
- beforeitemvisibilitychange
- 下列事件有所变更:
- graphstatechange 事件变更为 beforeelementstatechange / afterelementstatechange
- viewportchange 事件变更为 beforetransform / aftertransform
完整的事件列表请参考 [事件](/api/event)。
cli Documentation
packages/cli/README.md plugin-manifest ~236 tokens# @antv/g6-cli
`@antv/g6-cli` is a G6 template generation tool that comes with several templates.
Currently, it owns a built-in template called `extension`. This template handles the boilerplate setup, which encompasses a seamless local development environment, linting, code formatting, Jest for snapshot testing and bundling with Rollup etc.
`@antv/g6-cli` i
## Getting Started
To start using `@antv/g6-cli`, you'll first need to install it globally.
```bash
npm i @antv/g6-cli -g
```
Once installed, you can easily scaffold a new project:
```bash
create-g6
```
Then follow the prompts!

You can also directly specify the project name and the template you want to use via additional command line options. For example, to scaffold a **G6 Extension** project, run:
```bash
create-g6 g6-extension-test --template extension
```
g6-extension-3d Documentation
packages/g6-extension-3d/README.md plugin-manifest ~484 tokens## 3D extension for G6
<img width="300" src="https://mdn.alipayobjects.com/huamei_qa8qxu/afts/img/A*lEL3TrCLnPsAAAAAAAAAAAAADmJ7AQ/original" />
<img width="300" src="https://mdn.alipayobjects.com/huamei_qa8qxu/afts/img/A*yFa5RKilu6kAAAAAAAAAAAAADmJ7AQ/original" />
This extension package provides 3D elements, behaviors and plugins for G6.
## Usage
1. Install
```bash
npm install @antv/g6-extension-3d
```
2. Import and Register
> Where renderer, elements and lighting are necessary
```js
import { ExtensionCategory, register } from '@antv/g6';
import { DragCanvas3D, Light, Line3D, Sphere, renderer } from '@antv/g6-extension-3d';
// 3d light plugin
register(ExtensionCategory.PLUGIN, '3d-light', Light);
// sphere node element
register(ExtensionCategory.NODE, 'sphere', Sphere);
// line edge element
register(ExtensionCategory.EDGE, 'line3d', Line3D);
// drag canvas in 3d scene
register(ExtensionCategory.BEHAVIOR, 'drag-canvas-3d', DragCanvas3D);
// camera setting plugin
register(ExtensionCategory.PLUGIN, 'camera-setting', CameraSetting);
```
3. Use
```js
import { Graph } from '@antv/g6';
const graph = new Graph({
container: 'container',
renderer, // use 3d renderer
data: {
// your data
},
node: {
type: 'sphere', // use sphere node
},
edge: {
type: 'line3d', // use 3d line edge
},
behaviors: ['drag-canvas-3d'],
plugins: [
// set camera configs, see: https://g.antv.antgroup.com/en/api/camera/intro
{
type: 'camera-setting',
projectionMode: 'perspective',
near: 0.1,
far: 1000,
fov: 45,
aspect: 1,
},
// add directional light
{
type: '3d-light',
directional: {
direction: [0, 0, 1],
},
},
],
});
```
## Resources
- [Lite Solar System](https://g6.antv.antgroup.com/en/examples/feature/default/#lite-solar-system)
- [3D Node](https://g6.antv.antgroup.com/en/examples/element/node/#3d-node)
g6-extension-react Documentation
packages/g6-extension-react/README.md plugin-manifest ~372 tokens## React extension for G6
<img width="500" src="https://mdn.alipayobjects.com/huamei_qa8qxu/afts/img/A*rWSiT6dnwfcAAAAAAAAAAAAADmJ7AQ/original" />
This extension allows you to define G6 node by React component and JSX syntax.
## Usage
1. Install
```bash
npm install @antv/g6-extension-react
```
2. Import and Register
```js
import { ExtensionCategory, register } from '@antv/g6';
import { ReactNode } from '@antv/g6-extension-react';
register(ExtensionCategory.NODE, 'react', ReactNode);
```
3. Define Node
React Node:
```jsx
const ReactNode = () => {
return <div>node</div>;
};
```
G Node:
```jsx
import { Group, Rect, Text } from '@antv/g6-extension-react';
const GNode = () => {
return <Group>
<Rect width={100} height={100}></Rect>
<Text text={"node"} />
<Group>
};
```
4. Use
Use ReactNode:
```jsx
const graph = new Graph({
// ... other options
node: {
type: 'react',
style: {
component: () => <ReactNode />,
},
},
});
```
Use GNode:
```jsx
const graph = new Graph({
// ... other options
node: {
type: 'g',
style: {
component: () => <GNode />,
},
},
});
```
## Q&A
1. Difference between ReactNode and GNode
ReactNode is a React component, while GNode support jsx syntax but can only use G tag node.
## Resources
- [React node](https://g6.antv.antgroup.com/examples/element/custom-node/#react-node)
- [G node with JSX syntax](https://g6.antv.antgroup.com/en/examples/element/custom-node/#react-g)
g6-ssr Documentation
packages/g6-ssr/README.md plugin-manifest ~519 tokens## SSR extension for G6 5.0
This extension package provides SSR support for G6 5.0, which supports canvas rendering in server side.
## Usage
### Install
```bash
npm install @antv/g6-ssr
```
### Render in JavaScript API
> For complete options, please refer to [G6 Graph Options](https://g6.antv.antgroup.com/api/graph/option)
```js
import { createGraph } from '@antv/g6-ssr';
const graph = await createGraph({
width: 500,
height: 500,
imageType: 'png', // or 'jpeg'
data: {
// data
},
// other options
});
graph.exportToFile('image');
// -> image.png
graph.toBuffer();
// -> get buffer
```
### Render in CLI
```bash
npx g6-ssr export -i [graph-options].json -o ./image
```
### Export SVG / PDF
When render in JavaScript API, you can pass `outputType` option to export SVG or PDF.
```js
const graph = await createGraph({
width: 500,
height: 500,
data: {
// data
},
outputType: 'svg', // or 'pdf'
// other options
});
```
When render in CLI, you can pass `-t` or `--type` option to export SVG or PDF.
```bash
npx g6-ssr export -i [graph-options].json -o ./file -t pdf
```
### Register Custom G6 Extensions
If you need to register custom extensions of G6, please use the `registry` function exported from `@antv/g6-ssr`.
```js
import { createGraph, registry } from '@antv/g6-ssr';
import { BaseNode, ExtensionCategory } from '@antv/g6';
class CustomNode extends BaseNode {
// custom node
}
registry(ExtensionCategory.Node, 'custom-node', CustomNode);
const graph = await createGraph({
width: 500,
height: 500,
node: {
type: 'custom-node',
// other options
},
// other options
});
```
### Use Plugins
When using G6-SSR, you can also use G render plugins. Here's how to use plugins in server-side rendering:
```js
import { createGraph } from '@antv/g6-ssr';
import { Plugin as RoughCanvasPlugin } from '@antv/g-plugin-rough-canvas-renderer';
const graph = await createGraph({
width: 500,
height: 500,
renderPlugins: [new RoughCanvasPlugin()],
data: {
// data
},
});
```
## License
MIT
hull Documentation
packages/g6/src/plugins/hull/hull/README.md plugin-manifest ~44 tokens> Code copied from [hull-js](https://github.com/hull/hull-js), and fix the issue [[Bug]: hull.js Code Injection Vulnerability #6605](https://github.com/antvis/G6/issues/6605).
Explore Related Technologies & Topics
View All 9,111+ Repositories →Discover similar high-velocity repositories, agent skills, and OpenAPI specifications across the ecosystem.
#data-visualization
Browse data-visualization catalog →
#graph
Browse graph catalog →
#graph-analytics
Browse graph-analytics catalog →
#graph-drawing
Browse graph-drawing catalog →
#graph-visualization
Browse graph-visualization catalog →
#hacktoberfest
Browse hacktoberfest catalog →
🧠 Agent Skills
Prompt & rule files →
⚡ MCP Servers
Model Context Protocol →
🔌 OpenAPI Specs
REST & Swagger schemas →
⚖️ Benchmark
YakaAI vs Alternatives →


 \n\n## Configuration\n\n```js\nconst graph = new Graph({\n layout: {\n type: 'antv-dagre',\n rankdir: 'TB',\n align: 'UL',\n nodesep: 50,\n ranksep: 50,\n controlPoints: false,\n },\n});\n```\n\n## Options\n\n> For more native `dagre` options, refer to the [official documentation](https://github.com/dagrejs/dagre/wiki#configuring-the-layout). Here, only some core and new options are listed.\n\n
 \n\n| Property | Description | Type | Default | Required |\n| -------------- | -------------------------------------------------------------------------------------------------------------------------------------------------------------------------------------------------- | --------------------------------------------------- | ------- | -------- |\n| type | Layout type | `antv-dagre` | - | ✓ |\n| rankdir | Layout direction, options | `TB` \\| `BT` \\| `LR` \\| `RL` | `TB` | |\n| align | Node alignment, options | `UL` \\| `UR` \\| `DL` \\| `DR` | `UL` | |\n| nodesep | Node spacing (px). For `TB` or `BT`, it's horizontal spacing; for `LR` or `RL`, it's vertical spacing. | number | 50 | |\n| nodesepFunc | Callback for node spacing (px), allows different spacing for different nodes. For `TB` or `BT`, it's horizontal spacing; for `LR` or `RL`, it's vertical spacing. Takes precedence over `nodesep`. | (d?: Node) => number | | |\n| ranksep | Rank spacing (px). For `TB` or `BT`, it's vertical spacing between adjacent ranks; for `LR` or `RL`, it's horizontal spacing. | number | 50 | |\n| ranksepFunc | Callback for rank spacing (px), allows different spacing for different ranks. For `TB` or `BT`, it's vertical spacing; for `LR` or `RL`, it's horizontal spacing. Takes precedence over `ranksep`. | (d?: Node) => number | | |\n| ranker | Algorithm for assigning ranks to nodes: `longest-path`, `tight-tree`, or `network-simplex` | `network-simplex` \\| `tight-tree` \\| `longest-path` | - | |\n| nodeSize | Specify node size for all nodes or each node, used for occupying space and spacing calculation | Size \\| ((nodeData: Node) => Size) | - | |\n| controlPoints | Whether to keep edge control points. Only effective when using built-in polyline edges (`type: 'polyline-edge'`) or any edge that consumes `style.controlPoints` as control points | boolean | false | |\n| begin | Top-left alignment position of the layout | [number, number] \\| [number, number, number] | - | |\n| sortByCombo | Whether to sort nodes in the same rank based on `parentId` in each node's data to avoid Combo overlap | boolean | false | |\n| edgeLabelSpace | Whether to reserve space for edge labels | boolean | true | |\n| nodeOrder | Reference array for node order in the same rank, storing node ids | string[] | - | |\n| radial | Whether to use radial layout based on `dagre` | boolean | - | |\n| focusNode | Focus node, only effective when `radial` is true | ID \\| Node \\| null | - | |\n| preset | Reference node positions for layout calculation, usually used to keep transitions smooth when switching data | NodeData[] | - | |\n\n> Note: In G6, the control points computed by `antv-dagre` are written into `edge.style.controlPoints`.\n\n### align\n\n> _DagreAlign_ **Default:** `UL`\n\nNode alignment: U = upper, D = down, L = left, R = right\n\n- `UL`: align to upper left\n- `UR`: align to upper right\n- `DL`: align to lower left\n- `DR`: align to lower right\n\n### rankdir\n\n> _DagreRankdir_ **Default:** `TB`\n\nLayout direction. T = top, B = bottom, L = left, R = right\n\n- `TB`: top to bottom\n- `BT`: bottom to top\n- `LR`: left to right\n- `RL`: right to left\n\n### ranker\n\n> _`network-simplex` \\| `tight-tree` \\| `longest-path`_\n\nLayout mode\n\n### ranksep\n\n> _number_ **Default:** 50\n\nRank spacing (px)\n\nFor 'TB' or 'BT', it's vertical spacing; for 'LR' or 'RL', it's horizontal spacing. `ranksepFunc` has higher priority.\n\n### ranksepFunc\n\n> _(d?: Node) => number_\n\nCallback for rank spacing (px)\n\nFor 'TB' or 'BT', it's vertical spacing; for 'LR' or 'RL', it's horizontal spacing. Takes precedence over nodesep if set.\n\n### nodesep\n\n> _number_ **Default:** 50\n\nNode spacing (px)\n\nFor 'TB' or 'BT', it's horizontal spacing; for 'LR' or 'RL', it's vertical spacing. `nodesepFunc` has higher priority.\n\n### nodesepFunc\n\n> _(d?: Node) => number_\n\nCallback for node spacing (px), allows different spacing for different nodes\n\nFor 'TB' or 'BT', it's horizontal spacing; for 'LR' or 'RL', it's vertical spacing. Takes precedence over nodesep if set.\n\n### begin\n\n> _[number, number] \\| [number, number, number]_ **Default:** undefined\n\nTop-left alignment position of the layout\n\n### controlPoints\n\n> _boolean_ **Default:** false\n\nWhether to keep edge control points. Only effective when using built-in polyline edges (`type: 'polyline-edge'`) or any edge that uses `style.controlPoints` as control points. Adds `style.controlPoints` to edge data.\n\n### edgeLabelSpace\n\n> _boolean_ **Default:** true\n\nWhether to reserve space for edge labels\n\nThis affects whether a dummy node is added in the middle of the edge.\n\n### focusNode\n\n> _ID \\| Node \\| null_\n\nFocus node, only effective when `radial` is true\n\n- ID: node id\n- Node: node instance\n- null: cancel focus\n\n### nodeOrder\n\n> _string[]_ **Default:** undefined\n\nReference array for node order in the same rank, stores node ids\n\nIf not specified, dagre's default order is used.\n\n### nodeSize\n\n> _Size \\| ((nodeData: Node) => Size)_ **Default:** undefined\n\nSpecify node size for all or each node.\n\nUsed for collision detection to prevent node overlap\n\n### preset\n\n> _OutNode[]_ **Default:** undefined\n\nReference node positions for layout calculation\n\nUsually for smooth transitions when switching data. In G6, if updating data, the existing layout result is used as input.\n\n### radial\n\n> _boolean_\n\nWhether to use radial layout based on dagre\n\n### sortByCombo\n\n> _boolean_ **Default:** false\n\nWhether to sort nodes in the same rank by their parentId to prevent Combo overlap\n\nRecommended to enable when using Combo\n\n## Suitable Scenarios\n\n- **Flowcharts**: Suitable for displaying flowcharts, node direction and spacing are automatically handled\n- **Dependency Graphs**: Display dependencies between packages or modules\n- **Task Scheduling Graphs**: Show dependencies and execution order between tasks\n\n## Related Documentation\n\n> The following documents can help you better understand the Dagre layout\n\n- [Graph Layout Algorithms: In-depth Dagre Layout](https://mp.weixin.qq.com/s/EdyTfFUH7fyMefNSBXI2nA)\n- [In-depth Dagre Layout Algorithm](https://www.yuque.com/antv/g6-blog/xxp5nl)\n\n\n\n---\ntitle: AntV Dagre 布局 AntvDagre\norder: 2\n---\n\n## 概述\n\nAntvDagre 在原先[dagre](https://github.com/dagrejs/dagre/wiki)布局的基础上增加了更多有用的设置项,比如`nodeOrder`、`edgeLabelSpace`等等。 `dagre`布局本身一种层次化布局,适用于有向无环图(DAG)的布局场景,能够自动处理节点之间的方向和间距,支持水平和垂直布局。参考更多 Dagre 布局[样例](/examples#layout-dagre)或[源码](https://github.com/dagrejs/dagre/blob/master/lib/layout.js)以及[官方文档](https://github.com/dagrejs/dagre/wiki)。\n\n
 \n\n## Usage Scenarios\n\n- Decision trees: The compact tree layout can visually and intuitively display each decision path.\n- Knowledge graphs: Show hierarchical relationships and connections between concepts. The compact layout can present complex knowledge networks in limited space.\n\n## Configuration\n\n```js\nconst graph = new Graph({\n layout: {\n type: 'compact-box',\n direction: 'LR',\n getHeight: () => 16,\n getWidth: () => 16,\n getVGap: () => 16,\n getHGap: () => 40,\n },\n});\n```\n\n## Options\n\n| Property | Description | Type | Default | Required |\n| --------- | ------------------------------------------------------------------------------------------------------------- | ------------------------------------------------------------ | ------- | -------- |\n| type | Layout type | `compact-box` | - | ✓ |\n| direction | Layout direction, [options](#direction) | `LR` \\| `RL` \\| `TB` \\| `BT` \\| `H` \\| `V` | `LR` | |\n| getSide | Set whether the node is on the left or right of the root. Only works for `H` direction. [See below](#getside) | (d: { data?: [NodeData](/en/manual/data#节点数据nodedata) }) => string | | |\n| getId | Callback for node id | (d?: [NodeData](/en/manual/data#节点数据nodedata)) => string | | |\n| getWidth | Callback for node width | (d?: [NodeData](/en/manual/data#节点数据nodedata)) => number | | |\n| getHeight | Callback for node height | (d?: [NodeData](/en/manual/data#节点数据nodedata)) => number | | |\n| getHGap | Callback for horizontal gap | (d?: [NodeData](/en/manual/data#节点数据nodedata)) => number | | |\n| getVGap | Callback for vertical gap | (d?: [NodeData](/en/manual/data#节点数据nodedata)) => number | | |\n| radial | Whether to enable radial layout, [see below](#radial) | boolean | false | |\n\n### direction\n\n> `LR` \\| `RL` \\| `TB` \\| `BT` \\| `H` \\| `V` **Default:** `LR`\n\nTree layout direction\n\n- `TB`: Root at the top, layout downwards\n- `BT`: Root at the bottom, layout upwards\n- `LR`: Root at the left, layout to the right\n- `RL`: Root at the right, layout to the left\n- `H`: Root in the middle, horizontal symmetric layout. You can use `getSide` to specify the left/right logic for each node\n- `V`: Root in the middle, vertical symmetric layout\n\n### getSide\n\n> _(d: { data?: [NodeData](/en/manual/data#节点数据nodedata) }) => string_\n\nSet whether the node is on the left or right of the root. Only works for `H` direction. If not set, the algorithm will automatically assign left/right. See [getSide auto logic](https://github.com/antvis/hierarchy/blob/d786901874f59d96c47e2a5dfe17b373eefd72e3/src/layout/separate-root.js#L11).\n\nExample:\n\n```javascript\n({ data }) => {\n // data is a node\n if (data.id === 'test-child-id') return 'right';\n return 'left';\n};\n```\n\n### getId\n\n> _(d?: [NodeData](/en/manual/data#节点数据nodedata)) => string_\n\nCallback for node id\n\nExample:\n\n```javascript\n(d) => {\n // d is a node\n return d.id + '_node';\n};\n```\n\n### getWidth\n\n> _(d?: [NodeData](/en/manual/data#节点数据nodedata)) => number_\n\nCallback for node width\n\nExample:\n\n```javascript\n(d) => {\n // d is a node\n if (d.id === 'testId') return 50;\n return 100;\n};\n```\n\n### getHeight\n\n> _(d?: [NodeData](/en/manual/data#节点数据nodedata)) => number_\n\nCallback for node height\n\nExample:\n\n```javascript\n(d) => {\n // d is a node\n if (d.id === 'testId') return 50;\n return 100;\n};\n```\n\n### getHGap\n\n> _(d?: [NodeData](/en/manual/data#节点数据nodedata)) => number_\n\nCallback for horizontal gap\n\nExample:\n\n```javascript\n(d) => {\n // d is a node\n if (d.id === 'testId') return 50;\n return 100;\n};\n```\n\n### getVGap\n\n> _(d?: [NodeData](/en/manual/data#节点数据nodedata)) => number_\n\nCallback for vertical gap\n\nExample:\n\n```javascript\n(d) => {\n // d is a node\n if (d.id === 'testId') return 50;\n return 100;\n};\n```\n\n### radial\n\n> _boolean_\n\nWhether to use radial layout. If `radial` is `true`, it is recommended to set `direction` to `'LR'` or `'RL'`.\n\n
 \n\n## Example Code\n\n```js | ob { inject: true }\nimport { Graph, treeToGraphData } from '@antv/g6';\n\n/**\n * If the node is a leaf node\n * @param {*} d - node data\n * @returns {boolean} - whether the node is a leaf node\n */\nfunction isLeafNode(d) {\n return !d.children || d.children.length === 0;\n}\n\nfetch('https://gw.alipayobjects.com/os/antvdemo/assets/data/algorithm-category.json')\n .then((res) => res.json())\n .then((data) => {\n const graph = new Graph({\n container: 'container',\n autoFit: 'view',\n data: treeToGraphData(data),\n behaviors: ['drag-canvas', 'zoom-canvas', 'drag-element', 'collapse-expand'],\n node: {\n style: {\n labelText: (d) => d.id,\n labelPlacement: (d) => (isLeafNode(d) ? 'right' : 'left'),\n labelBackground: true,\n ports: [{ placement: 'right' }, { placement: 'left' }],\n },\n animation: {\n enter: false,\n },\n },\n edge: {\n type: 'cubic-horizontal',\n animation: {\n enter: false,\n },\n },\n layout: {\n type: 'compact-box',\n direction: 'LR',\n getHeight: function getHeight() {\n return 32;\n },\n getWidth: function getWidth() {\n return 32;\n },\n getVGap: function getVGap() {\n return 10;\n },\n getHGap: function getHGap() {\n return 100;\n },\n },\n });\n\n graph.render();\n });\n```\n\n\n\n---\ntitle: 紧凑树布局 CompactBox\norder: 5\n---\n\n## 概述\n\n紧凑树布局适用于结构化树形数据的展示,基于经典的 [Reingold–Tilford tidy 布局算法](http://emr.cs.iit.edu/~reingold/tidier-drawings.pdf) 演进而来,通过布局时综合考虑每个树节点的包围盒,有效保持树结构的紧凑性与层次清晰。参考更多 CompactBox 布局[样例](/examples#layout-compact-box)和[源码](https://github.com/antvis/hierarchy/blob/master/src/compact-box.js)\n\n
 \n\n- `BT`:根节点在下,往上布局\n\n
  \n\n- `LR`:根节点在左,往右布局\n\n
  \n\n- `RL`:根节点在右,往左布局\n\n
  \n\n- `H`:根节点在中间,水平对称布局。可传入 `getSide` 方法指定每个节点的左右分布逻辑\n\n
  \n\n- `V`:根节点在中间,垂直对称布局\n\n
  \n\n## Core Concepts\n\n### Force System\n\nD3Force3D extends the traditional 2D force-directed layout with the following forces:\n\n- **3D Centering Force**: Pulls nodes toward the center point in 3D space\n- **3D Collision Force**: Prevents node overlap in 3D space\n- **3D Radial Force**: Attracts nodes to a sphere in 3D space\n- **3D Axis Forces**: Applies forces along the X, Y, and Z axes\n\n### Iteration System\n\nThe layout is computed through iterations, mainly involving the following parameters:\n\n- **alpha**: The current energy value of the iteration, controlling node movement speed\n- **alphaDecay**: The decay rate of the energy value\n- **alphaMin**: The minimum energy value; iteration stops below this value\n- **velocityDecay**: The velocity decay factor\n\n## Options\n\n| Property | Description | Type | Default | Required |\n| --------------- | ---------------------------------------------------------------- | -------------------------------------------------------------------------- | ------------- | -------- |\n| type | Layout type | string | `d3-force-3d` | ✓ |\n| nodeSize | Node size (diameter), used for collision detection | number \\| ((node: NodeDatum, index: number, nodes: NodeDatum[]) => number) | - | |\n| iterations | Number of force iterations; higher means more precise but slower | number | - | |\n| numDimensions | Number of dimensions (2 or 3) | number | 3 | |\n| forceSimulation | Custom force simulation method | Simulation
 \n\n## Core Concepts\n\n### Force System\n\nThe D3Force layout simulates five different forces to achieve automatic layout. Imagine a physical world where these forces act simultaneously and eventually reach equilibrium:\n\n
 \n\n> Note: The arrows of different colors in the diagram represent different types of forces. In the actual layout, these forces are invisible and also affected by other forces.\n\n- **Link Force**: Imagine nodes connected by rubber bands, which pull connected nodes to a suitable distance. The tightness of the rubber band is the force strength, and the ideal length is the distance we set.\n- **Many-Body Force**: Similar to magnets, it allows all nodes to attract or repel each other. When the force strength is negative, nodes repel each other (like like poles of magnets); when positive, they attract (like opposite poles). This force determines the density of the graph.\n- **Center Force**: Like all nodes are tied to the center of the canvas by an invisible string. This force prevents nodes from drifting too far and keeps the graph centered.\n- **Collision Force**: Treats nodes as solid balls. When nodes get too close, they automatically bounce apart. This force mainly prevents node overlap and improves readability.\n- **Radial Force**: Imagine an invisible ring that attracts nodes to the ring. By setting the radius and force strength, nodes can form a beautiful circular layout.\n\n### Iteration System\n\nLayout calculation is an iterative process with two key concepts:\n\n#### Alpha Value (Energy)\n\nLike the \"energy\" of the layout, it determines how vigorously nodes move:\n\n- **Initial state**: Alpha = 1, nodes move vigorously\n- **During calculation**: Alpha gradually decreases, node movement slows\n- **End state**: When Alpha < alphaMin, nodes stop moving\n\n#### Iterations\n\nControls the number of times forces are applied in each calculation:\n\n- **Effect**: The larger the value, the more precise the layout, but the slower the computation\n- **Adjustment**:\n - Simple graphs: use the default value\n - Complex graphs: increase the number of iterations as needed\n - Real-time interaction: use fewer iterations\n\n> Tip: Iterations and alpha value work together. Increasing iterations makes each step more precise, while alpha controls the overall progress.\n\n## Options\n\n| Property | Description | Type | Default | Required |\n| --------------- | -------------------------------------------------- | ------------------------------------------ | ---------- | -------- |\n| type | Layout type | string | 'd3-force' | ✓ |\n| centerX | Layout center x coordinate | number | width / 2 | |\n| centerY | Layout center y coordinate | number | height / 2 | |\n| centerStrength | Center force strength | number | - | |\n| nodeSize | Node size (diameter), for collision detection | number \\| ((node, index, nodes) => number) | 10 | |\n| nodeSpacing | Extra spacing between nodes | number \\| ((node, index, nodes) => number) | 0 | |\n| iterations | Number of force iterations, higher is more precise | number | - | |\n| onTick | Callback for each iteration, for real-time results | (data: LayoutMapping) => void | - | |\n| forceSimulation | Custom force simulation, defaults to d3.js method | Simulation
 \n\n- `BT`: Bottom to Top;\n\n
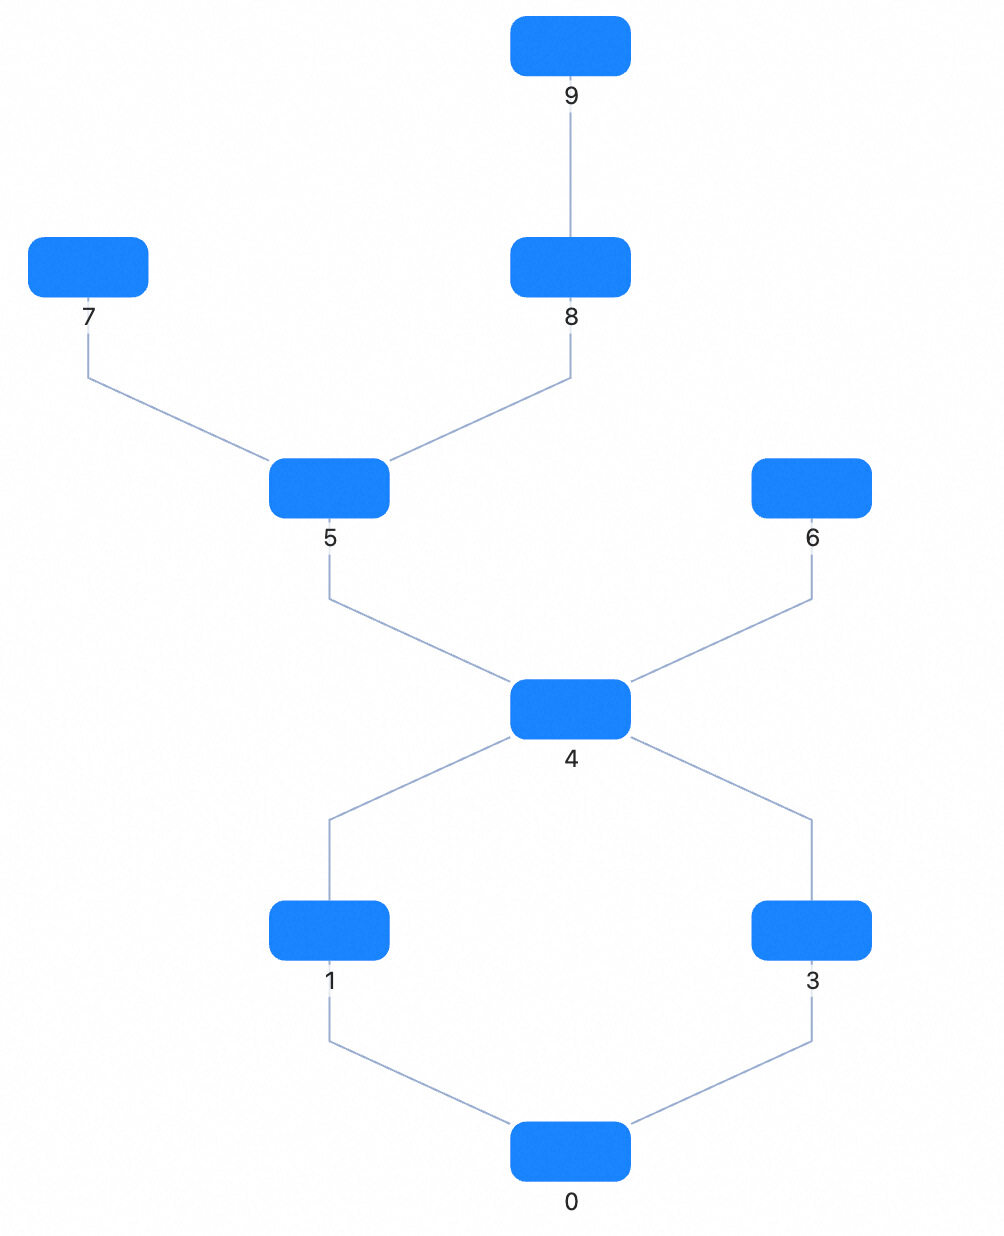 \n\n- `LR`: Left to Right;\n\n
 \n\n- `RL`: Right to Left.\n\n
 \n\n### align\n\n> `UL` | `UR` | `DL` | `DR`, **Default**: `UL`\n\nNode alignment\n\n- `UL`: Upper Left\n- `UR`: Upper Right\n- `DL`: Down Left\n- `DR`: Down Right\n\n### nodesep\n\n> number, **Default**: 50\n\nNode spacing (px). For `TB` or `BT`, it's the horizontal spacing; for `LR` or `RL`, it's the vertical spacing\n\n### ranksep\n\n> number, **Default**: 50\n\nRank spacing (px). For `TB` or `BT`, it's the vertical spacing between ranks; for `LR` or `RL`, it's the horizontal spacing between ranks\n\n### ranker\n\n> `network-simplex` | `tight-tree` | `longest-path`, **Default**: `network-simplex`\n\nAlgorithm for assigning ranks to nodes, supports three algorithms:\n\n- `longest-path`: Uses DFS to recursively find the longest path for each node. Simple and fast, but may result in many long edges.\n- `tight-tree`: An optimization algorithm to reduce the number of long edges. It first uses `longest-path` to compute initial ranks, then adjusts slack edges to build a feasible tree.\n- `network-simplex`: Based on [A Technique for Drawing Directed Graphs](https://www.graphviz.org/documentation/TSE93.pdf), iteratively modifies node ranks to minimize slack edges.\n\n### nodeSize\n\n> number \\| number[] \\| () => (number \\| number[])\n\nG6 custom property, specify node size for all or each node. If a single number, width and height are the same; if array: `[width, height]`\n\n```js\n(d) => {\n // d is a node\n if (d.id === 'testId') return 20;\n return [10, 20];\n};\n```\n\n## Applicable Scenarios\n\n- **Flowcharts**: Suitable for displaying flowcharts, automatically handling direction and spacing between nodes.\n- **Dependency Graphs**: Display dependencies between packages or modules.\n- **Task Scheduling Graphs**: Show dependencies and execution order between tasks.\n\n## Related Documentation\n\n> The following documents can help you better understand Dagre layout\n\n- [Graph Layout Algorithms|Detailed Dagre Layout](https://mp.weixin.qq.com/s/EdyTfFUH7fyMefNSBXI2nA)\n- [In-depth Interpretation of Dagre Layout Algorithm](https://www.yuque.com/antv/g6-blog/xxp5nl)\n\n\n\n---\ntitle: Dagre 布局\norder: 9\n---\n\n## 概述\n\nDagre 是一种层次化布局,适用于有向无环图(DAG)的布局场景,能够自动处理节点之间的方向和间距,支持水平和垂直布局。参考更多 Dagre 布局[样例](/examples#layout-dagre)或[源码](https://github.com/dagrejs/dagre/blob/master/lib/layout.js)以及[官方文档](https://github.com/dagrejs/dagre/wiki)。\n\n
 \n\n## Configuration\n\n```js\nconst graph = new Graph({\n layout: {\n type: 'dendrogram',\n direction: 'LR',\n nodeSep: 30,\n rankSep: 250,\n radial: false,\n },\n});\n```\n\n## Options\n\n
 \n\n| Property | Description | Type | Default | Required |\n| --------- | ------------------------------------------------------ | ------------------------------------------ | ------- | -------- |\n| type | Layout type | `dendrogram` | - | ✓ |\n| direction | Layout direction, [options](#direction) | `LR` \\| `RL` \\| `TB` \\| `BT` \\| `H` \\| `V` | `LR` | |\n| nodeSep | Node spacing, distance between nodes on the same level | number | 20 | |\n| rankSep | Rank spacing, distance between different levels | number | 200 | |\n| radial | Whether to enable radial layout, [see below](#radial) | boolean | false | |\n\n### direction\n\nTree layout direction options:\n\n- `TB`: Root at the top, layout downward\n\n
 \n\n- `BT`: Root at the bottom, layout upward\n\n
 \n\n- `LR`: Root at the left, layout to the right\n\n
 \n\n- `RL`: Root at the right, layout to the left\n\n
 \n\n- `H`: Root in the middle, horizontal symmetric layout\n\n
 \n\n- `V`: Root in the middle, vertical symmetric layout\n\n
 \n\n### radial\n\nWhether to enable radial layout mode. When enabled, nodes are distributed radially around the root node.\n\nIf `radial` is set to `true`, it is recommended to set `direction` to `'LR'` or `'RL'` for best results.\n\n
 \n\n\n\n---\ntitle: 生态树 Dendrogram\norder: 10\n---\n\n## 概述\n\n生态树布局适用于层次聚类数据的可视化,其特点是所有子节点布局在同一层级,不考虑节点大小,每个节点被当成 1px 处理。\n\n
 \n\n## Core Concepts\n\n### Basic Principles of Force-directed Layout\n\nForce-directed layout is a graph layout algorithm based on physical simulation that models nodes and edges as a physical system:\n\n- Nodes are treated as physical particles\n- Edges are treated as springs\n- The entire system reaches its lowest energy state through physical simulation\n\n### Detailed Core Forces\n\n#### Node Repulsion\n\n- **Physical Model**: Coulomb's Law\n- **Function**: Prevents node overlap and ensures more uniform node distribution, where `factor` and `coulombDisScale` control the overall strength and range of repulsion.\n- **Formula**:\n
  \n\n - k: Repulsion coefficient (`factor` / `coulombDisScale²`)\n - q1,q2: Node strength (`nodeStrength`)\n - r: Distance between nodes\n\n#### Edge Attraction\n\n- **Physical Model**: Hooke's Law\n- **Function**: Simulates edge tension, moving nodes along edge directions, where `edgeStrength` and `linkDistance` control edge \"stiffness\" and length.\n- **Formula**:\n
  \n\n - ka: Edge attraction strength (`edgeStrength`)\n - L: Edge length (`linkDistance`)\n - r: Actual edge length\n\n#### Centripetal Force\n\n- **Physical Model**: Newton's Universal Law of Gravitation\n- **Function**: Attracts nodes toward the canvas center or cluster centers, where `gravity` and `center` control gravity strength and center point position\n- **Formula**:\n
  \n\n - G: Gravitational constant (`gravity`)\n - xc: Center point coordinates (`center`)\n - mass: Node mass (`nodeSize`)\n\n#### Interaction of Three Forces\n\n- **Physical Model**: Force interactions, generating acceleration\n- **Function**: Repulsion, edge attraction, and centripetal force work together, affecting node movement through acceleration superposition, ultimately reaching the lowest energy state.\n- **Formula**:\n
  \n\n - v: Velocity\n - a: Acceleration\n - dt: Time step (`interval`)\n - damping: Damping coefficient (`damping`)\n\n- **Function**:\n 1. Controls node movement stability\n 2. Damping coefficient prevents system oscillation\n 3. Time step affects displacement per iteration\n\n#### Node Position Formula\n\n- **Formula**:\n
  \n\n - x: Node position\n - v: Node velocity\n - dt: Time step (`interval`)\n\n- **Function**:\n 1. Updates node position based on velocity\n 2. Ensures motion continuity\n 3. Prevents node overlap through `preventOverlap`\n\n#### Cluster Center Calculation\n\n- **Formula**:\n
  \n\n - n: Number of nodes in cluster\n - (xi,yi): Position of each node\n\n- **Function**:\n 1. Calculates cluster center\n 2. Centripetal force pulls nodes toward their cluster center\n 3. Cluster center can change dynamically\n\n#### Cluster Strength Calculation\n\n- **Formula**:\n
  \n\n - s: Cluster strength (`clusterNodeStrength`)\n - xc: Cluster center\n\n- **Function**:\n 1. Controls cluster compactness\n 2. Higher cluster strength means tighter clusters\n 3. Can be dynamically adjusted based on node properties\n\n#### Mass Effect on Forces\n\n- **Formula**:\n
  \n\n - a: Acceleration\n - F: Force (repulsion, edge attraction, centripetal force)\n - mass: Node mass\n\n- **Function**:\n 1. Nodes with larger mass move less\n 2. Nodes with smaller mass move more\n 3. Mass calculation can be customized through `getMass`\n\n#### Energy Calculation\n\n- **Formula**:\n
  \n\n - m: Node mass\n - v: Node velocity\n\n- **Function**:\n 1. Monitors layout convergence\n 2. System stabilizes when energy approaches zero\n\n#### System Convergence Condition\n\n- **Formula**:\n
  \n\n- **Function**:\n 1. Controls iteration count\n 2. Stops when movement is below threshold\n 3. Can choose between mean, maximum, or minimum through `distanceThresholdMode`\n\n### Force Interaction Diagram\n\n```mermaid\ngraph TD\n A[Input] --> B[Initialize Parameters];\n B --> C[Build Layout Calculation];\n C --> D[Iterative Calculation];\n D --> E{Converged?};\n E -->|Yes| F[Output Layout];\n E -->|No| G[Calculate Repulsion];\n G --> H[Calculate Edge Attraction];\n H --> I[Calculate Centripetal Force];\n I --> J[Update Velocity];\n J --> K[Update Position];\n K --> D;\n```\n\n
 \n\n## Configuration Options\n\nBased on the physical characteristics of force-directed layout, the following configuration options are available:\n\n### Basic Configuration\n\n| Property | Description | Default Value | Required |\n| --------------------- | -------------------------------------------------------------------------------------------------------------------------------------------------------------------------------------------------------------------------------------------------- | ------------- | -------- |\n| type | Layout type | `force` | ✓ |\n| dimensions | Layout dimensions, 2 for 2D layout, 3 for 3D layout | 2 | |\n| width | Layout width | Canvas width | |\n| height | Layout height | Canvas height | |\n| center | Layout center point | Graph center | |\n| maxIteration | Maximum iteration count, if 0 will auto-adjust | 0 | |\n| minMovement | Stop iteration when average movement distance is less than 0.4 | 0.4 | |\n| distanceThresholdMode | Movement distance calculation mode: mean: stop when average movement distance is less than `minMovement`; max: stop when maximum movement distance is less than `minMovement`; min: stop when minimum movement distance is less than `minMovement` | `mean` | |\n| maxDistance | Maximum distance | | |\n\n### Force-related Configuration\n\n#### Repulsion Configuration\n\n| Property | Description | Default Value | Required |\n| --------------- | --------------------------------------------------------------------------------------------------- | ------------- | -------- |\n| nodeStrength | Node force, positive values represent attraction between nodes, negative values represent repulsion | 1000 | |\n| factor | Repulsion coefficient, larger values mean stronger repulsion | 1 | |\n| coulombDisScale | Coulomb coefficient, a factor for repulsion, larger values mean stronger repulsion between nodes | 0.005 | |\n\n#### Edge Attraction Configuration\n\n| Property | Description | Default Value | Required |\n| ------------ | -------------------------------------------------------------------------------------------------------------- | ------------- | -------- |\n| edgeStrength | Edge force (attraction) strength, fixed force or callback function to dynamically return different edge forces | 500 | |\n| linkDistance | Edge length, fixed length or callback function to dynamically return different edge lengths | 200 | |\n\n#### Centripetal Force Configuration\n\n| Property | Description | Default Value | Required |\n| ------------------ | -------------------------------------------------------------------------------------------------------------------------------------------------------------------------------------------------------------------------------------------------------------------- | ------------- | -------- |\n| gravity | Center force strength, the force attracting all nodes to the center. Larger values mean more compact layout | 10 | |\n| centripetalOptions | Centripetal force configuration, including center and strength for leaf nodes, isolated nodes, and other nodes. leaf: leaf node centripetal force; single: single node centripetal force; others: other node centripetal force; center: custom center point function | [0, 0] | |\n\n#### Clustering Configuration\n\n| Property | Description | Default Value | Required |\n| ------------------- | ------------------------------------------------------------------------------------------------------------------------------------------------------------------------------------------------------------------------------------------------------------------------------------------------------------------------------------------------------------- | ------------- | -------- |\n| clustering | Whether to cluster all nodes. If true, will use the field specified by nodeClusterBy in node data for clustering. centripetalOptions.single, centripetalOptions.leaf, and centripetalOptions.others will use the value returned by getClusterNodeStrength; leaf and centripetalOptions.center will use the average center of all nodes in the current cluster | `false` | |\n| nodeClusterBy | Specifies the field name in node data for clustering. Takes effect when clustering is true. Automatically generates centripetalOptions, can be used with clusterNodeStrength | | |\n| clusterNodeStrength | Used with clustering and nodeClusterBy to specify the strength of the cluster centripetal force | | |\n| leafCluster | Whether to cluster leaf nodes. If true, centripetalOptions.single will be 100; centripetalOptions.leaf will use the value returned by getClusterNodeStrength; getClusterNodeStrength.center will return the average center of all leaf nodes | false | |\n\n#### Performance and Optimization Configuration\n\n| Property | Description | Default Value | Required |\n| --------------- | ------------------------------------------------------------------------------------------------------------------------------------------------------------------------------------------------------------------------------------------------------------------------- | ------------- | -------- |\n| damping | Damping coefficient, range [0, 1]. Larger values mean slower speed decrease | 0.9 | |\n| maxSpeed | Maximum movement length per iteration | 200 | |\n| interval | Controls the movement speed of each node per iteration | 0.02 | |\n| preventOverlap | Whether to prevent overlap. Must be used with nodeSize or data.size in node data. Only when data.size is set in the data or nodeSize is configured in the layout with the same value as the node size in the graph, collision detection for node overlap can be performed | true | |\n| nodeSize | Node size (diameter). Used for collision detection to prevent node overlap. Fixed size or callback function to dynamically return node size | | |\n| nodeSpacing | Takes effect when preventOverlap is true. Minimum spacing between node edges to prevent overlap. Can be a callback to set different spacing for different nodes | | |\n| collideStrength | Strength of anti-overlap force, range [0, 1] | 1 | |\n\n#### Other Configuration\n\n| Property | Description | Default Value | Required |\n| --------- | ---------------------------------------------------------------------------------------------------------------------------------------------------------------------------------------- | ------------- | -------- |\n| getMass | Callback for the mass of each node. The parameter is the node's internal data, and the return value is the mass | | |\n| getCenter | Callback for the x, y, and strength of the centripetal force for each node. If not specified, no extra centripetal force is applied | | |\n| onTick | Callback for each iteration | | |\n| monitor | Callback for monitoring each iteration. energy indicates the convergence energy of the layout. May incur extra computation if configured; if not configured, no computation is performed | | |\n\n## Code Examples\n\n### Basic Usage\n\n```js\nconst graph = new Graph({\n container: 'container',\n layout: {\n type: 'force',\n // Prevent node overlap\n preventOverlap: true,\n // Node size\n nodeSize: 20,\n // Layout width\n width: 800,\n // Layout height\n height: 600,\n },\n});\n```\n\n### Preventing Node Overlap\n\n```js\nconst graph = new Graph({\n layout: {\n type: 'force',\n // Prevent node overlap\n preventOverlap: true,\n // Node size\n nodeSize: 20,\n },\n});\n```\n\n### Force-directed Layout\n\nThis example demonstrates how to create a basic force-directed graph using force-directed layout.\n\n```js\nimport { Graph, NodeEvent } from '@antv/g6';\n\nconst data = {\n nodes: [\n { id: 'node1', label: 'Node 1', size: 30 },\n { id: 'node2', label: 'Node 2', size: 20 },\n { id: 'node3', label: 'Node 3', size: 20 },\n { id: 'node4', label: 'Node 4', size: 20 },\n { id: 'node5', label: 'Node 5', size: 30 },\n { id: 'node6', label: 'Node 6', size: 20 },\n ],\n edges: [\n { source: 'node1', target: 'node2' },\n { source: 'node1', target: 'node3' },\n { source: 'node2', target: 'node4' },\n { source: 'node3', target: 'node4' },\n { source: 'node4', target: 'node5' },\n { source: 'node5', target: 'node6' },\n ],\n};\n\nconst graph = new Graph({\n container: 'container',\n data,\n autoFit: 'view',\n modes: {\n default: ['drag-canvas', 'zoom-canvas'],\n },\n layout: {\n type: 'force',\n // Prevent node overlap\n preventOverlap: true,\n // Node size\n nodeSize: 20,\n // Centripetal force\n gravity: 0.9,\n // Iteration count\n iterations: 100,\n },\n node: {\n style: {\n size: (d) => d.size,\n fill: '#9EC9FF',\n stroke: '#69C8FF',\n label: (d) => d.label,\n labelPlacement: 'center',\n labelFill: '#333',\n },\n },\n edge: {\n style: {\n stroke: '#e2e2e2',\n },\n },\n});\n\ngraph.on(NodeEvent.CLICK, async (e) => {\n const nodeId = e.target.id;\n graph.updateNodeData([{ id: nodeId, size: 200 }]);\n await graph.render();\n});\n\ngraph.render();\n```\n\nKey configuration explanations:\n\n- `preventOverlap`: Enable node overlap detection\n- `nodeSize`: Set node size\n- `gravity`: Set node centripetal force\n- `iterations`: Set layout calculation precision\n\nYou can also refer to [View Examples](https://g6.antv.antgroup.com/examples/layout/force-directed/#force) for more usage examples.\n\n\n\n---\ntitle: Force 力导向布局\norder: 13\n---\n\n## 概述\n\n力导向布局是一种基于物理模拟的图布局算法,它通过模拟节点间的引力和斥力来确定节点的位置。这种布局方式特别适合展示复杂的关系网络,如社交网络、知识图谱等。\n\n力导向布局会自动计算并调整节点位置,使得相连的节点保持适当的距离,同时尽量减少边的交叉。布局过程中会模拟物理系统,节点会像带电粒子一样相互排斥,边则像弹簧一样连接节点。\n\n力导向布局的主要特点包括:\n\n1. **自动排列**:不需要手动设置节点位置,系统会自动找到合适的位置\n2. **实时调整**:当你拖动某个节点时,其他节点会实时跟随调整位置\n3. **灵活配置**:\n - 可以调整节点间的吸引力和排斥力\n - 可以设置边的长度\n - 可以防止节点重叠\n4. **动画效果**:节点移动时会有平滑的动画,让变化更自然\n\n
 \n\n## 配置项\n\n根据上述力导向布局的物理特性,有以下配置项:\n\n### 基础配置\n\n| 属性 | 描述 | 默认值 | 必选 |\n| --------------------- | ------------------------------------------------------------------------------------------------------------------------------------------------------------ | -------- | ---- |\n| type | 布局类型 | `force` | ✓ |\n| dimensions | 布局维度,2表示2D布局,3表示3D布局 | 2 | |\n| width | 布局宽度 | 画布宽度 | |\n| height | 布局高度 | 画布高度 | |\n| center | 布局的中心点 | 图中心 | |\n| maxIteration | 最大迭代次数,若为 0 则将自动调整 | 0 | |\n| minMovement | 当平均移动距离小于0.4时停止迭代 | 0.4 | |\n| distanceThresholdMode | 移动距离的计算模式:mean: 平均移动距离小于 `minMovement` 时停止迭代;max: 最大移动距离小于时 `minMovement` 时停止迭代;min: 最小移动距离小于时 `minMovement` | `mean` | |\n| maxDistance | 最大距离 | | |\n\n### 力相关配置\n\n#### 斥力配置\n\n| 属性 | 描述 | 默认值 | 必选 |\n| --------------- | ------------------------------------------------------------------ | ------ | ---- |\n| nodeStrength | 节点作用力,正数代表节点之间的引力作用,负数代表节点之间的斥力作用 | 1000 | |\n| factor | 斥力系数,数值越大,斥力越大 | 1 | |\n| coulombDisScale | 库伦系数,斥力的一个系数,数字越大,节点之间的斥力越大 | 0.005 | |\n\n#### 边拉力配置\n\n| 属性 | 描述 | 默认值 | 必选 |\n| ------------ | ------------------------------------------------------------------ | ------ | ---- |\n| edgeStrength | 边的作用力(引力)大小,固定作用力或回调函数动态返回不同边的作用力 | 500 | |\n| linkDistance | 边的长度,固定长度或回调函数动态返回不同边的长度 | 200 | |\n\n#### 向心力配置\n\n| 属性 | 描述 | 默认值 | 必选 |\n| ------------------ | ------------------------------------------------------------------------------------------------------------------------------------------------------------ | ------ | ---- |\n| gravity | 向中心力大小,指所有节点被吸引到 center 的力。数字越大,布局越紧凑 | 10 | |\n| centripetalOptions | 向心力配置,包括叶子节点、离散点、其他节点的向心中心及向心力大小。leaf: 叶子节点向心力;single: 单点向心力;others: 其他节点向心力;center: 自定义中心点函数 | [0, 0] | |\n\n#### 聚类配置\n\n| 属性 | 描述 | 默认值 | 必选 |\n| ------------------- | --------------------------------------------------------------------------------------------------------------------------------------------------------------------------------------------------------------------------------------------------------------------------------------------------------- | ------- | ---- |\n| clustering | 是否需要全部节点聚类,若为 `true`,将使用 `nodeClusterBy` 配置的节点数据中的字段作为聚类依据。 `centripetalOptions.single`、`centripetalOptions.leaf`、`centripetalOptions.others` 将使用 `getClusterNodeStrength` 返回值;`leaf`、`centripetalOptions.center` 将使用当前节点所属聚类中所有节点的平均中心 | `false` | |\n| nodeClusterBy | 指定节点数据中的字段名称作为节点聚类的依据,`clustering` 为 true 时生效,自动生成 `centripetalOptions`,可配合 `clusterNodeStrength` 使用 | | |\n| clusterNodeStrength | 配合 `clustering` 和 `nodeClusterBy` 使用,指定聚类向心力的大小 | | |\n| leafCluster | 是否需要叶子节点聚类,若为 `true`,则 `centripetalOptions.single` 将为 100;`centripetalOptions.leaf` 将使用 `getClusterNodeStrength` 返回值;`getClusterNodeStrength.center` 将为叶子节点返回当前所有叶子节点的平均中心 | false | |\n\n#### 性能与优化配置\n\n| 属性 | 描述 | 默认值 | 必选 |\n| --------------- | ---------------------------------------------------------------------------------------------------------------------------------------------------------------------------------------------- | ------ | ---- |\n| damping | 阻尼系数,取值范围 [0, 1]。数字越大,速度降低得越慢 | 0.9 | |\n| maxSpeed | 一次迭代的最大移动长度 | 200 | |\n| interval | 控制每个迭代节点的移动速度 | 0.02 | |\n| preventOverlap | 是否防止重叠,必须配合下面属性 `nodeSize` 或节点数据中的 `data.size` 属性,只有在数据中设置了 `data.size` 或在该布局中配置了与当前图节点大小相同的 `nodeSize` 值,才能够进行节点重叠的碰撞检测 | true | |\n| nodeSize | 节点大小(直径)。用于防止节点重叠时的碰撞检测,固定大小或者回调函数动态返回节点大小 | | |\n| nodeSpacing | `preventOverlap` 为 `true` 时生效, 防止重叠时节点边缘间距的最小值。可以是回调函数, 为不同节点设置不同的最小间距 | | |\n| collideStrength | 防止重叠的力强度,范围 [0, 1] | 1 | |\n\n#### 其他配置\n\n| 属性 | 描述 | 默认值 | 必选 |\n| --------- | --------------------------------------------------------------------------------------------------------------------------------------------------------------------------------------------------- | ------ | ---- |\n| getMass | 获取节点质量的回调函数,入参为节点内部流转数据,用于计算节点质量大小 | | |\n| getCenter | 每个节点中心力的 x、y、强度的回调函数,若不指定,则没有额外中心力 | | |\n| onTick | 每一次迭代的回调函数 | | |\n| monitor | 每个迭代的监控信息回调,energy 表示布局的收敛能量。若配置可能带来额外的计算能量性能消耗,不配置则不计算。入参为迭代监控信息 `{ energy: number; nodes: Node[]; edges: Edge[]; iterations: number; }` | | |\n\n## 代码示例\n\n### 基础用法\n\n```js\nconst graph = new Graph({\n container: 'container',\n layout: {\n type: 'force',\n // 防止节点重叠\n preventOverlap: true,\n // 节点大小\n nodeSize: 20,\n // 布局宽度\n width: 800,\n // 布局高度\n height: 600,\n },\n});\n```\n\n### 防止节点重叠\n\n```js\nconst graph = new Graph({\n layout: {\n type: 'force',\n // 防止节点重叠\n preventOverlap: true,\n // 节点大小\n nodeSize: 20,\n },\n});\n```\n\n### 力导向布局\n\n该示例展示了如何使用力导向布局创建一个基础的力导向图。\n\n```js\nimport { Graph, NodeEvent } from '@antv/g6';\n\nconst data = {\n nodes: [\n { id: 'node1', label: 'Node 1', size: 30 },\n { id: 'node2', label: 'Node 2', size: 20 },\n { id: 'node3', label: 'Node 3', size: 20 },\n { id: 'node4', label: 'Node 4', size: 20 },\n { id: 'node5', label: 'Node 5', size: 30 },\n { id: 'node6', label: 'Node 6', size: 20 },\n ],\n edges: [\n { source: 'node1', target: 'node2' },\n { source: 'node1', target: 'node3' },\n { source: 'node2', target: 'node4' },\n { source: 'node3', target: 'node4' },\n { source: 'node4', target: 'node5' },\n { source: 'node5', target: 'node6' },\n ],\n};\n\nconst graph = new Graph({\n container: 'container',\n data,\n autoFit: 'view',\n modes: {\n default: ['drag-canvas', 'zoom-canvas'],\n },\n layout: {\n type: 'force',\n // 防止节点重叠\n preventOverlap: true,\n // 节点大小\n nodeSize: 20,\n // 向心力\n gravity: 0.9,\n // 迭代次数\n iterations: 100,\n },\n node: {\n style: {\n size: (d) => d.size,\n fill: '#9EC9FF',\n stroke: '#69C8FF',\n label: (d) => d.label,\n labelPlacement: 'center',\n labelFill: '#333',\n },\n },\n edge: {\n style: {\n stroke: '#e2e2e2',\n },\n },\n});\n\ngraph.on(NodeEvent.CLICK, async (e) => {\n const nodeId = e.target.id;\n graph.updateNodeData([{ id: nodeId, size: 200 }]);\n await graph.render();\n});\n\ngraph.render();\n```\n\n主要配置说明:\n\n- `preventOverlap`: 开启节点重叠检测\n- `nodeSize`: 设置节点大小\n- `gravity`: 设置节点向心力\n- `iterations`: 设置布局计算的精确程度\n\n还可以参考 [查看示例](https://g6.antv.antgroup.com/examples/layout/force-directed/#force) 获取更多用法。\n\n\n\n---\ntitle: Fruchterman Force-directed Layout\norder: 14\n---\n\n## Overview\n\nThe Fruchterman layout is a force-directed layout based on the algorithm from [Graph Drawing by Force-directed Placement](https://www.mathe2.uni-bayreuth.de/axel/papers/reingold:graph_drawing_by_force_directed_placement.pdf). By flexibly configuring parameters to simulate physical forces, the layout automatically reaches a stable equilibrium state with minimal energy. It supports both basic uniform distribution and cluster layouts. See more Fruchterman force-directed layout [examples](/en/examples#layout-fruchterman) and [source code](https://github.com/antvis/layout/blob/v5/packages/layout/src/fruchterman.ts).\n\n## Use Cases\n\n- Basic uniform distribution: Suitable for displaying network graphs with evenly distributed nodes and clear overall structure, such as network topology and knowledge graphs.\n- Cluster layout: Suitable for visualizing data with internal aggregation or grouping, such as community structure display and association group analysis.\n\n## Options\n\n| Property | Description | Type | Default | Required |\n| ------------ | -------------------------------------------------------------------------------------------------------------------------------------------------------------------------------------------------- | ---------------------------------------------------------------------------------------------------------- | ---------------- | -------- |\n| type | Layout type | `'fruchterman'` | - | ✓ |\n| height | Layout height | `number` | container height | |\n| width | Layout width | `number` | container width | |\n| maxIteration | Maximum number of iterations | `number` | 500 | |\n| minMovement | Convergence threshold | `number` | 0.4 | |\n| gravity | Central force, i.e., the force attracting all nodes to the [center](https://github.com/antvis/layout/blob/v5/packages/layout/src/types.ts#L915). The larger the value, the more compact the layout | `number` | 10 | |\n| speed | Node movement speed per iteration. Too high a speed may cause strong oscillation | `number` | 5 | |\n| onTick | Callback for each iteration | (data: [LayoutMapping](https://github.com/antvis/layout/blob/v5/packages/layout/src/types.ts#L69)) => void | - | |\n\n### Cluster Layout\n\n| Property | Description | Type | Default | Required |\n| -------------- | ----------------------------------------------------------------------------------------- | --------- | ----------- | -------- |\n| clustering | Whether to use cluster layout | `boolean` | `false` | |\n| nodeClusterBy | Field name in node data for clustering, effective when `clustering` is true | `string` | `'cluster'` | |\n| clusterGravity | Gravity within clusters, affects cluster compactness, effective when `clustering` is true | `number` | 10 | |\n\n## Example Code\n\n### Basic Layout\n\n```js | ob { pin: false, inject: true }\nimport { Graph } from '@antv/g6';\n\nconst graph = new Graph({\n container: 'container',\n width: 500,\n height: 250,\n data: {\n nodes: [\n { id: '0' },\n { id: '1' },\n { id: '2' },\n { id: '3' },\n { id: '4' },\n { id: '5' },\n { id: '6' },\n { id: '7' },\n { id: '8' },\n { id: '9' },\n { id: '10' },\n ],\n edges: [\n { source: '0', target: '1' },\n { source: '0', target: '2' },\n { source: '0', target: '3' },\n { source: '0', target: '4' },\n { source: '0', target: '7' },\n { source: '0', target: '8' },\n { source: '0', target: '9' },\n { source: '0', target: '10' },\n { source: '2', target: '3' },\n { source: '4', target: '5' },\n { source: '4', target: '6' },\n { source: '5', target: '6' },\n { source: '9', target: '10' },\n ],\n },\n node: {\n style: {\n labelFill: '#fff',\n labelPlacement: 'center',\n labelText: (d) => d.id,\n },\n },\n layout: {\n type: 'fruchterman',\n gravity: 5,\n speed: 5,\n },\n behaviors: ['drag-canvas', 'drag-element'],\n});\n\ngraph.render();\n```\n\n
 \n\n## Use Cases\n\n- File directory structure visualization\n- Organizational charts\n- Classification system display\n- Tree-like data where hierarchical relationships need to be emphasized\n\n## Configuration Items\n\n> IndentedLayout supports common layout configuration items and specific configuration items, as shown below.\n\n| Property | Description | Type | Default | Required |\n| ---------------------- | ------------------------------------------------------------------- | ------------------------------- | ---------- | -------- |\n| type | Layout type, must be 'indented' | 'indented' | - | ✓ |\n| direction | Layout direction, see details below | 'LR' \\| 'RL' \\| 'H' | 'LR' | |\n| indent | Column spacing, fixed value or function | number \\| (d?: Node) => number | 20 | |\n| getWidth | Get each node's width, effective when direction='H' | (d?: Node) => number | - | |\n| getHeight | Get each node's height | (d?: Node) => number | - | |\n| getSide | Node placement on left/right side of root, overrides direction='H' | (d?: Node) => 'left' \\| 'right' | - | |\n| dropCap | Whether the first child of each node starts on the next line | boolean | true | |\n| isLayoutInvisibleNodes | Whether invisible nodes participate in layout (when preLayout=true) | boolean | false | |\n| nodeFilter | Nodes participating in this layout | (node: NodeData) => boolean | () => true | |\n| preLayout | Use pre-layout, calculate layout before initializing elements | boolean | false | |\n| enableWorker | Whether to run layout in WebWorker | boolean | - | |\n| iterations | Number of iterations for iterative layout | number | - | |\n\n### Complex Type Explanations\n\n- **direction**\n\n - `'LR'`: Root node on the left, layout to the right\n
  \n - `'RL'`: Root node on the right, layout to the left\n
  \n - `'H'`: Root node in the middle, horizontal symmetric layout\n
  \n\n- **indent**\n\n - Fixed value: Consistent indentation for all levels\n - Function: (d?: Node) => number, customize indentation based on node\n - Example:\n ```js\n (d) => {\n if (d.parent?.id === 'testId') return d.parent.x + 50;\n return 100;\n };\n ```\n\n- **getWidth/getHeight**\n\n - Used to customize each node's width/height, often for content adaptation\n - Example:\n ```js\n (d) => (d.id === 'testId' ? 50 : 100);\n ```\n\n- **getSide**\n - Specifies which side of the root node a node should be placed, only effective when direction='H'\n - Example:\n ```js\n (d) => (d.id === 'testId' ? 'left' : 'right');\n ```\n\n## Example Code\n\n> For more examples, see [Online Demo](https://g6.antv.antgroup.com/en/examples/layout/indented)\n\n### Automatic Child Node Distribution\n\n
 \n\n```js\nimport { Graph, treeToGraphData } from '@antv/g6';\n\nfetch('https://gw.alipayobjects.com/os/antvdemo/assets/data/algorithm-category.json')\n .then((res) => res.json())\n .then((data) => {\n const graph = new Graph({\n container: 'container',\n data: treeToGraphData(data),\n autoFit: 'view',\n layout: {\n type: 'indented',\n direction: 'H',\n indent: 80,\n getHeight: () => 16,\n getWidth: () => 32,\n },\n });\n graph.render();\n });\n```\n\n### Right Side Child Node Distribution\n\n
 \n\n```js\n// ... code as above, layout.direction: 'LR'\n```\n\n### Left Side Child Node Distribution\n\n
 \n\n```js\n// ... code as above, layout.direction: 'RL'\n```\n\n### Custom Child Node Distribution\n\n
 \n\n```js\nlayout: {\n type: 'indented',\n direction: 'LR',\n indent: 80,\n getHeight: () => 16,\n getWidth: () => 32,\n dropCap: false,\n}\n```\n\n\n\n---\ntitle: 缩进树 Indented\norder: 16\n---\n\n## 概述\n\nIndented(缩进树)布局是一种通过水平方向的缩进量来表示树节点层级的布局方式。每个元素占据一行或一列,常用于文件目录结构、组织架构等场景。该布局结构清晰,便于展示层级关系。\n\n
 \n\n## Configuration\n\n```js\nconst graph = new Graph({\n layout: {\n type: 'mindmap',\n direction: 'H',\n preLayout: false,\n getHeight: () => 32,\n getWidth: () => 32,\n getVGap: () => 16,\n getHGap: () => 72,\n },\n});\n```\n\n## Options\n\n
 \n\n| Property | Description | Type | Default | Required |\n| --------- | ------------------------------------------------------------------------------------------------------- | ----------------------------------- | ------- | -------- |\n| type | Layout type | `mindmap` | - | ✓ |\n| direction | Layout direction, [options](#direction) | `H` \\| `LR` \\| `RL` \\| `TB` \\| `BT` | `LR` | |\n| getHeight | Function to calculate the height of each node | (d?: Node) => number | | ✓ |\n| getWidth | Function to calculate the width of each node | (d?: Node) => number | | ✓ |\n| getVGap | Vertical gap for each node. Note: the actual vertical gap between two nodes is twice the vgap | (d?: Node) => number | | |\n| getHGap | Horizontal gap for each node. Note: the actual horizontal gap between two nodes is twice the hgap | (d?: Node) => number | | |\n| getSide | Set whether the node is placed on the left or right of the root. Only effective when `direction` is `H` | (d?: Node) => string | | |\n\n### direction\n\n> `H` \\| `LR` \\| `RL` \\| `TB` \\| `BT` **Default:** `'LR'`\n\nTree layout direction\n\n- `'H'`: horizontal — The children of the root node are divided into two parts and placed on the left and right sides of the root node. You can pass the `getSide` method to specify the left/right distribution logic for each node. If not provided, the first half will be placed on the right, and the second half on the left by default.\n\n
 \n\n- `'RL'`: Children are placed on the left side of the root node.\n\n
 \n\n- `BT`: Children are placed on the right side of the root node, then the entire graph is rotated 180° along the X axis.\n\n
 \n\n### getWidth\n\n> _(d?: Node) => number_\n\nWidth of each node\n\nExample:\n\n```javascript\n(d) => {\n // d is a node\n if (d.id === 'testId') return 50;\n return 100;\n};\n```\n\n### getHeight\n\n> _(d?: Node) => number_\n\nHeight of each node\n\nExample:\n\n```javascript\n(d) => {\n // d is a node\n if (d.id === 'testId') return 50;\n return 100;\n};\n```\n\n### getHGap\n\n> _(d?: Node) => number_\n\nHorizontal gap for each node\n\nExample:\n\n```javascript\n(d) => {\n // d is a node\n if (d.id === 'testId') return 50;\n return 100;\n};\n```\n\n### getVGap\n\n> _(d?: Node) => number_\n\nVertical gap for each node\n\nExample:\n\n```javascript\n(d) => {\n // d is a node\n if (d.id === 'testId') return 50;\n return 100;\n};\n```\n\n### getSide\n\n> _(d?: Node) => string_\n\nSet whether the node is placed on the left or right of the root. Note: only effective when `direction` is `H`. If not set, the first half of the children will be placed on the right, and the second half on the left by default. See [getSide auto calculation logic](https://github.com/antvis/hierarchy/blob/d786901874f59d96c47e2a5dfe17b373eefd72e3/src/layout/separate-root.js#L11).\n\nExample:\n\n```javascript\n(d) => {\n // d is a node\n if (d.id === 'test-child-id') return 'right';\n return 'left';\n};\n```\n\n### Suitable Scenarios\n\n- Data lineage graph: `direction='H'` is suitable for rendering upstream and downstream lineage of a specified node, with upstream on the left and downstream on the right of the central node.\n- Mind map: Build custom mind map components.\n\n\n\n---\ntitle: 脑图树 Mindmap\norder: 18\n---\n\n## 概述\n\n脑图树布局适用于树状结构的层次化布局,支持左右两侧展开,深度相同的节点将会被放置在同一层。需要注意:布局**会**考虑节点的大小。参考更多脑图布局[样例](/examples#layout-mindmap)或[源码](https://github.com/antvis/hierarchy/blob/master/src/mindmap.js)。\n\n
 \n\n## Real Cases\n\n- [Basic Radial Layout](/en/examples/layout/radial/#basic)\n- [Strict Overlap Prevention Radial Layout](/en/examples/layout/radial/#strict-prevent-overlap)\n- [Non-strict Overlap Prevention Radial Layout](/en/examples/layout/radial/#non-strict-prevent-overlap)\n- [Cluster Sorting](/en/examples/layout/radial/#cluster-sort)\n\n\n\n---\ntitle: 径向布局 Radial\norder: 19\n---\n\n## 概述\n\n径向(Radial)布局是一种将节点以同心圆方式分层排列的图布局算法,常用于展示层级关系、社群结构等。该布局支持节点防重叠、分组排序等高级特性,适用于多种网络结构的可视化。\n\n## 使用场景\n\n- 展示层级结构(如组织架构、家谱等)\n- 社群结构分析\n- 需要突出中心节点及其辐射关系的场景\n- 需要节点分组、排序的复杂网络\n\n## 在线体验\n\n\n\n## 配置方式\n\n```js\nconst graph = new Graph({\n layout: {\n type: 'radial',\n nodeSize: 32,\n unitRadius: 100,\n linkDistance: 200,\n },\n // 其他配置...\n});\n```\n\n## 配置项\n\n| 属性 | 描述 | 类型 | 默认值 | 必选 |\n| -------------------------- | -------------------------------------------- | ------------------------------------------------ | -------- | ---- |\n| type | 布局类型 | string | `radial` | ✓ |\n| center | 圆心坐标 | [number, number] | - | |\n| focusNode | 辐射中心节点 | string \\| Node \\| null | null | |\n| height | 画布高度 | number | - | |\n| width | 画布宽度 | number | - | |\n| nodeSize | 节点大小(直径) | number \\| number[] \\| ((nodeData: Node) => Size) | - | |\n| nodeSpacing | 节点最小间距(防重叠时生效) | number \\| (nodeData: Node) => number | 10 | |\n| linkDistance | 边长度 | number | 50 | |\n| unitRadius | 每圈半径;为 null 时按布局空间自动计算 | number \\| null | 100 | |\n| maxIteration | 最大迭代次数 | number | 1000 | |\n| maxPreventOverlapIteration | 防重叠最大迭代次数 | number | 200 | |\n| preventOverlap | 是否防止节点重叠 | boolean | false | |\n| sortBy | 同层节点排序字段或排序函数 | string \\| ((nodeData: Node) => number \\| string) | - | |\n| sortStrength | 同层节点排序强度 | number | 10 | |\n| strictRadial | 是否严格每层节点在同一圆环上(防重叠时生效) | boolean | true | |\n\n## 代码示例\n\n### 基本用法\n\n```js\nimport { Graph } from '@antv/g6';\n\nfetch('https://assets.antv.antgroup.com/g6/radial.json')\n .then((res) => res.json())\n .then((data) => {\n const graph = new Graph({\n container: 'container',\n data,\n autoFit: 'center',\n layout: {\n type: 'radial',\n nodeSize: 32,\n unitRadius: 100,\n linkDistance: 200,\n },\n node: {\n style: {\n labelFill: '#fff',\n labelPlacement: 'center',\n labelText: (d) => d.id,\n },\n },\n behaviors: ['drag-canvas', 'drag-element'],\n });\n graph.render();\n });\n```\n\n效果如下:\n\n
 \n\n- A higher bundleThreshold value (e.g., 0.8) will cause fewer edges to be bundled together, maintaining more independent edges.\n\n```js\nconst graph = new Graph({\n plugins: [\n {\n type: 'edge-bundling',\n bundleThreshold: 0.8, // Higher edge compatibility threshold\n },\n ],\n});\n```\n\nThe effect is as follows:\n
 \n\n### K\n\nEdge strength, affects the attraction and repulsion between edges. A higher K value will make the attraction between edges stronger, resulting in a tighter bundling effect.\n\n- A lower K value (e.g., 0.05) will make the attraction between edges weaker, resulting in a weaker bundling effect.\n\n```js\nconst graph = new Graph({\n plugins: [\n {\n type: 'edge-bundling',\n K: 0.05, // Lower edge strength\n },\n ],\n});\n```\n\nThe effect is as follows:\n
 \n\n- A higher K value (e.g., 0.2) will make the attraction between edges stronger, resulting in a more pronounced bundling effect.\n\n```js\nconst graph = new Graph({\n plugins: [\n {\n type: 'edge-bundling',\n K: 0.2, // Higher edge strength\n },\n ],\n});\n```\n\nThe effect is as follows:\n
 \n\n## Code Examples\n\n### Basic Edge Bundling\n\nThe simplest way is to use the preset configuration directly:\n\n```js\nconst graph = new Graph({\n // Other configurations...\n plugins: ['edge-bundling'],\n});\n```\n\n### Custom Styles\n\nYou can customize the parameters of edge bundling as needed:\n\n```js\nconst graph = new Graph({\n // Other configurations...\n plugins: [\n {\n type: 'edge-bundling',\n bundleThreshold: 0.8, // Higher edge compatibility threshold\n cycles: 8, // More simulation cycles\n K: 0.2, // Stronger edge strength\n },\n ],\n});\n```\n\n### Dynamic Update of Edge Bundling\n\nUse the key identifier to dynamically update edge bundling properties at runtime:\n\n```js\n// Initial configuration\nconst graph = new Graph({\n // Other configurations...\n plugins: [\n {\n type: 'edge-bundling',\n key: 'my-edge-bundling',\n bundleThreshold: 0.6,\n },\n ],\n});\n\n// Subsequent dynamic update\ngraph.updatePlugin({\n key: 'my-edge-bundling',\n bundleThreshold: 0.8, // Update edge compatibility threshold\n cycles: 10, // Update number of simulation cycles\n});\n```\n\n## Practical Examples\n\n```js | ob { inject: true }\nimport { Graph } from '@antv/g6';\n\nfetch('https://assets.antv.antgroup.com/g6/circular.json')\n .then((res) => res.json())\n .then((data) => {\n const graph = new Graph({\n container: 'container',\n autoFit: 'view',\n data,\n layout: {\n type: 'circular',\n },\n node: { style: { size: 20 } },\n behaviors: ['drag-canvas', 'drag-element'],\n plugins: [\n {\n key: 'edge-bundling',\n type: 'edge-bundling',\n bundleThreshold: 0.1,\n },\n ],\n });\n\n graph.render();\n });\n```\n\n\n\n---\ntitle: 边绑定 EdgeBundling\norder: 4\n---\n\n## 概述\n\n边绑定(Edge Bundling)是一种图可视化技术,用于减少复杂网络图中的视觉混乱,并展示图中的高级别模式和结构。其目的是将相邻的边捆绑在一起。\n\nG6 中提供的边绑定插件是基于 [FEDB(Force-Directed Edge Bundling for Graph Visualization)](https://classes.engineering.wustl.edu/cse557/readings/holten-edgebundling.pdf)论文的实现:将边建模为可以相互吸引的柔性弹簧,通过自组织的方式进行捆绑。\n\n## 使用场景\n\n边绑定插件主要适用于以下场景:\n\n- 减少复杂网络图中的视觉混乱\n- 揭示图中的高级别模式和结构\n- 提高大规模图数据的可读性和美观性\n\n## 基本用法\n\n以下是一个简单的 EdgeBundling 插件初始化示例:\n\n```js\nconst graph = new Graph({\n plugins: [\n {\n type: 'edge-bundling',\n bundleThreshold: 0.6,\n cycles: 6,\n divisions: 3,\n divRate: 2,\n iterations: 90,\n iterRate: 2 / 3,\n K: 0.1,\n lambda: 0.1,\n },\n ],\n});\n```\n\n## 配置项\n\n| 属性 | 描述 | 类型 | 默认值 | 必选 |\n| --------------- | -------------------------------------------------------------------------------------------------- | ------ | --------------- | ---- |\n| type | 插件类型,用于标识该插件为边捆绑插件 | string | `edge-bundling` | ✓ |\n| key | 插件的唯一标识,可用于获取插件实例或更新插件选项 | string | - | |\n| bundleThreshold | 边兼容性阈值,该值决定了哪些边应该被绑定在一起,值越大,绑定的边越少,[示例](#bundlethreshold) | number | 0.6 | |\n| cycles | 模拟周期数,控制边捆绑模拟的执行轮数 | number | 6 | |\n| divisions | 初始切割点数,在后续的周期中,切割点数将根据 divRate 逐步递增,影响边的细分程度 | number | 1 | |\n| divRate | 切割点数增长率,决定了每一轮周期中切割点数的增长幅度 | number | 2 | |\n| iterations | 指定在第一个周期中执行的迭代次数,在后续的周期中,迭代次数将根据 iterRate 逐步递减,影响模拟的精度 | number | 90 | |\n| iterRate | 迭代次数递减率,控制每一轮周期中迭代次数的减少比例 | number | 2\\/3 | |\n| K | 边的强度,影响边之间的吸引力和排斥力,[示例](#k) | number | 0.1 | |\n| lambda | 初始步长,在后续的周期中,步长将双倍递增,影响边捆绑过程中节点移动的幅度 | number | 0.1 | |\n\n### bundleThreshold\n\n边兼容性阈值,该值决定了哪些边应该被绑定在一起。值越大,绑定的边越少,反之则绑定的边越多。\n\n- 较低的 bundleThreshold 值(如 0.4)会使更多的边被绑定在一起,形成更明显的捆绑效果。\n\n```js\nconst graph = new Graph({\n plugins: [\n {\n type: 'edge-bundling',\n bundleThreshold: 0.4, // 较低的边兼容性阈值\n },\n ],\n});\n```\n\n效果如下:\n
 \n\n
\n\n \n\n
\n\n \n\n **详细说明:**\n\n 1. G6 在每次渲染前计算出 `add`、`update`、`remove`,分别对应为需要新增、更新、移除的元素,以下简称为 `DrawData`\n 2. 此时数据处理介入,按配置顺序执行每个数据处理的 `beforeDraw` 方法,参数则为 `DrawData`\n 3. 数据处理器中,对 `DrawData` 里面的元素数据进行改动,即可以按需对 `add`、`update`、`remove` 里面的元素数据进行修改、移除或者插入元素数据等,最终把改动后的 `DrawData` 返回给渲染主体逻辑\n 4. 在执行数据处理后,执行对应的新增、更新、移除元素的操作,完成渲染\n\n:::info{title=提示}\n触发渲染的场景分为主动和被动,列举如下:\n\n- **主动:** 用户主动调用 `graph.render()` 、 `graph.draw()` 或者在自定义插件、交互等实例里面通过上下文拿到元素控制器( [ElementController](https://github.com/antvis/G6/blob/v5/packages/g6/src/runtime/element.ts) )实例调用 `this.context.element.draw()`,等( `graph.render()` 和 `graph.draw()` 也是调用元素控制器的 `draw` 方法)\n- **被动:** 部分内置交互和插件有触发渲染,布局执行后也有触发渲染更新元素位置,等\n\n:::\n\n- **afterLayout**:在执行完布局计算并开始更新节点位置后,执行数据处理\n\n## 内置数据处理\n\n- **G6 提供给用户的内置数据处理如下:**\n\n各数据处理详细配置可参考 [内置数据处理文档](/manual/transform/map-node-size)。\n\n| 数据处理名称 | 注册类型 | 功能描述 | 执行时机 |\n| --------------------------------------------------- | ------------------------ | ---------------------------------------------------- | ---------- |\n| [动态调整节点大小](/manual/transform/map-node-size) | `map-node-size` | 根据节点中心性调整节点的大小 | beforeDraw |\n| [径向标签](/manual/transform/place-radial-labels) | `place-radial-labels` | 根据径向布局自动调整节点标签样式,包括位置和旋转角度 | afterDraw |\n| [平行边](/manual/transform/process-parallel-edges) | `process-parallel-edges` | 处理平行边,即多条边共享同一源节点和目标节点 | beforeDraw |\n\n- **G6 内嵌的数据处理如下:**\n\n除了提供给用户选用的数据处理外, G6 也封装并使用了以下数据处理机制来实现基础功能。以下数据处理不开放给用户配置使用,默认必带(列举出来供用户有需要时点击查看并参考源码):\n\n| 数据处理名称 | 注册类型 | 功能描述 | 执行时机 |\n| ----------------------------------------------------------------------------------------------------------------------- | ----------------------- | ------------------------------------------------------------------------------------------------------------------------------------------------------------- | ---------- |\n| [调整combo绘制顺序](https://github.com/antvis/G6/blob/v5/packages/g6/src/transforms/arrange-draw-order.ts) | `arrange-draw-order` | combo 嵌套时,优先绘制子 combo | beforeDraw |\n| [处理组合的展开收起](https://github.com/antvis/G6/blob/v5/packages/g6/src/transforms/collapse-expand-combo.ts) | `collapse-expand-combo` | 收起时,移除 combo 内部元素、销毁内部边,外部边则连到收起的 combo 上;
 \n
\n \n\nThis extension package provides 3D elements, behaviors and plugins for G6.\n\n## Usage\n\n1. Install\n\n```bash\nnpm install @antv/g6-extension-3d\n```\n\n2. Import and Register\n\n> Where renderer, elements and lighting are necessary\n\n```js\nimport { ExtensionCategory, register } from '@antv/g6';\nimport { DragCanvas3D, Light, Line3D, Sphere, renderer } from '@antv/g6-extension-3d';\n\n// 3d light plugin\nregister(ExtensionCategory.PLUGIN, '3d-light', Light);\n// sphere node element\nregister(ExtensionCategory.NODE, 'sphere', Sphere);\n// line edge element\nregister(ExtensionCategory.EDGE, 'line3d', Line3D);\n// drag canvas in 3d scene\nregister(ExtensionCategory.BEHAVIOR, 'drag-canvas-3d', DragCanvas3D);\n// camera setting plugin\nregister(ExtensionCategory.PLUGIN, 'camera-setting', CameraSetting);\n```\n\n3. Use\n\n```js\nimport { Graph } from '@antv/g6';\n\nconst graph = new Graph({\n container: 'container',\n renderer, // use 3d renderer\n data: {\n // your data\n },\n node: {\n type: 'sphere', // use sphere node\n },\n edge: {\n type: 'line3d', // use 3d line edge\n },\n behaviors: ['drag-canvas-3d'],\n plugins: [\n // set camera configs, see: https://g.antv.antgroup.com/en/api/camera/intro\n {\n type: 'camera-setting',\n projectionMode: 'perspective',\n near: 0.1,\n far: 1000,\n fov: 45,\n aspect: 1,\n },\n // add directional light\n {\n type: '3d-light',\n directional: {\n direction: [0, 0, 1],\n },\n },\n ],\n});\n```\n\n## Resources\n\n- [Lite Solar System](https://g6.antv.antgroup.com/en/examples/feature/default/#lite-solar-system)\n- [3D Node](https://g6.antv.antgroup.com/en/examples/element/node/#3d-node)\n\n\n\n## React extension for G6\n\n
 \n\nThis extension allows you to define G6 node by React component and JSX syntax.\n\n## Usage\n\n1. Install\n\n```bash\nnpm install @antv/g6-extension-react\n```\n\n2. Import and Register\n\n```js\nimport { ExtensionCategory, register } from '@antv/g6';\nimport { ReactNode } from '@antv/g6-extension-react';\n\nregister(ExtensionCategory.NODE, 'react', ReactNode);\n```\n\n3. Define Node\n\nReact Node:\n\n```jsx\nconst ReactNode = () => {\n return