

Repository: plasma-umass/scalene
Stars: 13367
CLAUDE.md
Scalene Development Guide
Project Overview
Scalene is a high-performance CPU, GPU, and memory profiler for Python with AI-powered optimization proposals. It runs significantly faster than other Python profilers while providing detailed performance information. See the paper docs/osdi23-berger.pdf for technical details on Scalene's design.
Key features:
- CPU, GPU (NVIDIA/Apple), and memory profiling
- AI-powered optimization suggestions (OpenAI, Anthropic, Azure, Amazon Bedrock, Gemini, Ollama)
- Web-based GUI and CLI interfaces
- Jupyter notebook support via magic commands (%scrun, %%scalene)
- Line-by-line profiling with low overhead
- Separates Python time from native/C time
Platform support: Linux, macOS, WSL 2 (full support); Windows (partial support)
Build & Test Commands
Install in development mode
pip install -e .Run all tests
python3 -m pytest tests/Run tests for a specific Python version
python3.X -m pytest tests/Run linters
mypy scalene
ruff check scaleneRun a single test file
python3 -m pytest tests/test_coverup_83.py -vProject Structure
Core Profiler Components (scalene/)
- scalene_profiler.py - Main profiler class (Scalene). Entry point for profiling. Uses signal-based sampling for CPU profiling. Coordinates all profiling subsystems.
- scalene_statistics.py - ScaleneStatistics class. Collects and aggregates profiling data. Key types: ProfilingSample, MemcpyProfilingSample. Uses RunningStats for statistical aggregation.
- scalene_output.py - Profile output formatting for CLI/HTML
- scalene_json.py - ScaleneJSON class for JSON output format
- scalene_analysis.py - Profile analysis logic
Entry Points
- __main__.py - Entry point for python -m scalene
- profile.py - Entry point for --on/--off control of background profiling
Configuration & Arguments
- scalene_config.py - Version info (scalene_version, scalene_date) and constants:
- SCALENE_PORT = 11235 - Default port for web UI
- NEWLINE_TRIGGER_LENGTH - Must match src/include/sampleheap.hpp
- scalene_arguments.py - ScaleneArguments class (extends argparse.Namespace) with all profiler options and their defaults defined in ScaleneArgumentsDict
- scalene_parseargs.py - ScaleneParseArgs.parse_args() builds the argument parser. RichArgParser provides colored help output (uses Rich on Python < 3.14, native argparse colors on 3.14+)
Signal Handling
- scalene_signals.py - Signal definitions for CPU sampling
- scalene_signal_manager.py - Manages signal handlers
- scalene_sigqueue.py - Signal queue management
- scalene_client_timer.py - Timer for periodic profiling
GPU Support
- scalene_nvidia_gpu.py - NVIDIA GPU profiling via pynvml
- scalene_apple_gpu.py - Apple GPU profiling (Metal)
- scalene_accelerator.py - Generic accelerator interface
- scalene_neuron.py - AWS Neuron support
Memory Profiling
- scalene_memory_profiler.py - Memory profiling logic
- scalene_leak_analysis.py - Memory leak detection (experimental, --memory-leak-detector)
- scalene_mapfile.py - ScaleneMapFile for memory-mapped communication with native extension
- scalene_preload.py - Sets up LD_PRELOAD/DYLD_INSERT_LIBRARIES for native memory tracking
Jupyter Integration
- scalene_magics.py - Jupyter magic commands (%scrun for line mode, %%scalene for cell mode)
- scalene_jupyter.py - Jupyter notebook support utilities
Replacement Modules (replacement_.py)
These modules monkey-patch standard library functions to capture profiling data during blocking operations:
- replacement_fork.py - Tracks os.fork()
- replacement_exit.py - Tracks sys.exit()
- replacement_lock.py, replacement_mp_lock.py, replacement_sem_lock.py - Lock acquisition timing
- replacement_thread_join.py, replacement_pjoin.py - Thread/process join timing
- replacement_signal_fns.py - Signal function replacements
- replacement_poll_selector.py - I/O polling timing
- replacement_get_context.py - Multiprocessing context
Utilities
- runningstats.py - RunningStats class for online statistical calculations (mean, variance)
- scalene_funcutils.py - Function utilities
- scalene_utility.py - General utilities
- sparkline.py - Sparkline generation for memory visualization
- syntaxline.py - Syntax-highlighted source code lines
- adaptive.py - Adaptive sampling logic
- time_info.py - Time measurement utilities
- sorted_reservoir.py - Reservoir sampling for bounded-size sample collection
GUI (scalene/scalene-gui/)
Web-based GUI built with TypeScript, bundled with esbuild.
Core Files:
- index.html.template - Jinja2 template for main GUI page (rendered by scalene_utility.py)
- scalene-gui.ts - Main TypeScript entry point, UI event handlers, initialization
- scalene-gui-bundle.js - Bundled JavaScript output (generated, do not edit directly)
AI Provider Modules:
- openai.ts - OpenAI API integration (sendPromptToOpenAI, fetchOpenAIModels)
- anthropic.ts - Anthropic Claude API integration
- gemini.ts - Google Gemini API integration (sendPromptToGemini, fetchGeminiModels)
- optimizations.ts - Provider dispatch logic, prompt generation
- persistence.ts - localStorage persistence with environment variable fallbacks
Support Files:
- launchbrowser.py - Opens browser to GUI (default port 11235)
- find_browser.py - Cross-platform browser detection
Vendored Assets (for offline support):
- jquery-3.6.0.slim.min.js - jQuery (vendored locally, not loaded from CDN)
- bootstrap.min.css - Bootstrap 5.1.3 CSS
- bootstrap.bundle.min.js - Bootstrap 5.1.3 JS with Popper
- prism.css - Syntax highlighting styles
- favicon.ico - Scalene favicon
- scalene-image.png - Scalene logo
These assets are copied to a temp directory when serving via HTTP, enabling the GUI to work in air-gapped/offline environments.
Building the GUI:
cd scalene/scalene-gui
npx esbuild scalene-gui.ts --bundle --outfile=scalene-gui-bundle.js --format=iife --global-name=ScaleneGUINative Extensions (src/)
C++ code for low-overhead memory allocation tracking:
Headers (src/include/):
- sampleheap.hpp - Sampling heap allocator. Key constant NEWLINE must match Python config.
- memcpysampler.hpp - Intercepts memcpy to track copy volume
- pywhere.hpp - Tracks Python file/line info for allocations
- samplefile.hpp - File-based communication with Python
- sampler.hpp, poissonsampler.hpp, thresholdsampler.hpp - Sampling strategies
- scaleneheader.hpp - Common header definitions
Sources (src/source/):
- libscalene.cpp - Main native library (loaded via LD_PRELOAD)
- pywhere.cpp - Python location tracking implementation
- get_line_atomic.cpp - Atomic line number access
- traceconfig.cpp - Trace configuration
Vendor Libraries (vendor/)
- Heap-Layers/ - Memory allocator infrastructure (by Emery Berger)
- printf/ - Async-signal-safe printf implementation
Key Patterns
Python Version Compatibility
The codebase supports Python 3.8-3.14. Version-specific code uses:
if sys.version_info >= (3, 14):
# Python 3.14+ specific code
else:
# Older Python versionsType Annotation Compatibility (Python 3.8/3.9):
- Do NOT use X | Y union syntax in runtime-evaluated annotations (PEP 604 requires Python 3.10+). Use Optional[X] or Union[X, Y] from typing instead.
- Do NOT use list[X], dict[K, V], tuple[X, ...] in runtime-evaluated annotations (PEP 585 lowercase generics require Python 3.9+). Use List, Dict, Tuple from typing for 3.8 support.
- Adding from __future__ import annotations makes all annotations strings (not evaluated at runtime), which allows modern syntax on older Python. However, this can break code that inspects annotations at runtime (e.g., dataclasses, pydantic).
- The safest approach for this codebase: use typing.Optional, typing.Union, typing.List, typing.Tuple, typing.Dict in all annotation positions that are evaluated at runtime (function signatures, variable annotations outside if TYPE_CHECKING blocks).
Python 3.13 Changes (dis module):
- dis.Instruction.starts_line changed from int | None (line number) to bool
- New dis.Instruction.line_number attribute (int | None) added for the actual line number
- On Python < 3.13, starts_line is only set on the first instruction of each source line; use a line-tracking loop to propagate line numbers to subsequent instructions
Bytecode/Opcode Compatibility (dis module):
- Never match specific opcode names (e.g., JUMP_BACKWARD, JUMP_ABSOLUTE, POP_JUMP_IF_TRUE). Opcode names change across Python versions — for example, Python 3.10 while loops use POP_JUMP_IF_TRUE for backward jumps, Python 3.11+ uses JUMP_BACKWARD, and JUMP_ABSOLUTE was removed in 3.12.
- Always use abstract dis module categories when possible: dis.hasjabs (absolute jump opcodes), dis.hasjrel (relative jump opcodes), dis.hasconst, dis.hasname, etc. These are maintained by CPython and work across all versions.
- For call detection, matching opname.startswith("CALL") is acceptable since that prefix has been stable, but prefer opcode integer sets over name strings for hot paths.
- When checking jump direction (forward vs backward), use instr.argval (which dis resolves to an absolute offset) and compare against instr.offset, rather than relying on opcode names to imply direction.
Python 3.14 Changes:
- argparse now has built-in colored help output (color=True parameter)
- RichArgParser uses Rich for colors on Python < 3.14, native argparse colors on 3.14+
Argument Parsing (scalene_parseargs.py)
class RichArgParser(argparse.ArgumentParser):
"""ArgumentParser that uses Rich for colored output on Python < 3.14.""" def __init__(self, args, *kwargs):
if sys.version_info < (3, 14):
from rich.console import Console
self._console = Console()
else:
self._console = None
super().__init__(args, *kwargs)
The _colorize_help_for_rich() function applies Python 3.14-style colors using Rich markup:
- usage: and options: → bold blue
- Program name → bold magenta
- Long options (--foo) → bold cyan
- Short options (-h) → bold green
- Metavars (FOO) → bold yellow
GUI Patterns
Preventing Browser Password Prompts:
Use autocomplete="one-time-code" on password/API key inputs to prevent browsers from offering to save them:
<input type="password" id="api-key" autocomplete="one-time-code">Show/Hide Password Toggle:
function togglePassword(inputId: string, button: HTMLButtonElement): void {
const input = document.getElementById(inputId) as HTMLInputElement;
if (input.type === "password") {
input.type = "text";
button.textContent = "Hide";
} else {
input.type = "password";
button.textContent = "Show";
}
}Provider Field Visibility:
Use CSS classes to show/hide provider-specific fields:
function toggleServiceFields(): void {
const service = (document.getElementById("service") as HTMLSelectElement).value;
// Hide all provider sections
document.querySelectorAll(".provider-section").forEach((el) => {
(el as HTMLElement).style.display = "none";
});
// Show selected provider section
const section = document.querySelector(.${service}-fields);
if (section) (section as HTMLElement).style.display = "block";
}Persistent Form Elements:
Add class persistent to inputs that should be saved/restored from localStorage:
<input type="text" id="api-key" class="persistent">The
persistence.ts module handles save/restore automatically.Standalone HTML Generation:
The generate_html() function in scalene_utility.py supports a standalone parameter:
- When standalone=False (default): Assets are referenced as local files (e.g., <script src="jquery-3.6.0.slim.min.js">)
- When standalone=True: All assets are embedded inline (JS/CSS as text, images as base64)
The Jinja2 template uses conditionals:
{% if standalone %}
<script>{{ jquery_js }}</script>
<style>{{ bootstrap_css }}</style>
{% else %}
<script src="jquery-3.6.0.slim.min.js"></script>
<link href="bootstrap.min.css" rel="stylesheet">
{% endif %}Module Imports
When importing submodules, be explicit:
Correct - mypy can verify this
import importlib.util
importlib.util.find_spec(mod_name)Wrong - mypy error: Module has no attribute "util"
import importlib
importlib.util.find_spec(mod_name)Testing
Test Files (tests/)
- test_coverup_*.py - Auto-generated coverage tests
- test_runningstats.py - Statistics tests (requires hypothesis)
- test_scalene_json.py - JSON output tests (requires hypothesis)
- test_nested_package_relative_import.py - Import handling tests
Test Dependencies
pip install pytest pytest-asyncio hypothesisRunning Tests Across Python Versions
for v in 3.9 3.10 3.11 3.12 3.13 3.14; do
python$v -m pytest tests/test_coverup_83.py -v
doneFlaky Smoketests
The smoketests in test/ can be flaky due to timing/sampling issues inherent to profiling:
- "No non-zero lines in X" - The profiler didn't collect enough samples. This happens when the test runs too quickly or signal delivery timing varies.
- "Expected function 'X' not returned" - A function wasn't sampled. Common with short-running functions.
These failures are usually timing-related and pass on re-run. They're more common on CI due to variable machine load.
Port Binding in Tests
When testing port availability, never use hardcoded ports - they may already be in use on CI runners:
Bad - port 49200 might be in use
port = 49200
sock.bind(("", port))Good - find an available port first
port = find_available_port(49200, 49300)
if port is None:
return # Skip test if no ports available
sock.bind(("", port))CI/CD (.github/workflows/)
- run-linters.yml - Runs mypy and ruff on Python 3.9-3.14
- tests.yml - Runs pytest on Python 3.9-3.14
- build-and-upload.yml - Build and publish to PyPI
Common Tasks
Adding a New CLI Option
1. Add default value in scalene_arguments.py:
class ScaleneArgumentsDict(TypedDict, total=False):
my_option: bool2. Add argument in scalene_parseargs.py:
parser.add_argument(
"--my-option",
dest="my_option",
action="store_true",
default=defaults.my_option,
help="Description of option",
)Adding a New AI Provider
1. Create provider module (scalene/scalene-gui/newprovider.ts):
export async function sendPromptToNewProvider(
prompt: string,
apiKey: string
): Promise<string> {
// API call implementation
} export async function fetchNewProviderModels(apiKey: string): Promise<string[]> {
// Optional: fetch available models from API
}
2. Update optimizations.ts:
- Import the new module
- Add case in sendPromptToService() switch statement
3. Update index.html.template:
- Add option to #service select dropdown
- Add provider section with API key input, model selector, etc.
- Add CSS for .newprovider-fields visibility
4. Update scalene-gui.ts:
- Add provider to toggleServiceFields() function
- Add refresh handler if dynamic model fetching is supported
- Update getDefaultProvider() if env var support is needed
5. Update persistence.ts (for env var support):
- Add mapping in envKeyMap for new fields
6. Update scalene_utility.py:
- Read environment variable in api_keys dict
- Pass to template rendering
7. Rebuild the bundle:
cd scalene/scalene-gui
npx esbuild scalene-gui.ts --bundle --outfile=scalene-gui-bundle.js --format=iife --global-name=ScaleneGUIEnvironment Variable API Keys
The GUI supports prepopulating API keys from environment variables:
| Element ID | Environment Variable | Provider |
|------------|---------------------|----------|
| api-key | OPENAI_API_KEY | OpenAI |
| anthropic-api-key | ANTHROPIC_API_KEY | Anthropic |
| gemini-api-key | GEMINI_API_KEY or GOOGLE_API_KEY | Gemini |
| azure-api-key | AZURE_OPENAI_API_KEY | Azure OpenAI |
| azure-api-url | AZURE_OPENAI_ENDPOINT | Azure OpenAI |
| aws-access-key | AWS_ACCESS_KEY_ID | Amazon Bedrock |
| aws-secret-key | AWS_SECRET_ACCESS_KEY | Amazon Bedrock |
| aws-region | AWS_DEFAULT_REGION or AWS_REGION | Amazon Bedrock |
Flow:
1. scalene_utility.py reads env vars and passes to Jinja2 template
2. Template injects envApiKeys JavaScript object into page
3. persistence.ts uses env vars as fallbacks when localStorage is empty
Updating Version
Edit scalene/scalene_config.py:
scalene_version = "X.Y.Z"
scalene_date = "YYYY.MM.DD"Dependencies
Key runtime dependencies:
- rich - Terminal formatting and colors
- cloudpickle - Serialization
- pynvml - NVIDIA GPU support (optional)
See requirements.txt for full list.
CLI Structure
Scalene uses a verb-based CLI with two main subcommands:
Profile a program (saves to scalene-profile.json by default)
scalene run [options] yourprogram.pyView an existing profile
scalene view [options] [profile.json]Run Subcommand Options
scalene run prog.py # profile, save to scalene-profile.json
scalene run -o my.json prog.py # save to custom file
scalene run --cpu-only prog.py # profile CPU only (faster)
scalene run -c config.yaml prog.py # load options from config file
scalene run prog.py --- --arg # pass args to programView Subcommand Options
scalene view # open in browser
scalene view --cli # view in terminal
scalene view --html # save to scalene-profile.html
scalene view --standalone # save as self-contained HTML (all assets embedded)
scalene view myprofile.json # open specific profileProfile Completion Message
After profiling completes, Scalene prints instructions for viewing the profile:
Scalene: profile saved to scalene-profile.json
To view in browser: scalene view
To view in terminal: scalene view --cliThe filename is only included in the command if a non-default output file was used.
YAML Configuration
Create a scalene.yaml file with options:
outfile: my-profile.json
cpu-only: true
profile-only: "mypackage,utils"
cpu-percent-threshold: 5Load with: scalene run -c scalene.yaml prog.py
Advanced Options
Use scalene run --help-advanced to see all options including:
- --profile-all - profile all code, not just the target program
- --profile-only PATH - only profile files containing these strings
- --profile-exclude PATH - exclude files containing these strings
- --profile-system-libraries - profile Python stdlib and installed packages (skipped by default)
- --gpu - profile GPU time and memory
- --memory - profile memory usage
- --stacks - collect stack traces
- --profile-interval N - output profiles every N seconds
Smoke Tests
Smoke tests in test/ use the new CLI syntax:
test/smoketest.py
cmd = [sys.executable, "-m", "scalene", "run", "-o", str(outfile), *rest, fname]GitHub Workflows
Workflows in .github/workflows/ use the new CLI:
Profile with interval, then view
- run: python -m scalene run --profile-interval=2 test/testme.py && python -m scalene view --cliProfile with module invocation
- run: python -m scalene run --- -m import_stress_test && python -m scalene view --cliSignal Handling
Scalene uses several Unix signals for profiling. The signal assignments are in scalene_signals.py:
| Signal | Purpose | Platform |
|--------|---------|----------|
| SIGVTALRM | CPU profiling timer (default) | Unix |
| SIGALRM | CPU profiling timer (real time mode) | Unix |
| SIGILL | Start profiling (--on) | Unix |
| SIGBUS | Stop profiling (--off) | Unix |
| SIGPROF | memcpy tracking | Unix |
| SIGXCPU | malloc tracking | Unix |
| SIGXFSZ | free tracking | Unix |
Signal Conflicts with Libraries
Libraries like PyTorch Lightning may also use these signals. The replacement_signal_fns.py module handles conflicts:
On Linux: Uses real-time signals (SIGRTMIN+1 to SIGRTMIN+5) for redirection. When user code sets a handler for a Scalene signal, their handler is redirected to a real-time signal. Calls to raise_signal() and kill() are also redirected transparently.
On macOS/other platforms: Uses handler chaining. Both Scalene's handler and the user's handler are called when the signal fires.
Platform-specific signal handling
_use_rt_signals = sys.platform == "linux" and hasattr(signal, "SIGRTMIN")if _use_rt_signals:
# Linux: redirect to real-time signals
rt_base = signal.SIGRTMIN + 1
_signal_redirects[signal.SIGILL] = rt_base
else:
# macOS: chain handlers
def chained_handler(sig, frame):
scalene_handler(sig, frame)
user_handler(sig, frame)
Frame Line Number Can Be None (Python 3.11+)
In Python 3.11+, frame.f_lineno can be None in edge cases (e.g., during multiprocessing cleanup). Always use a fallback:
lineno = frame.f_lineno if frame.f_lineno is not None else frame.f_code.co_firstlinenoNative Extension Build Issues
C++ Standard Library Conflicts with vendor/printf
The vendor/printf/printf.h header defines macros that conflict with C++ standard library:
#define vsnprintf vsnprintf_
#define snprintf snprintf_This breaks std::vsnprintf in <string> and other headers. Fix: Include C++ standard headers BEFORE vendor headers in src/source/libscalene.cpp:
// Include C++ standard headers FIRST
#include <cstddef>
#include <string>// Then vendor headers that define conflicting macros
#include <heaplayers.h> // Eventually includes printf.h
Profiling Guide
See Scalene-Agents.md for detailed information about interpreting Scalene's profiling output, including Python vs C time, memory metrics, and optimization strategies.
Debugging Guide
See Scalene-Debugging.md for signal handler debugging, async profiling debugging, the profile output pipeline (three separate renderers!), and unbounded growth prevention patterns.
GUI Development Guide
See Scalene-GUI.md for adding new columns, Vega-Lite chart types, pie chart best practices (two-wedge rendering, rotating pies), and the chart rendering flow.
README.md
Scalene: a Python CPU+GPU+memory profiler with AI-powered optimization proposals
by Emery Berger, Sam Stern, and Juan Altmayer Pizzorno.
Scalene community Slack
   !Python versions !License 
(tweet from Ian Ozsvald, author of _High Performance Python_)
!Semantic Scholar success story
_Python Profiler Links to AI to Improve Code Scalene identifies inefficiencies and asks GPT-4 for suggestions_, IEEE Spectrum
Episode 172: Measuring Multiple Facets of Python Performance With Scalene, The Real Python podcast
Scalene web-based user interface: https://scalene-gui.github.io/scalene-gui/
About Scalene
Scalene is a high-performance CPU, GPU and memory profiler for
Python that does a number of things that other Python profilers do not
and cannot do. It runs orders of magnitude faster than many other
profilers while delivering far more detailed information. It is also
the first profiler ever to incorporate AI-powered proposed
optimizations.
AI-powered optimization suggestions
Note
> For optimization suggestions, Scalene supports a variety of AI providers, including Amazon Bedrock, Microsoft Azure, OpenAI, and local models via Ollama. To enable AI-powered optimization suggestions from AI providers, you need to select a provider and, if needed, enter your credentials, in the box under "AI Optimization Options".
> <img width="607" height="316" alt="AI Optimization Options" src="https://github.com/user-attachments/assets/3c803237-063f-481a-8624-5c1d7f205c8a" />
Once you've entered your key and any other needed data, click on the lightning bolt (⚡) beside any line or the explosion (💥) for an entire region of code to generate a proposed optimization. Click on a proposed optimization to copy it to the clipboard.
<img width="571" alt="example proposed optimization" src="https://user-images.githubusercontent.com/1612723/211639968-37cf793f-3290-43d1-9282-79e579558388.png">
You can click as many times as you like on the lightning bolt or explosion, and it will generate different suggested optimizations. Your mileage may vary, but in some cases, the suggestions are quite impressive (e.g., order-of-magnitude improvements).
Quick Start
#### Installing Scalene:
python3 -m pip install -U scaleneor
conda install -c conda-forge scalene#### Using Scalene:
After installing Scalene, you can use Scalene at the command line, or as a Visual Studio Code extension.
<details>
<summary>
Using the Scalene VS Code Extension:
</summary>
First, install <a href="https://marketplace.visualstudio.com/items?itemName=EmeryBerger.scalene">the Scalene extension from the VS Code Marketplace</a> or by searching for it within VS Code by typing Command-Shift-X (Mac) or Ctrl-Shift-X (Windows). Once that's installed, click Command-Shift-P or Ctrl-Shift-P to open the <a href="https://code.visualstudio.com/docs/getstarted/userinterface">Command Palette</a>. Then select <b>"Scalene: AI-powered profiling..."</b> (you can start typing Scalene and it will pop up if it's installed). Run that and, assuming your code runs for at least a second, a Scalene profile will appear in a webview.
<img width="734" alt="Screenshot 2023-09-20 at 7 09 06 PM" src="https://github.com/plasma-umass/scalene/assets/1612723/7e78e3d2-e649-4f02-86fd-0da2a259a1a4">
</details>
<details>
<summary>
Commonly used command-line options:
</summary>
Scalene uses a verb-based command structure with two main commands: run (to profile) and view (to display results).
Profile a program (saves to scalene-profile.json)
scalene run your_prog.py
python3 -m scalene run your_prog.py # equivalent alternativeView a profile
scalene view # open profile in browser
scalene view --cli # view in terminal
scalene view --html # save to scalene-profile.html
scalene view --standalone # save as self-contained HTMLCommon profiling options
scalene run --cpu-only your_prog.py # only profile CPU (faster)
scalene run -o results.json your_prog.py # custom output filename
scalene run -c config.yaml your_prog.py # load options from config filePass arguments to your program (use --- separator)
scalene run your_prog.py --- --arg1 --arg2Get help
scalene --help # main help
scalene run --help # profiling options
scalene run --help-advanced # advanced profiling options
scalene view --help # viewing options</details>
<details>
<summary>
Using a YAML configuration file:
</summary>
You can store Scalene options in a YAML configuration file and load them with -c or --config:
scalene run -c scalene.yaml your_prog.pyExample scalene.yaml:
Output options
outfile: my-profile.jsonProfiling mode (use only one)
cpu-only: true # CPU profiling only (faster)
gpu: true # Include GPU profiling
memory: true # Include memory profiling
Filter what gets profiled
profile-only: "mypackage,mymodule" # Only profile these paths
profile-exclude: "tests,venv" # Exclude these paths
profile-all: false # Profile all code, not just targetPerformance tuning
cpu-percent-threshold: 1 # Min CPU% to report (default: 1)
cpu-sampling-rate: 0.01 # Sampling interval in seconds
malloc-threshold: 100 # Min allocations to reportOther options
use-virtual-time: false # Measure CPU time only (not I/O)
stacks: false # Collect stack traces
memory-leak-detector: true # Detect likely memory leaksCommand-line arguments override config file settings.
</details>
<details>
<summary>
Using Scalene programmatically in your code:
</summary>
Invoke using scalene as above and then:
from scalene import scalene_profilerTurn profiling on
scalene_profiler.start()your code
Turn profiling off
scalene_profiler.stop()from scalene.scalene_profiler import enable_profilingwith enable_profiling():
# do something
</details>
<details>
<summary>
Using Scalene to profile only specific functions via <code>@profile</code>:
</summary>
Just preface any functions you want to profile with the @profile decorator and run it with Scalene:
do not import profile!
@profile
def slow_function():
import time
time.sleep(3)
</details>
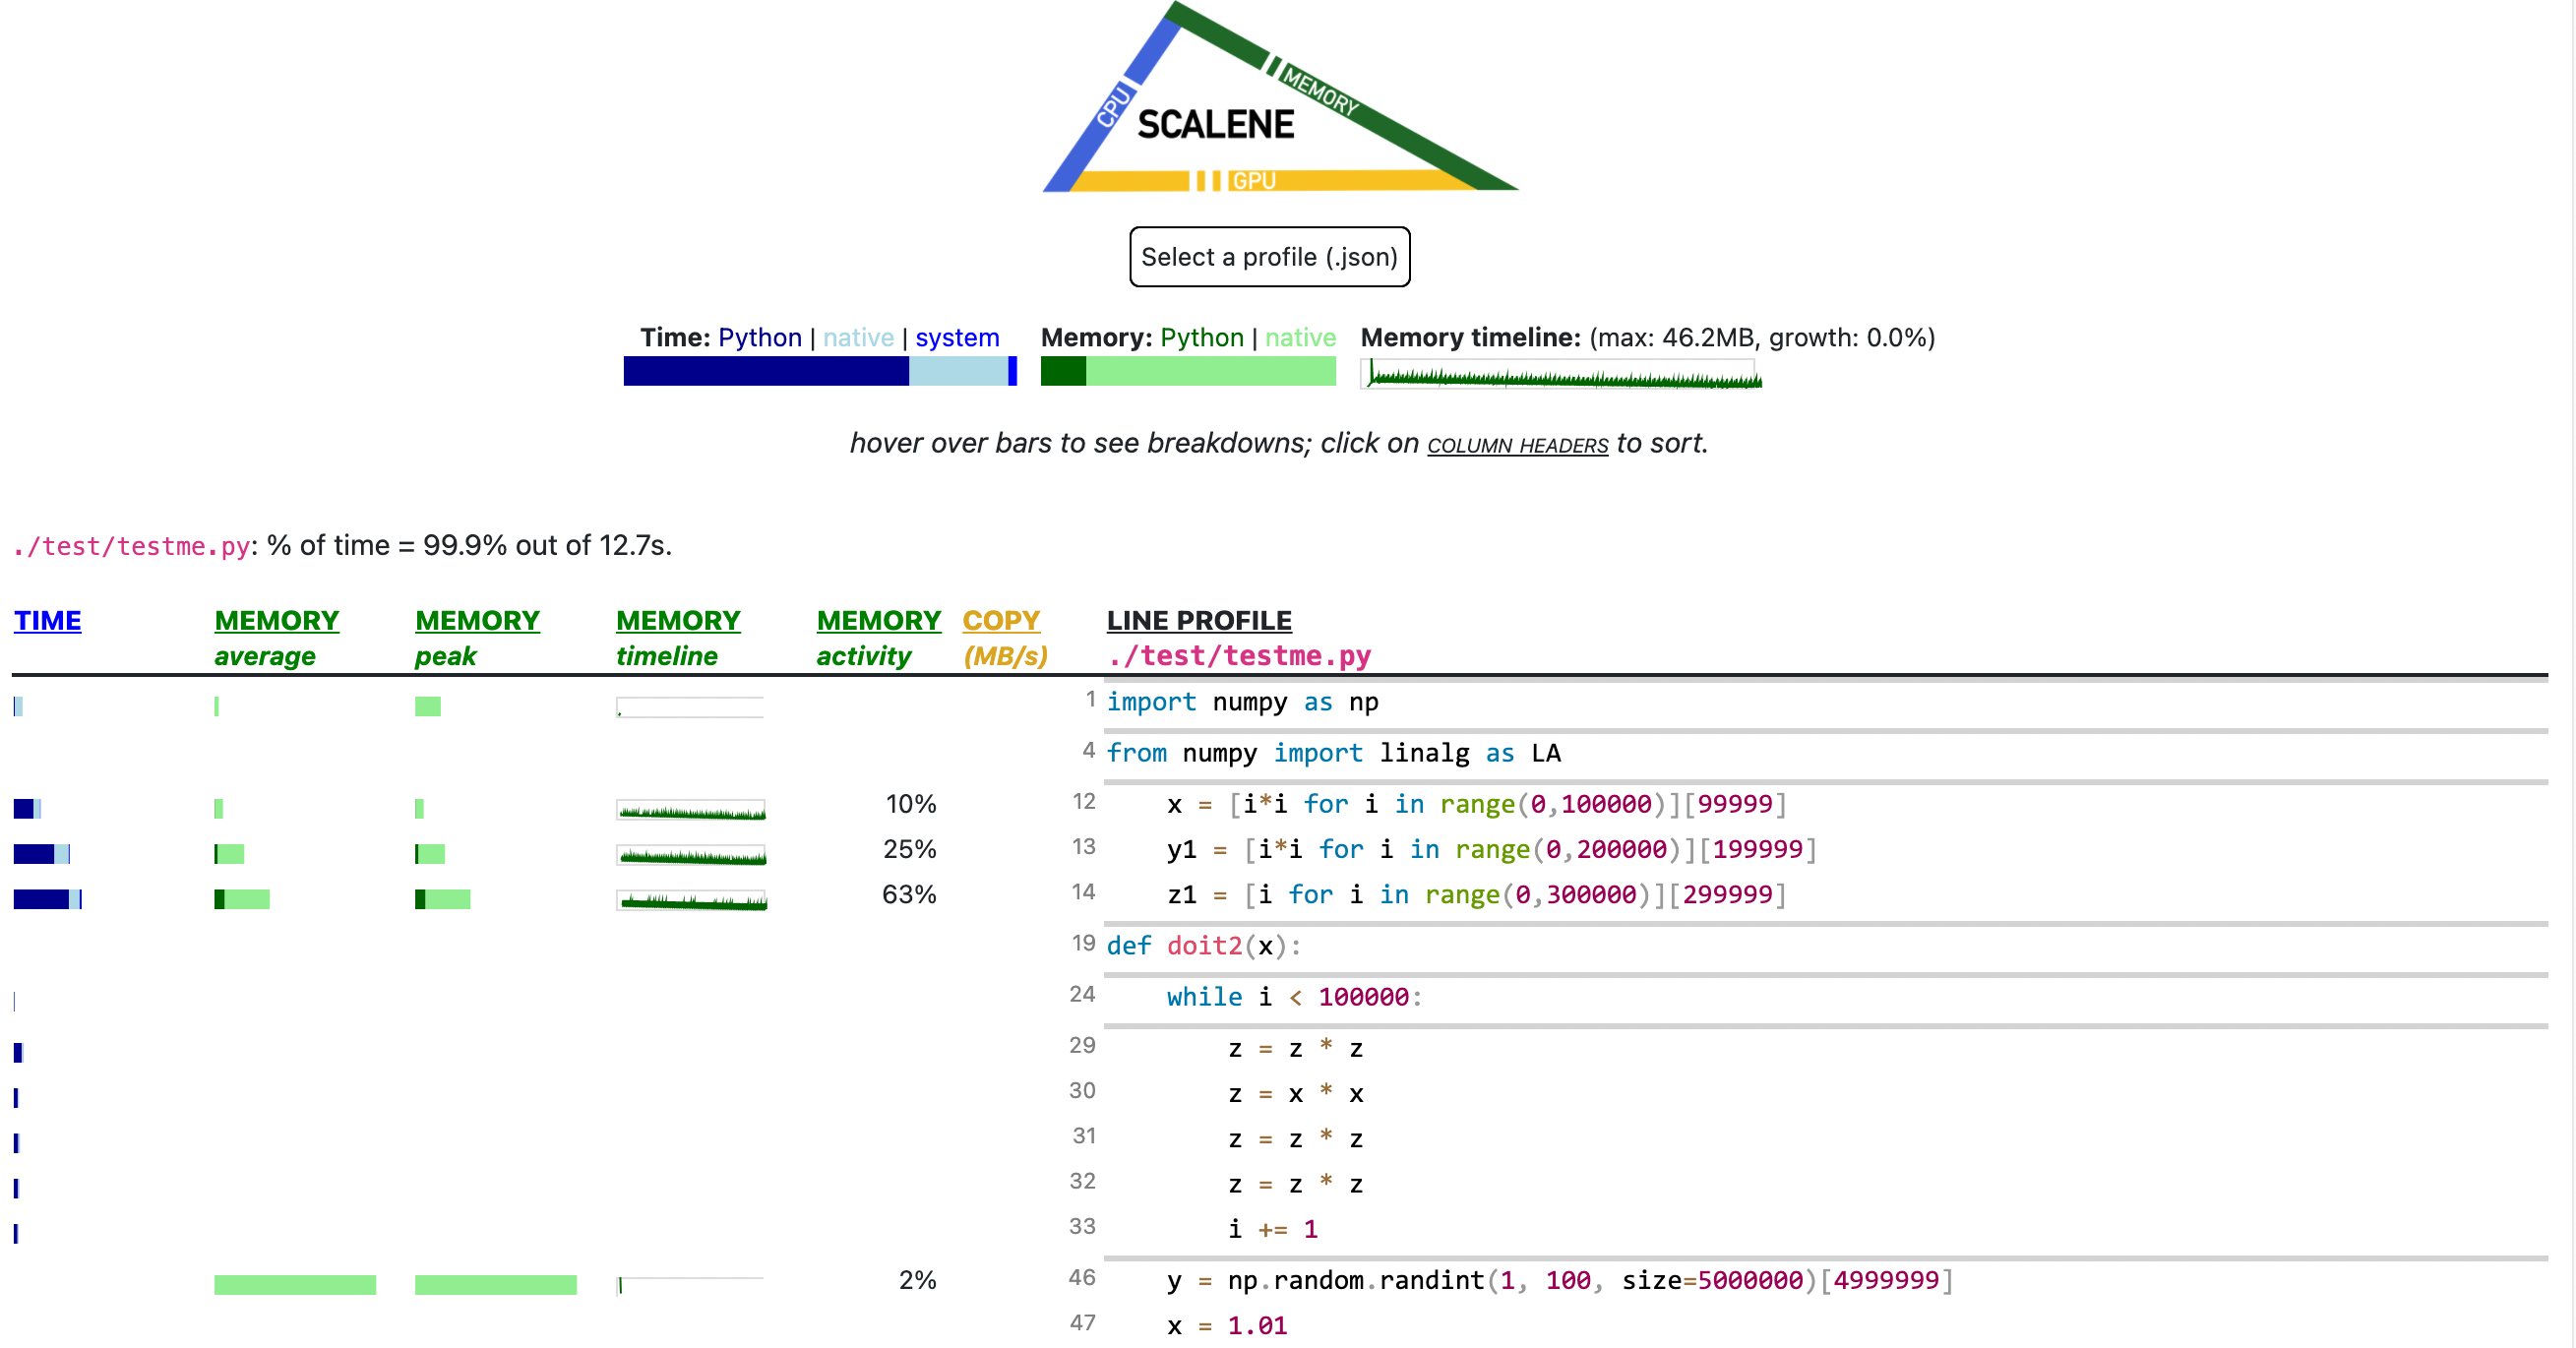
#### Web-based GUI
Scalene has both a CLI and a web-based GUI (demo here).
By default, once Scalene has profiled your program, it will open a
tab in a web browser with an interactive user interface (all processing is done
locally). Hover over bars to see breakdowns of CPU and memory
consumption, and click on underlined column headers to sort the
columns. The GUI works fully offline with no internet connection required.
Use scalene view --standalone to generate a completely self-contained HTML file with all assets embedded, perfect for sharing or archiving.
Scalene Overview
Scalene talk (PyCon US 2021)
This talk presented at PyCon 2021 walks through Scalene's advantages and how to use it to debug the performance of an application (and provides some technical details on its internals). We highly recommend watching this video!

Fast and Accurate
- Scalene is _fast_. It uses sampling instead of instrumentation or relying on Python's tracing facilities. Its overhead is typically no more than 10-20% (and often less).
- Scalene is accurate. We tested CPU profiler accuracy and found that Scalene is among the most accurate profilers, correctly measuring time taken.
- Scalene performs profiling _at the line level_ _and_ _per function_, pointing to the functions and the specific lines of code responsible for the execution time in your program.
CPU profiling
- Scalene separates out time spent in Python from time in native code (including libraries). Most Python programmers aren't going to optimize the performance of native code (which is usually either in the Python implementation or external libraries), so this helps developers focus their optimization efforts on the code they can actually improve.
- Scalene highlights hotspots (code accounting for significant percentages of CPU time or memory allocation) in red, making them even easier to spot.
- Scalene also separates out system time, making it easy to find I/O bottlenecks.
GPU profiling
- Scalene reports GPU time (currently limited to NVIDIA-based systems).
Memory profiling
- Scalene profiles memory usage. In addition to tracking CPU usage, Scalene also points to the specific lines of code responsible for memory growth. It accomplishes this via an included specialized memory allocator.
- Scalene separates out the percentage of memory consumed by Python code vs. native code.
- Scalene produces _per-line_ memory profiles.
- Scalene identifies lines with likely memory leaks.
- Scalene profiles _copying volume_, making it easy to spot inadvertent copying, especially due to crossing Python/library boundaries (e.g., accidentally converting numpy arrays into Python arrays, and vice versa).
Other features
- Scalene can produce reduced profiles (via --reduced-profile) that only report lines that consume more than 1% of CPU or perform at least 100 allocations.
- Scalene supports @profile decorators to profile only specific functions.
- When Scalene is profiling a program launched in the background (via &), you can suspend and resume profiling.
Comparison to Other Profilers
Performance and Features
Below is a table comparing the performance and features of various profilers to Scalene.
!Performance and feature comparison
- Slowdown: the slowdown when running a benchmark from the Pyperformance suite. Green means less than 2x overhead. Scalene's overhead is just a 35% slowdown.
Scalene has all of the following features, many of which only Scalene supports:
- Lines or functions: does the profiler report information only for entire functions, or for every line -- Scalene does both.
- Unmodified Code: works on unmodified code.
- Threads: supports Python threads.
- Multiprocessing: supports use of the multiprocessing library -- _Scalene only_
- Python vs. C time: breaks out time spent in Python vs. native code (e.g., libraries) -- _Scalene only_
- System time: breaks out system time (e.g., sleeping or performing I/O) -- _Scalene only_
- Profiles memory: reports memory consumption per line / function
- GPU: reports time spent on an NVIDIA GPU (if present) -- _Scalene only_
- Memory trends: reports memory use over time per line / function -- _Scalene only_
- Copy volume: reports megabytes being copied per second -- _Scalene only_
- Detects leaks: automatically pinpoints lines responsible for likely memory leaks -- _Scalene only_
Output
If you include the --cli option, Scalene prints annotated source code for the program being profiled
(as text, JSON (--json), or HTML (--html)) and any modules it
uses in the same directory or subdirectories (you can optionally have
it --profile-all and only include files with at least a--cpu-percent-threshold of time). Here is a snippet frompystone.py.
* Memory usage at the top: Visualized by "sparklines", memory consumption over the runtime of the profiled code.
* "Time Python": How much time was spent in Python code.
* "native": How much time was spent in non-Python code (e.g., libraries written in C/C++).
* "system": How much time was spent in the system (e.g., I/O).
* "GPU": (not shown here) How much time spent on the GPU, if your system has an NVIDIA GPU installed.
* "Memory Python": How much of the memory allocation happened on the Python side of the code, as opposed to in non-Python code (e.g., libraries written in C/C++).
* "net": Positive net memory numbers indicate total memory allocation in megabytes; negative net memory numbers indicate memory reclamation.
* "timeline / %": Visualized by "sparklines", memory consumption generated by this line over the program runtime, and the percentages of total memory activity this line represents.
* "Copy (MB/s)": The amount of megabytes being copied per second (see "About Scalene").
Scalene
The following command runs Scalene on a provided example program.
scalene test/testme.py<details>
<summary>
Click to see all Scalene's options (available by running with <code>--help</code>)
</summary>
% scalene --help
Scalene: a high-precision CPU and memory profiler, version 1.5.51 (2025.01.29)
https://github.com/plasma-umass/scalenecommands:
run Profile a Python program (saves to scalene-profile.json)
view View an existing profile in browser or terminal
examples:
% scalene run your_program.py # profile, save to scalene-profile.json
% scalene view # view scalene-profile.json in browser
% scalene view --cli # view profile in terminal
in Jupyter, line mode:
%scrun [options] statement
in Jupyter, cell mode:
%%scalene [options]
your code here
% scalene run --help
Profile a Python program with Scalene.
examples:
% scalene run prog.py # profile, save to scalene-profile.json
% scalene run -o my.json prog.py # save to custom file
% scalene run --cpu-only prog.py # profile CPU only (faster)
% scalene run -c scalene.yaml prog.py # load options from config file
% scalene run prog.py --- --arg # pass args to program
% scalene run --help-advanced # show advanced options
options:
-h, --help show this help message and exit
-o, --outfile OUTFILE output file (default: scalene-profile.json)
--cpu-only only profile CPU time (no memory/GPU)
-c, --config FILE load options from YAML config file
--help-advanced show advanced options
% scalene run --help-advanced
Advanced options for scalene run:
background profiling:
Use --off to start with profiling disabled, then control it from another terminal:
% scalene run --off prog.py # start with profiling off
% python3 -m scalene.profile --on --pid <PID> # resume profiling
% python3 -m scalene.profile --off --pid <PID> # suspend profiling
options:
--profile-all profile all code, not just the target program
--profile-only PATH only profile files containing these strings (comma-separated)
--profile-exclude PATH exclude files containing these strings (comma-separated)
--profile-system-libraries profile Python stdlib and installed packages (default: skip)
--gpu profile GPU time and memory
--memory profile memory usage
--stacks collect stack traces
--profile-interval N output profiles every N seconds (default: inf)
--use-virtual-time measure only CPU time, not I/O or blocking
--cpu-percent-threshold N only report lines with at least N% CPU (default: 1%)
--cpu-sampling-rate N CPU sampling rate in seconds (default: 0.01)
--allocation-sampling-window N allocation sampling window in bytes
--malloc-threshold N only report lines with at least N allocations (default: 100)
--program-path PATH directory containing code to profile
--memory-leak-detector EXPERIMENTAL: report likely memory leaks
--on start with profiling on (default)
--off start with profiling off
% scalene view --help
View an existing Scalene profile.
examples:
% scalene view # open in browser
% scalene view --cli # view in terminal
% scalene view --html # save to scalene-profile.html
% scalene view --standalone # save as self-contained HTML
% scalene view myprofile.json # open specific profile in browser
options:
-h, --help show this help message and exit
--cli display profile in the terminal
--html save to scalene-profile.html (no browser)
--standalone save as self-contained HTML with all assets embedded
-r, --reduced only show lines with activity (--cli mode)
</details>
Scalene with Jupyter
<details>
<summary>
Instructions for installing and using Scalene with Jupyter notebooks
</summary>
This notebook illustrates the use of Scalene in Jupyter.
Installation:
!pip install scalene
%load_ext scaleneLine mode:
%scrun [options] statementCell mode:
%%scalene [options]
code...
code...</details>
Installation
<details open>
<summary>Using <code>pip</code> (Mac OS X, Linux, Windows, and WSL2)</summary>
Scalene is distributed as a pip package and works on Mac OS X, Linux (including Ubuntu in Windows WSL2) and Windows platforms.
Note for Windows users
> Starting with Scalene 2.0, Windows supports full memory profiling. If you
encounter issues, ensure you have the Visual C++ Redistributable
installed. If building from source, you will need Visual C++ Build Tools and CMake.
You can install it as follows:
% pip install -U scaleneor
% python3 -m pip install -U scaleneYou may need to install some packages first.
See https://stackoverflow.com/a/19344978/4954434 for full instructions for all Linux flavors.
For Ubuntu/Debian:
% sudo apt install git python3-all-dev</details>
<details>
<summary>Using <code>conda</code> (Mac OS X, Linux, Windows, and WSL2)</summary>
% conda install -c conda-forge scaleneScalene is distributed as a conda package and works on Mac OS X, Linux (including Ubuntu in Windows WSL2) and Windows platforms.
Note for Windows users
> Starting with Scalene 2.0, Windows supports full memory profiling. If you
encounter issues, ensure you have the Visual C++ Redistributable
installed.
</details>
<details>
<summary>On ArchLinux</summary>
You can install Scalene on Arch Linux via the AUR
package. Use your favorite AUR helper, or
manually download the PKGBUILD and run makepkg -cirs to build. Note that this will placelibscalene.so in /usr/lib; modify the below usage instructions accordingly.
</details>
Frequently Asked Questions
<details>
<summary>
Can I use Scalene with PyTest?
</summary>
A: Yes! You can run it as follows (for example):
scalene run -m pytest your_test.py
or
python3 -m scalene run -m pytest your_test.py
</details>
<details>
<summary>
Is there any way to get shorter profiles or do more targeted profiling?
</summary>
A: Yes! There are several options:
1. Use --reduced-profile to include only lines and files with memory/CPU/GPU activity.
2. Use --profile-only to include only filenames containing specific strings (as in, --profile-only foo,bar,baz).
3. Decorate functions of interest with @profile to have Scalene report _only_ those functions.
4. Turn profiling on and off programmatically by importing Scalene profiler (from scalene import scalene_profiler) and then turning profiling on and off via scalene_profiler.start() and scalene_profiler.stop(). By default, Scalene runs with profiling on, so to delay profiling until desired, use the --off command-line option (scalene run --off yourprogram.py).
</details>
<details>
<summary>
How do I run Scalene in PyCharm?
</summary>
A: In PyCharm, you can run Scalene at the command line by opening the terminal at the bottom of the IDE and running a Scalene command (e.g., scalene run <your program>). Then use scalene view --html to generate an HTML file (scalene-profile.html) that you can view in the IDE.
</details>
<details>
<summary>
How do I use Scalene with Django?
</summary>
A: Pass in the --noreload option (see https://github.com/plasma-umass/scalene/issues/178).
</details>
<details>
<summary>
Does Scalene work with gevent/Greenlets?
</summary>
A: Yes! Put the following code in the beginning of your program, or modify the call to monkey.patch_all as below:
from gevent import monkey
monkey.patch_all(thread=False)</details>
<details>
<summary>
How do I use Scalene with PyTorch on the Mac?
</summary>
A: Scalene works with PyTorch version 1.5.1 on Mac OS X. There's a bug in newer versions of PyTorch (https://github.com/pytorch/pytorch/issues/57185) that interferes with Scalene (discussion here: https://github.com/plasma-umass/scalene/issues/110), but only on Macs.
</details>
Technical Information
For details about how Scalene works, please see the following paper, which won the Jay Lepreau Best Paper Award at OSDI 2023: Triangulating Python Performance Issues with Scalene. (Note that this paper does not include information about the AI-driven proposed optimizations.)
<details>
<summary>
To cite Scalene in an academic paper, please use the following:
</summary>
@inproceedings{288540,
author = {Emery D. Berger and Sam Stern and Juan Altmayer Pizzorno},
title = {Triangulating Python Performance Issues with {S}calene},
booktitle = {{17th USENIX Symposium on Operating Systems Design and Implementation (OSDI 23)}},
year = {2023},
isbn = {978-1-939133-34-2},
address = {Boston, MA},
pages = {51--64},
url = {https://www.usenix.org/conference/osdi23/presentation/berger},
publisher = {USENIX Association},
month = jul
}</details>
Success Stories
If you use Scalene to successfully debug a performance problem, please add a comment to this issue!
Acknowledgements
Logo created by Sophia Berger.
This material is based upon work supported by the National Science
Foundation under Grant No. 1955610. Any opinions, findings, and
conclusions or recommendations expressed in this material are those of
the author(s) and do not necessarily reflect the views of the National
Science Foundation.